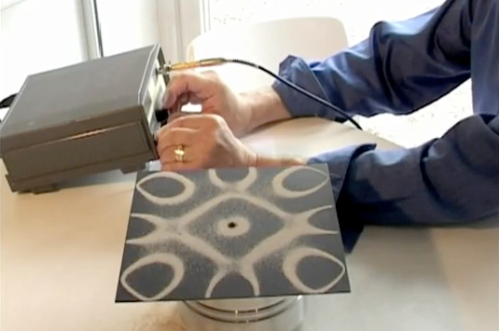
I just came across Evan Grant’s fascinating TED 2009 talk on “Making Sound Visible through Cymatics.” Cymatics describes the process of visualizing sound. Sound waves create vibrations—patterns—that can be visualized on the surface of a plate covered with sand as depicted below.
In his talk, Evan demonstrates how different sound frequencies create distinctly different geometric sand patterns. As the sound frequencies increase, so does the complexity of the sand patterns themselves. He describes cymatics as a “looking glass into a hidden world” that can “unveil the substance of things not seen.”
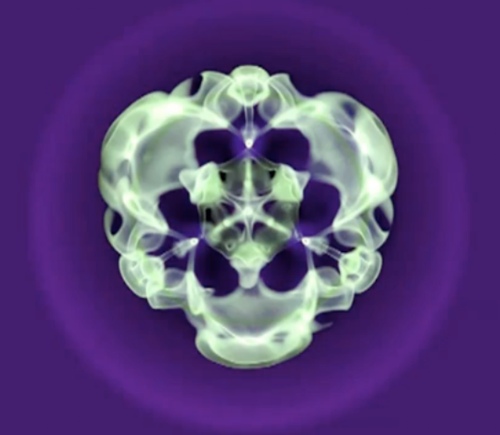
For example, a lexicon of dolphin language is actually being created using cymatics by visualizing the sonar beams that dolphins emit. Cymatics can also be used to create natural art forms. The picture below is a visualization of Beethoven’s 9th Symphony created using a cymatic device. Cymatics can also recreate archetypal forms of nature such as snowflakes or starfish.
It’s not entirely clear what all this means. As Evan notes, cymatics is still a very young field and not many people are working in this line of research. Cymatics shows that sound has form and can effect form in matter. So Evan asks us to think about the universe forming, “about the immense sound of the universe forming, and to ponder on that … perhaps cymatics had an influence on the formation of the universe itself.” Watch Evan’s 5-minute TED Talk below.
In closing, Evan encourage us to apply our passions, knowledge and skills to areas like cymatics. I find this field very interesting because of the analogies with crisis mapping. As often mentioned on iRevolution, crisis mapping is about rendering otherwise hidden patterns visible to improve situational awareness and decision-making.
One can think of conflict processes as sound waves or vibrations and the “plates” as crisis mapping platforms like Ushahidi. We need to “vibrate” conflict data at different frequencies and to develop visual analytics—different templates for data visualization—in order to visualize patterns in a compelling fashion. One might call this the “String Theory” of Crisis Mapping.
——————————————————————————————–
A colleague and I tried analyzing conflict data as music back in 2006 when I was at the Santa Fe Institute (SFI). I had been inspired by the work of an Italian geophysicist who had taken seismic data (tremblings of the earth) and analyzed the data as music in order to look for “melodic” patterns. We used conflict event-data from Afghanistan but the result was not particularly music to my ears—but then again, neither is war.


Pingback: The Biggest Problem with “Crisis Maps” « iRevolution
Pingback: Cymatics
It great we are finally working as a species on something universal. It is highly possible the Universal Language was the first language spoken by the Originators. As fractals we are all looking forward to the time we can once again be whole.
Hello,
I’m a glassblower and am interested in creating these Cymric patterns in glass. I’m pondering how to fume metals into glass while sending frequencies either through the glass itself or through the torch. If you have any questions or comments I would be interested in hearing them. Keep up the good work 🙂