The tragic 6.4 magnitude earthquake struck southern Taiwan shortly before 4 in the morning on Saturday, February 6th. Later in the day, aerial robots were used to capture areal videos and images of the disaster damage, like below.
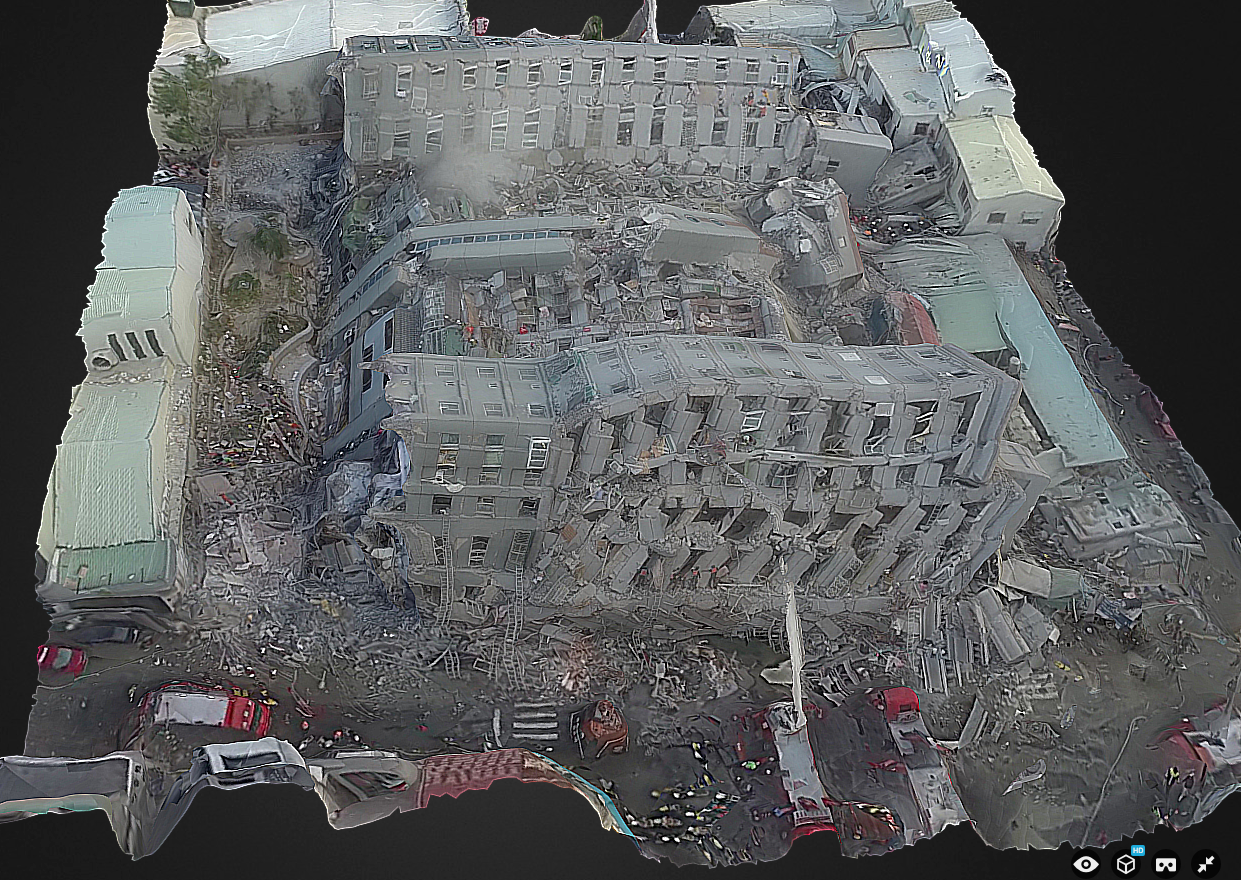
Within 10 hours of the earthquake, Dean Hosp at Taiwan’s National Cheng Kung University used screenshots of aerial videos posted on YouTube by various media outlets to create the 3D model below. As such, Dean used “second hand” data to create the model, which is why it is low resolution. Having the original imagery first hand would enable a far higher-res 3D model. Says Dean: “If I can fly myself, results can produce more fine and faster.”
Click the images below to enlarge.
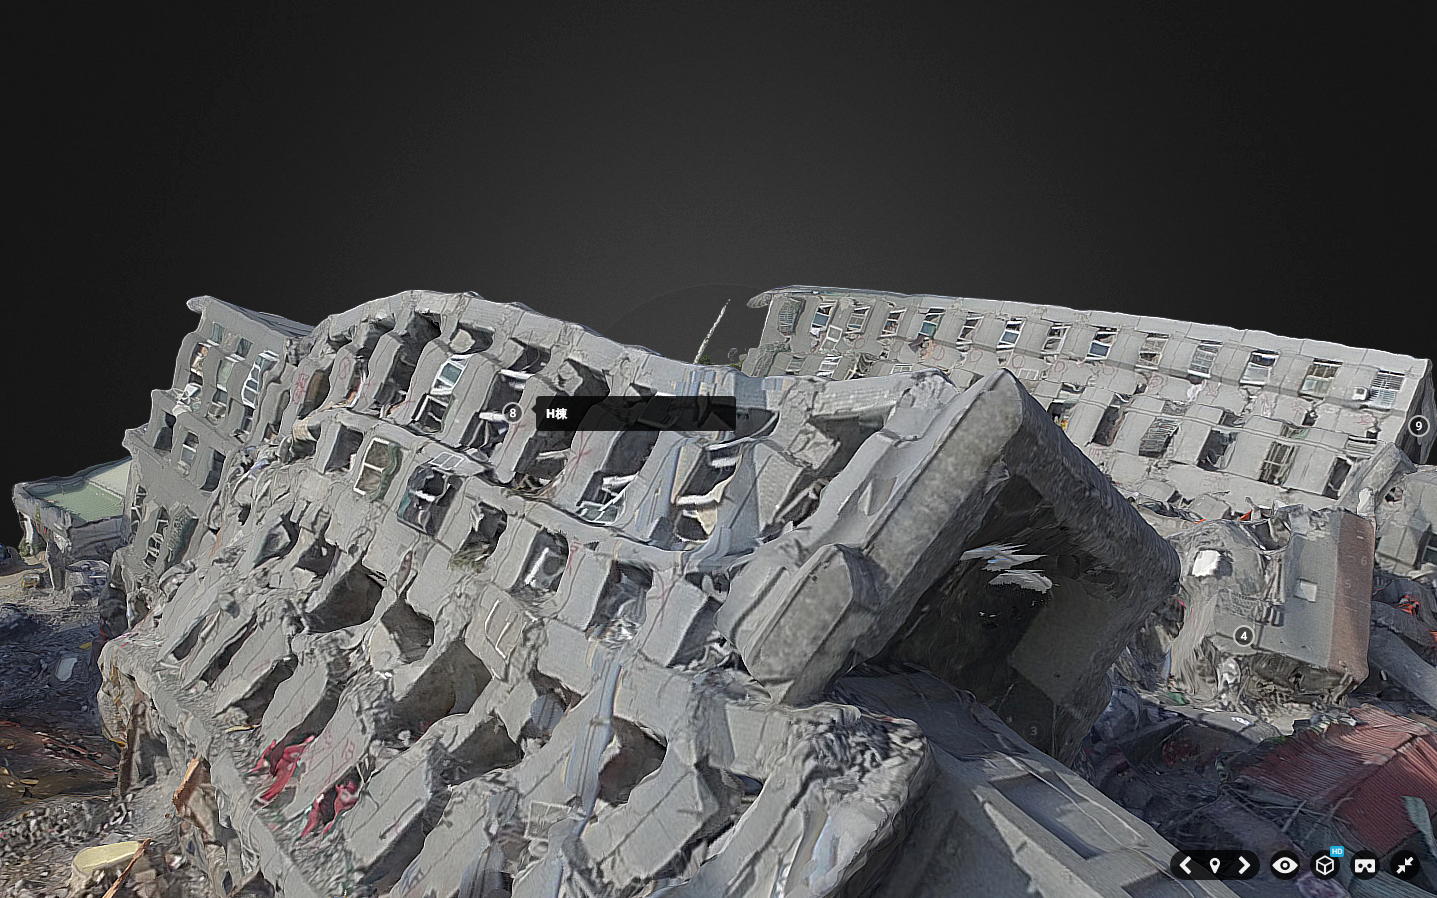
Update: About 48 hours after the earthquake, Dean and team used their own UAV to create this much higher resolution version (see below), which they also annotated (click to enlarge).
Here’s the embedded 3D model:
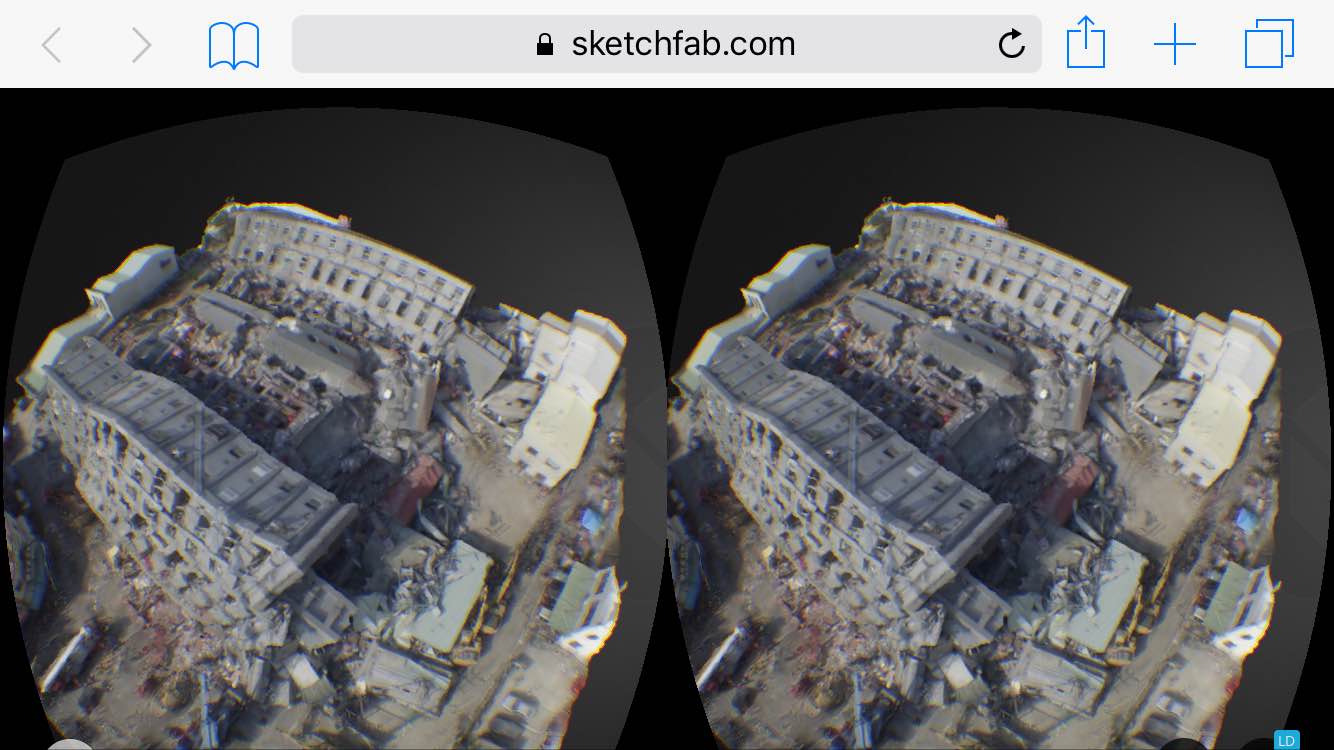
These 3D models were processed using AgiSoft PhotoScan and then uploaded to Sketchfab on the same day the earthquake struck. I’ve blogged about Sketchfab in the past—see this first-ever 3D model of a refugee camp, for example. A few weeks ago, Sketchfab added a Virtual Reality feature to their platform, so I just tried this out on the above model.
The model appears equally crisp when viewed in VR mode on a mobile device (using Google Cardboard in my case). Simply open this page on your mobile device to view the disaster damage in VR. This works rather well; the model does seem to be of high resolution in Virtual Reality as well.
This is a good first step vis-a-vis VR applications. As a second step, we need to develop 3D disaster ontologies to ensure that imagery analysts actually interpret 3D models in the same way. As a third step, we need to combine VR headsets with wearable technology that enables the end-user to annotate (or draw on) the 3D models directly within the same VR environment. This would make the damage assessment process more intuitive while also producing 3D training data for the purposes of machine learning—and thus automated feature detection.
I’m still actively looking for a VR platform that will enable this, so please do get in touch if you know of any group, company, research institute, etc., that would be interested in piloting the 3D analysis of disaster damage from the Taiwan or Nepal Earthquakes entirely within a VR solution. Thank you.
Click here to view 360 aerial visual panoramas of the disaster damage.
Many thanks to Sebastien Hodapp for pointing me to the Taiwan model.
In 2009 I wrote this blog post entitled “The Biggest Problem with Crisis Maps.” The gist of the post: crises are dynamic over time and space but our crisis maps are 2D and static. More than half-a-decade later, Digital Humanitarians have still not escaped from Plato’s Cave. Instead, they continue tracing 2D shadows cast by crisis data projected on their 2D crisis maps. Is there value in breaking free from our 2D data chains? Yes. And the time will soon come when Digital Humanitarians will have to make a 3D run for it.
Aerial imagery captured by UAVs (Unmanned Aerial Vehicles) can be used to create very high-resolution 3D point clouds like the one below. It only took a 4-minute UAV flight to capture the imagery for this point cloud. Of course, the processing time to convert the 2D imagery to 3D took longer. But solutions already exist to create 3D point clouds on the fly, and these solutions will only get more sophisticated over time.
Stitching 2D aerial imagery into larger “mosaics” is already standard practice in the UAV space. But that’s so 2014. What we need is the ability to stitch together 3D point clouds. In other words, I should be able to mesh my 3D point cloud of a given area with other point clouds that overlap spatially with mine. This would enable us to generate high-resolution 3D point clouds for larger areas. Lets call these accumulated point clouds Cumulus Clouds. We could then create baseline data in the form of Cumulus Clouds. And when a disaster happens, we could create updated Cumulus Clouds for the affected area and compare them with our baseline Cumulus Cloud for changes. In other words, instead of solely generating 2D mapping data for the Missing Maps Project, we could add Cumulus Clouds.
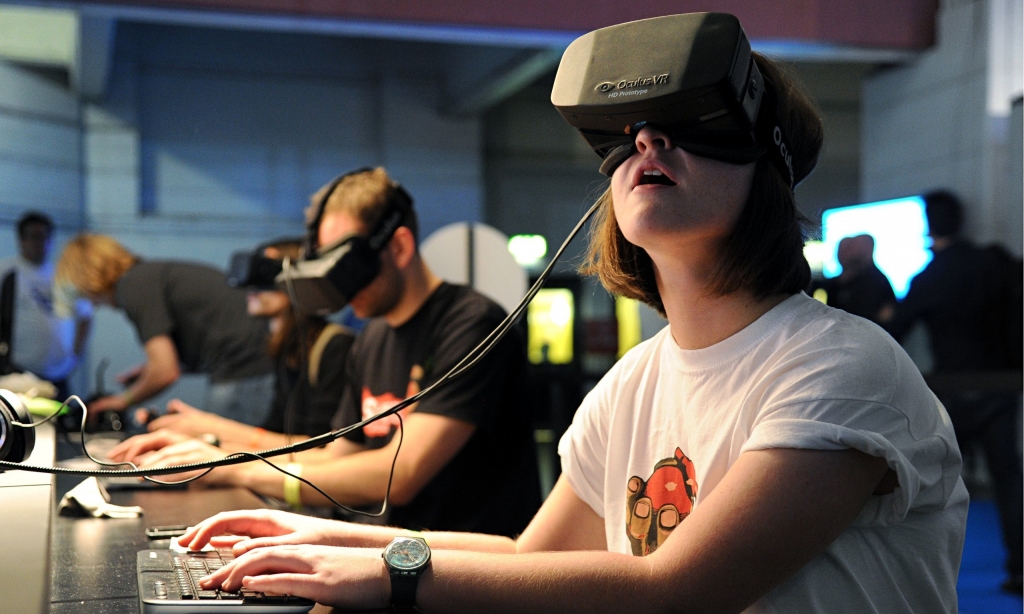
Meanwhile, breakthroughs in Virtual Reality will enable Digital Humanitarians to swarm through these Cumulus Clouds. Innovations such as Oculus Rift, the first consumer-targeted virtual reality headsets, may become the pièce de résistance of future Digital Humanitarians. This shift to 3D doesn’t mean that our methods for analyzing 2D crisis maps are obsolete when we leave Plato’s Cave. We simply need to extend our microtasking and crowdsourcing solutions to the 3D space. As such, a 3D “tasking manager” would just assign specific areas of a Cumulus Cloud to individual Digital Jedis. This is no different to how field-based disaster assessment surveys get carried out in the “Solid World” (Real Word). Our Oculus headsets would “simply” need to allow Digital Jedis to “annotate” or “trace various” sections of the Cumulus Clouds just like they already do with 2D maps; otherwise we’ll be nothing more than disaster tourists.
The shift to 3D is not without challenges. This shift necessarily increases visual complexity. Indeed, 2D images are a radical (and often welcome) simplification of the Solid World. This simplification comes with a number of advantages like reducing the signal to noise ratio. But 2D imagery, like satellite imagery, “hides” information, which is one reason why imagery-interpretation and analysis is difficult, often requiring expert training. But 3D is more intuitive; 3D is the world we live in. Interpreting signs of damage in 3D may thus be easier than doing so with a lot less information in 2D. Of course, this also depends on the level of detail required for the 3D damage assessments. Regardless, appropriate tutorials will need to be developed to guide the analysis of 3D point clouds and Cumulus Clouds. Wait a minute—shouldn’t existing assessment methodologies used for field-based surveys in the Solid World do the trick? After all, the “Real World” is in 3D last time I checked.
Ah, there’s the rub. Some of the existing methodologies developed by the UN and World Bank to assess disaster damage are largely dysfunctional. Take for example the formal definition of “partial damage” used by the Bank to carry out their post-disaster damage and needs assessments: “the classification used is to say that if a building is 40% damaged, it needs to be repaired. In my view this is too vague a description and not much help. When we say 40%, is it the volume of the building we are talking about or the structural components?” The question is posed by a World Bank colleague with 15+ years of experience. Since high-resolution 3D data enables more of us to more easily see more details, our assessment methodologies will necessarily need to become more detailed both for manual and automated analysis solutions. This does add more complexity but such is the price if we actually want reliable damage assessments regardless.
Isn’t it ironic that our shift to Virtual Reality may ultimately improve the methodologies (and thus data quality) of field-based surveys carried out in the Solid World? In any event, I can already “hear” the usual critics complaining; the usual theatrics of cave-bound humanitarians who eagerly dismiss any technology that appears after the radio (and maybe SMS). Such is life. Moving along. I’m exploring practical ways to annotate 3D point clouds here but if anyone has additional ideas, do please get in touch. I’m also looking for any solutions out there (imperfect ones are fine too) that can can help us build Cumulus Clouds—i.e., stitch overlapping 3D point clouds. Lastly, I’d love to know what it would take to annotate Cumulus Clouds via Virtual Reality. Thanks!
Acknowledgements: Thanks to colleagues from OpenAerialMap, Cadasta and MapBox for helping me think through some of the ideas above.
I thrive when working across disciplines, building diverse cross-cutting coalitions to create, translate and apply innovative strategies driven by shared values. This has enabled the 20+ organizations I’ve worked with, and those I’ve led, to accelerate meaningful and inclusive social impact.
Which is why I've been called a social entrepreneur and a translational leader by successful innovators. President Clinton once called me a digital pioneer, while recent colleagues describe me as kind, dedicated, values-driven, authentic, creative, ethical, and impactful.