
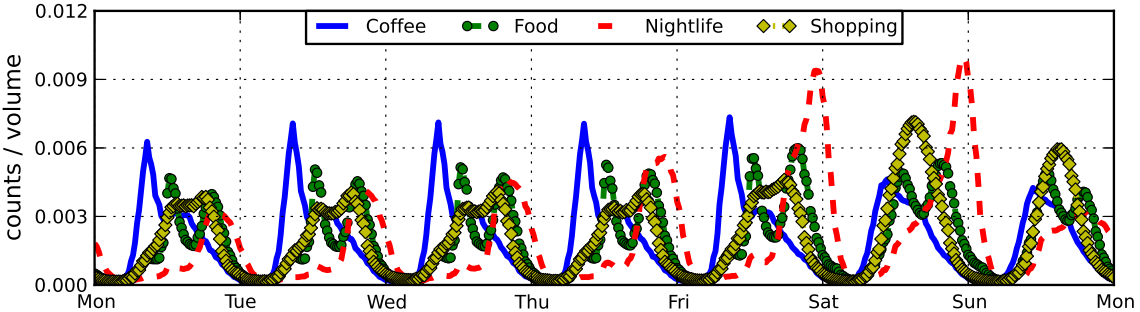
In this new study “Extracting Diurnal Patterns of Real World Activity from Social Media” (PDF), authors Nir Grinberg, Mor Naaman, Blake Shaw and Gild Lotan analyze Fousquare check-in’s and tweets to capture real-world activities related to coffee, food, nightlife and shopping. Here’s what an average week looks like on Foursquare, for example (click to enlarge):
“When rare events at the scale of Hurricane Sandy happen, we expect them to leave an unquestionable mark on Social Media activity.” So the authors applied the same methods used to produce the above graph to visualize and understand changes in behavior during Hurricane Sandy as reflected on Foursquare and Twitter. The results are displayed below (click to enlarge).
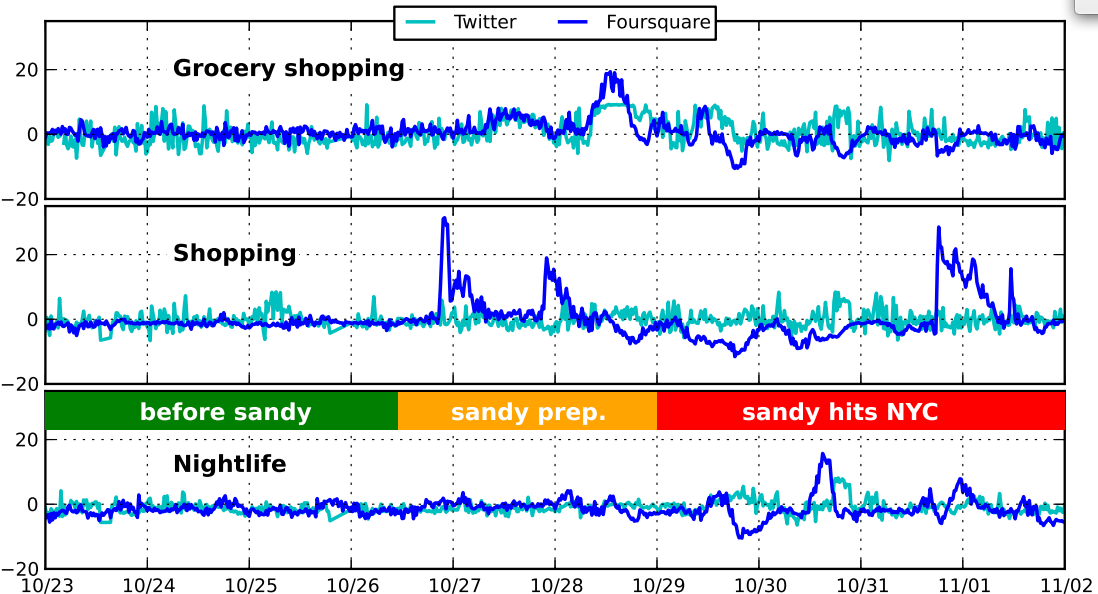
“Prior to the storm, activity is relatively normal with the exception of iMac release on 10/25. The big spikes in divergent activity in the two days right before the storm correspond with emergency preparations and the spike in nightlife activity follows the ‘celebrations’ pattern afterwards. In the category of Grocery shopping (top panel) the deviations on Foursqaure and Twitter overlap closely, while on Nightlife the Twitter activity lags after Foursquare. On October 29 and 30 shops were mostly closed in NYC and we observe fewer checkins than usual, but interestingly more tweets about shopping. This finding suggests that opposing patterns of deviations may indicate of severe distress or abnormality, with the two platforms corroborating an alert.”
In sum, “the deviations in the case study of Hurricane Sandy clearly separate normal and abnormal times. In some cases the deviations on both platforms closely overlap, while in others some time lag (or even opposite trend) is evident. Moreover, during the height of the storm Foursquare activity diminishes significantly, while Twitter activity is on the rise. These findings have immediate implications for event detection systems, both in combining multiple sources of information and in using them to improving overall accuracy.”
Now if only this applied research could be transfered to operational use via a real-time dashboard, then this could actually make a difference for emergency responders and humanitarian organizations. See my recent post on the cognitive mismatch between computing research and social good needs.


“Now if only this applied research could be transfered to operational use via a real-time dashboard” — we’re on it.
Excellent, many thanks for reading & commenting. Would be great to connect.
Pingback: Using Social Media to Predict Disaster Resilience | iRevolution