I published a blog post with the same question in 2012. The question stemmed from earlier conversations I had at 10 Downing Street with colleague Duncan Watts from Microsoft Research. We subsequently embarked on a collaboration with the Standby Task Force (SBTF), a group I co-founded back in 2010. The SBTF was one of the early pioneers of digital humanitarian action. The purpose of this collaboration was to empirically explore the relationship between team size and productivity during crisis mapping efforts.
Duncan and Team from Microsoft simulated the SBTF’s crisis mapping efforts in response to Typhoon Pablo in 2012. At the time, the United Nations Office for the Coordination of Humanitarian Affairs (UN/OCHA) had activated the Digital Humanitarian Network (DHN) to create a crisis map of disaster impact (final version pictured above). OCHA requested the map within 24 hours. While we could have deployed the SBTF using the traditional crowdsourcing approach as before, we decided to try something different: microtasking. This was admittedly a gamble on our part.
We reached out to the team at PyBossa to ask them to customize their micro-tasking platform so that we could rapidly filter through both images and videos of disaster damage posted on Twitter. Note that we had never been in touch with the PyBossa team before this (hence the gamble) nor had we ever used their CrowdCrafting platform (which was still very new at the time). But thanks to PyBossa’s quick and positive response to our call for help, we were able to launch this microtasking app several hours after OCHA’s request.
Fast forward to the present research study. We gave Duncan and colleagues at Microsoft the same database of tweets for their simulation experiment. To conduct this experiment and replicate the critical features of crisis mapping, they created their own “CrowdMapper” platform pictured below.
The CrowdMapper experiments suggest that the positive effects of coordination between digital humanitarian volunteers, i.e., teams, dominate the negative effects of social loafing, i.e., volunteers working independently from others. In social psychology, “social loafing is the phenomenon of people exerting less effort to achieve a goal when they work in a group than when they work alone” (1). In the CrowdMapper exercise, the teams performed comparably to the SBTF deployment following Typhoon Pablo. This suggests that such experiments can “help solve practical problems as well as advancing the science of collective intelligence.”
Our MicroMappers deployments have always included a live chat (IM) feature in the user interface precisely to support collaboration. Skype has also been used extensively during digital humanitarian efforts and Slack is now becoming more common as well. So while we’ve actively promoted community building and facilitated active collaboration over the past 6+ years of crisis mapping efforts, we now have empirical evidence that confirms we’re on the right track.
The full study by Duncan et al. is available here. As they note vis-a-vis areas for future research, we definitely need more studies on the division of labor in crisis mapping efforts. So I hope they or other colleagues will pursue this further.
Many thanks to the Microsoft Team and to SBTF for collaborating on this applied research, one of the few that exist in the field of crisis mapping and digital humanitarian action.
The main point I would push back on vis-a-vis Duncan et al’s study is comparing their simulated deployment with the SBTF’s real-world deployment. The reason it took the SBTF 12 hours to create the map was precisely because we didn’t take the usual crowdsourcing approach. As such, most of the 12 hours was spent on reaching out to PyBossa, customizing their microtasking app, testing said app and then finally deploying the platform. The Microsoft Team also had the dataset handed over to them while we had to use a very early, untested version of the AIDR platform to collect and filter the tweets, which created a number of hiccups. So this too took time. Finally, it should be noted that OCHA’s activation came during early evening (local time) and I for one pulled an all-nighter that night to ensure we had a map by sunrise.
The United Nations Committee of Experts on Global Geospatial Information Management (UN-GGIM) recently published their second edition of Future Trends in Geospatial Information Management. I blogged about the first edition here. Below are some of the excerpts I found interesting or noteworthy. The report itself is a 50-page document (PDF 7.1Mb).
The integration of smart technologies and efficient governance models will increase and the mantra of ‘doing more for less’ is more relevant than ever before.
There is an increasing tendency to bring together data from multiple sources: official statistics, geospatial information, satellite data, big data and crowdsourced data among them.
New data sources and new data collection technologies must be carefully applied to avoid a bias that favors countries that are wealthier and with established data infrastructures. The use of innovative tools might also favor those who have greater means to access technology, thus widening the gap between the ‘data poor’ and the ‘data rich’.
The paradigmof geospatial information is changing; no longer is it used just for mapping and visualization, but also for integrating with other data sources, data analytics, modeling and policy-making.
Our ability to create data is still, on the whole, ahead of our ability to solve complex problems by using the data. The need to address this problem will rely on the development of both Big Data technologies and techniques (that is technologies that enable the analysis of vast quantities of information within usable and practical timeframes) and artificial intelligence (AI) or machine learning technologies that will enable the data to be processed more efficiently.
In the future we may expect society to make increasing use of autonomous machines and robots, thanks to a combination of aging population, rapid technological advancement in unmanned autonomous systems and AI, and the pure volume of data being beyond a human’s ability to process it.
Developments in AI are beginning to transform the way machines interact with the world. Up to now machines have mainly carried out well-defined tasks such as robotic assembly, or data analysis using pre-defined criteria, but we are moving into an age where machine learning will allow machines to interact with their environment in more flexible and adaptive ways. This is a trend we expect to see major growth in over the next 5 to 10 years as the technologies–and understanding of the technologies–become more widely recognized.
Processes based on these principles, and the learning of geospatial concepts (locational accuracy, precision, proximity etc.), can be expected to improve the interpretation of aerial and satellite imagery, by improving the accuracy with which geospatial features can be identified.
Tools may run persistently on continuous streams of data, alerting interested parties to new discoveries and events. Another branch of AI that has long been of interest has been the expert system, in which the knowledge and experience of human experts is taught to a machine.
The principle of collecting data once only at the highest resolution needed, and generalizing ‘on the fly’ as required, can become reality. Developments of augmented and virtual reality will allow humans to interact with data in new ways.
The future of data will not be the conflation of multiple data sources into a single new dataset, rather there will be a growth in the number of datasets that are connected and provide models to be used across the world.
Efforts should be devoted to integrating involuntary sensors– mobile phones, RFID sensors and so on–which aside from their primary purpose may produce information regarding previously difficult to collect information. This leads to more real-time information being generated.
Many developing nations have leapfrogged in areas such as mobile communications, but the lack of core processing power may inhibit some from taking advantage of the opportunities afforded by these technologies.
Disaggregating data at high levels down to small area geographies. This will increase the need to evaluate and adopt alternative statistical modeling techniques to ensure that statistics can be produced at the right geographic level, whilst still maintaining the quality to allow them to be reported against.
The information generated through use of social media and the use of everyday devices will further reveal patterns and the prediction of behaviour. This is not a new trend, but as the use of social media for providing real-time information and expanded functionality increases it offers new opportunities for location based services.
There seems to have been a breakthrough from 2D to 3D information, and this is becoming more prevalent. Software already exists to process this information, and to incorporate the time information to create 4D products and services. It is recognized that a growth area over the next five to ten years will be the use of 4D information in a wide variety of industries.
The temporal element is crucial to a number of applications such as emergency service response, for simulations and analytics, and the tracking of moving objects. 4D is particularly relevant in the context of real-time information; this has been linked to virtual reality technologies.
Greater coverage, quality and resolution has been achieved by the availability of both low-cost and affordable satellite systems, and unmanned aerial vehicles (UAVs). This has increased both the speed of collection and acquisition in remote areas, but also reduced the cost barriers of entry.
UAVs can provide real-time information to decision-makers on the ground providing, for example, information for disaster manage-ment. They are an invaluable tool when additional information is needed to improve vital decision making capabilities and such use of UAVs will increase.
The licensing of data in an increasingly online world is proving to be very challenging. There is a growth in organisations adopting simple machine-readable licences, but these have not resolved the issues to data. Emerging technologies such as web services and the growth of big data solutions drawn from multiple sources will continue to create challenges for the licensing of data.
A wider issue is the training and education of a broader community of developers and users of location-enabled content. At the same time there is a need for more automated approaches to ensuring the non-geospatial professional community get the right data at the right time. Investment in formal training in the use of geospatial data and its implementation is still indispensable.
Both ‘open’ and ‘closed’ VGI data play an important and necessary part of the wider data ecosystem.
In March 2015, I was invited by the World Bank to spearhead an ambitious humanitarian aerial robotics (UAV) mission to Vanuatu following Cyclone Pam, a devastating Category 5 Cyclone. This mission was coordinated with Heliwest and X-Craft, two outstanding UAV companies who were identified through the Humanitarian UAV Network (UAViators) Roster of Pilots. You can learn more about the mission and see pictures here. Lessons learned from this mission (and many others) are available here.
The World Bank and partners were unable to immediately analyze the aerial imagery we had collected because they faced a Big Data challenge. So I suggested the Bank activate the Digital Humanitarian Network (DHN) to request digital volunteer assistance. As a result, Humanitarian OpenStreetMap (HOT) analyzed some of the orthorectified mosaics and MicroMappers focused on analyzing the oblique images (more on both here).
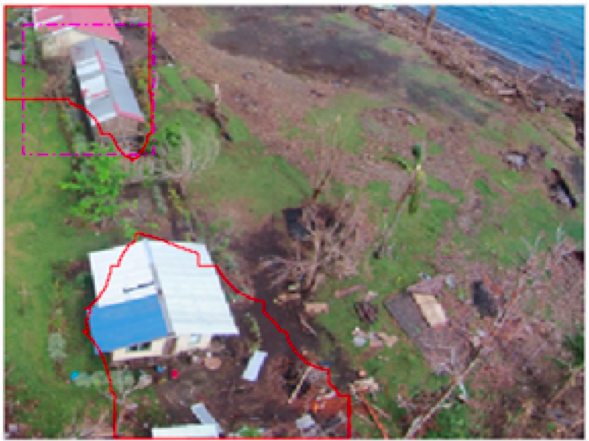
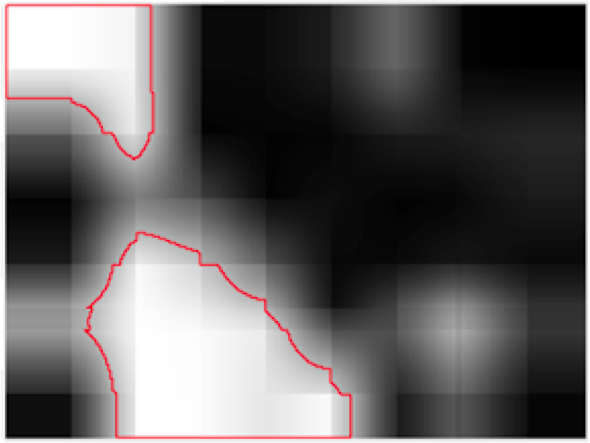
This in turn produced a number of challenges. To cite just one, the Bank needed digital humanitarians to identify which houses or buildings were completely destroyed, versus partially damaged versus largely intact. But there was little guidance on how to determine what constituted fully destroyed versus partially damaged or what such structures in Vanuatu look like when damaged by a Cyclone. As a result, data quality was not as high as it could have been. In my capacity as consultant for the World Bank’s UAVs for Resilience Program, I decided to do something about this lack of guidelines for imagery interpretation.
I turned to my colleagues at the Harvard Humanitarian Initiative (where I had previously co-founded and co-directed the HHI Program on Crisis Mapping) and invited them to develop a rigorous guide that could inform the consistent interpretation of aerial imagery of disaster damage in Vanuatu (and nearby Island States). Note that Vanuatu is number one on the World Bank’s Risk Index of most disaster-prone countries. The imagery analysis guide has just published (PDF) by the Signal Program on Human Security and Technology at HHI.
Big thanks to the HHI team for having worked on this guide and for my Bank colleagues and other reviewers for their detailed feedback on earlier drafts. The guide is another important step towards improving data quality for satellite and aerial imagery analysis in the context of damage assessments. Better data quality is also important for the use of Artificial Intelligence (AI) and computer vision as explained here. If a humanitarian UAV mission does happen in response to the recent disaster in Fiji, then the guide may also be of assistance there depending on how similar the building materials and architecture is. For now, many thanks to HHI for having produced this imagery guide.
The San people are bushmen who span multiple countries in Southern Africa. “For millennia, they have lived as hunter-gatherers in the Kalahari desert relying on an intimate knowledge of the environment.” Thus begins Sonja’s story, written with Matthew Parkan. Friend and colleague Sonja Betschart is a fellow co-founder at WeRobotics. In 2015, she teamed up on with partners in Namibia to support their wildlife conservation efforts. Sonja and team used aerial robots (UAVs) to count the number of wild animals in Kuzikus Wildlife Reserve. All the images in this blog post are credited to Drone Adventures.
If that name sounds familiar, it’s because of this digital crowdsourcing project, which I spearheaded with the same Wildlife Reserve back in 2014. The project, which was covered on CNN, used crowdsourcing to identify wild animals in very high-resolution aerial imagery. As Sonja notes, having updated counts for the number of animals in each species is instrumental to nature conservation efforts.
While the crowdsourcing project worked rather well to identify the presence of animals, distinguishing between animals is more difficult for “the crowd” even when crowdsourcing is combined with Artificial Intelligence. Local indigenous knowledge is unbeatable, or is it? They decided to put this indigenous technical knowledge to the test: find the baby rhino that had been spotted in the area earlier during the mission. Armed with the latest aerial robotics technology, Sonja and team knew full well that the robots would be stiff—even unfair—competition for the bushmen. After all, the aerial robots could travel much faster and much farther than the fastest bushman in Namibia.
Game on: Bushmen vs Robots. Ready, get set, go!
The drones weren’t even up in the air when the bushmen strolled back into camp to make themselves a cup up tea. Yes, they had already identified the location of the rhino. “This technologically humbling experience was a real eye opener,” writes Sonja, “a clear demonstration of how valuable traditional skills are despite new technologies. It was also one of the reasons why we started thinking about ways to involve the trackers in our work.”
They invited the bushmen to analyze the thousands of aerial images taken by the aerial robots to identity the various animal species visible in each image. After providing the San with a crash course on how to use a computer (to navigate between images), the bushmen “provided us with consistent interpretations of the species and sometimes even of the tracks in the high grass. However, what impressed us most was that the San pointed out subtle differences in the shadows [of the animals] that would give away the animals’ identities […].”
Take this aerial image, for example. See anything? “The San identified three different species on this image: oryx (red circles), blesbok (blue circle) and zebra (green circle).” In another image, “the bushmen were even able to give us the name of one of the Black Rhinos they spotted! For people who had never seen aerial imagery, their performance was truly remarkable.” Clearly, “with a bit of additional training, the San trackers could easily become expert image analysts.”
As Sonja rightly concluded after the mission, the project in Namibia was yet more evidence that combining indigenous knowledge with modern technology is both an elegant way of keeping this knowledge alive and an effective approach to address some of our technical and scientific limitations. As such, this is precisely the kind of project that Sonja and I want to see WeRobotics launch in 2016. It is fully in line with our mission to democratize the Fourth Industrial Revolution.
“The Namibia mission was part of SAVMAP, a joint initiative between the Laboratory of Geographic Information Systems (LASIG) of EPFL, Kuzikus Wildlife Reserve & Drone Adventures that aims at better integrating geospatial technologies with conservation and wildlife management in the Kalahari.”
Analyzing satellite and aerial imagery to assess disaster damage is fraught with challenges. This is true for both digital humanitarians and professional imagery analysts alike. Why? Because distinguishing between infrastructure that is fully destroyed and partially damaged can be particularly challenging. Professional imagery analysts with years of experience have readily admitted that trained analysts regularly interpret the same sets of images differently. Consistency in the interpretation of satellite and aerial imagery is clearly no easy task. My colleague Joel Kaiser from Medair recently suggested another approach.
Joel and I both serve on the “Core Team” of the Humanitarian UAV Network (UAViators). It is in this context that we’ve been exploring ways to render aerial imagery more actionable for rapid disaster damage assessments and tactical decision making. To overcome some of the challenges around the consistent analysis of aerial imagery, Joel suggested we take a rank-order approach. His proposal is quite simple: display two geo-tagged aerial images side by side with the following question: “Which of the two images shows more disaster damage?” Each combination of images could be shown to multiple individuals. Images that are voted as depicting more damage would “graduate” to the next display stage and in turn be compared to each other, and so on and so forth along with those images voted as showing less damage.
In short, a dedicated algorithm would intelligently select the right combination of images to display side by side. The number and type of votes could be tabulated to compute reliability and confidence scores for the rankings. Each image would have a unique damage score which could potentially be used to identify thresholds for fully destroyed versus partially damaged versus largely intact infrastructure. Much of this could be done on MicroMappers or similar microtasking solutions. Such an approach would do away with the need for detailed imagery interpretation guides. As noted above, consistent analysis is difficult even when such guides are available. The rank-order approach could help quickly identify and map the most severely affected areas to prioritize tactical response efforts. Note that this approach could be used with both crowd-sourced analysis and professional analysis. Note also that the GPS coordinates for each image would not be made publicly available for data privacy reasons.
Is this strategy worth pursuing? What are we missing? Joel and I would be keen to get some feedback. So please feel free to use the comments section below to share your thoughts or to send an email here.
Quod Erat Demonstrandum (QED) is Latin for “that which had to be proven.” This abbreviation was traditionally used at the end of mathematical proofs to signal the completion of said proofs. I joined the Qatar Computing Research Institute (QCRI) well over 3 years ago with a very specific mission and mandate: to develop and deploy next generation humanitarian technologies. So I built the Institute’s Social Innovation Program from the ground up and recruited the majority of the full-time experts (scientists, engineers, research assistants, interns & project manager) who have become integral to the Program’s success. During these 3+years, my team and I partnered directly with humanitarian and development organizations to empirically prove that methods from advanced computing can be used to make sense of Big (Crisis) Data. The time has thus come to add “QED” to the end of that proof and move on to new adventures. But first a reflection.
Over the past 3.5 years, my team and I at QCRI developed free and open source solutions powered by crowdsourcing and artificial intelligence to make sense of Tweets, text messages, pictures, videos, satellite and aerial imagery for a wide range of humanitarian and development projects. We co-developed and co-deployed these platforms (AIDR and MicroMappers) with the United Nations and the World Bank in response to major disasters such as Typhoons Haiyan and Ruby, Cyclone Pam and both the Nepal & Chile Earthquakes. In addition, we carried out peer-reviewed, scientific research on these deployments to better understand how to meet the information needs of our humanitarian partners. We also tackled the information reliability question, experimenting with crowd-sourcing (Verily) and machine learning (TweetCred) to assess the credibility of information generated during disasters. All of these initiatives were firsts in the humanitarian technology space.
We later developed AIDR-SMS to auto-classify text messages; a platform that UNICEF successfully tested in Zambia and which the World Food Program (WFP) and the International Federation of the Red Cross (IFRC) now plan to pilot. AIDR was also used to monitor a recent election, and our partners are now looking to use AIDR again for upcoming election monitoring efforts. In terms of MicroMappers, we extended the platform (considerably) in order to crowd-source the analysis of oblique aerial imagery captured via small UAVs, which was another first in the humanitarian space. We also teamed up with excellent research partners to crowdsource the analysis of aerial video footage and to develop automated feature-detection algorithms for oblique imagery analysis based on crowdsourced results derived from MicroMappers. We developed these Big Data solutions to support damage assessment efforts, food security projects and even this wildlife protection initiative.
In addition to the above accomplishments, we launched the Internet Response League (IRL) to explore the possibility of leveraging massive multiplayer online games to process Big Crisis Data. Along similar lines, we developed the first ever spam filter to make sense of Big Crisis Data. Furthermore, we got directly engaged in the field of robotics by launching the Humanitarian UAV Network (UAViators), yet another first in the humanitarian space. In the process, we created the largest repository of aerial imagery and videos of disaster damage, which is ripe for cutting-edge computer vision research. We also spearheaded the World Bank’s UAV response to Category 5 Cyclone Pam in Vanuatu and also directed a unique disaster recovery UAV mission in Nepal after the devastating earthquakes. (I took time off from QCRI to carry out both of these missions and also took holiday time to support UN relief efforts in the Philippines following Typhoon Haiyan in 2013). Lastly, on the robotics front, we championed the development of international guidelines to inform the safe, ethical & responsible use of this new technology in both humanitarian and development settings. To be sure, innovation is not just about the technology but also about crafting appropriate processes to leverage this technology. Hence also the rationale behind the Humanitarian UAV Experts Meetings that we’ve held at the United Nations Secretariat, the Rockefeller Foundation and MIT.
All of the above pioneering-and-experimental projects have resulted in extensive media coverage, which has placed QCRI squarely on the radar of international humanitarian and development groups. This media coverage has included the New York Times, Washington Post, Wall Street Journal, CNN, BBC News, UK Guardian, The Economist, Forbes and Times Magazines, New Yorker, NPR, Wired, Mashable, TechCrunch, Fast Company, Nature, New Scientist, Scientific American and more. In addition, our good work and applied research has been featured in numerous international conference presentations and keynotes. In sum, I know of no other institute for advanced computing research that has contributed this much to the international humanitarian space in terms of thought-leadership, strategic partnerships, applied research and operational expertise through real-world co-deployments during and after major disasters.
There is, of course, a lot more to be done in the humanitarian technology space. But what we have accomplished over the past 3 years clearly demonstrates that techniques from advanced computing can indeed provide part of the solution to the pressing Big Data challenge that humanitarian & development organizations face. At the same time, as I wrote in the concluding chapter of my new book, Digital Humanitarians, solving the Big Data challenge does not alas imply that international aid organizations will actually make use of the resulting filtered data or any other data for that matter—even if they ask for this data in the first place. So until humanitarian organizations truly shift towards both strategic and tactical evidence-based analysis & data-driven decision-making, this disconnect will surely continue unabated for many more years to come.
Reflecting on the past 3.5 years at QCRI, it is crystal clear to me that the number one most important lesson I (re)learned is that you can do anything if you have an outstanding, super-smart and highly dedicated team that continually goes way above and beyond the call of duty. It is one thing for me to have had the vision for AIDR, MicroMappers, IRL, UAViators, etc., but vision alone does not amount to much. Implementing said vision is what delivers results and learning. And I simply couldn’t have asked for a more talented & stellar team to translate these visions into reality over the past 3+years. You each know who you are, partners included; it has truly been a privilege and honor working with you. I can’t wait to see what you do next at/with QCRI. Thank you for trusting me; thank you for sharing my vision; thanks for your sense of humor, and thank you for your dedication and loyalty to science and social innovation.
So what’s next for me? I’ll be lining up independent consulting work with several organizations (likely including QCRI). In short, I’ll be open for business. I’m also planning to work on a new project that I’m very excited about, so stay tuned for updates; I’ll be sure to blog about this new adventure when the time is right. For now, I’m busy wrapping up my work as Director of Social Innovation at QCRI and working with the best team there is. QED.
Recent scientific research has shown that aerial imagery captured during a single 20-minute UAV flight can take more than half-a-day to analyze. We flew several dozen flights during the World Bank’s humanitarian UAV mission in response to Cyclone Pam earlier this year. The imagery we captured would’ve taken a single expert analyst a minimum 20 full-time workdays to make sense of. In other words, aerial imagery is already a Big Data problem. So my team and I are using human computing (crowdsourcing), machine computing (artificial intelligence) and computer vision to make sense of this new Big Data source.
For example, we recently teamed up with the University of Southampton and EPFL to analyze aerial imagery of the devastation caused by Cyclone Pam in Vanuatu. The purpose of this research is to generate timely answers. Aid groups want more than high-resolution aerial images of disaster-affected areas, they want answers; answers like the number and location of damaged buildings, the number and location of displaced peoples, and which roads are still useable for the delivery of aid, for example. Simply handing over the imagery is not good enough. As demonstrated in my new book, Digital Humanitarians, both aid and development organizations are already overwhelmed by the vast volume and velocity of Big Data generated during and post-disasters. Adding yet another source, Big Aerial Data, may be pointless since these organizations may simply not have the time or capacity to make sense of this new data let alone integrate the results with their other datasets.
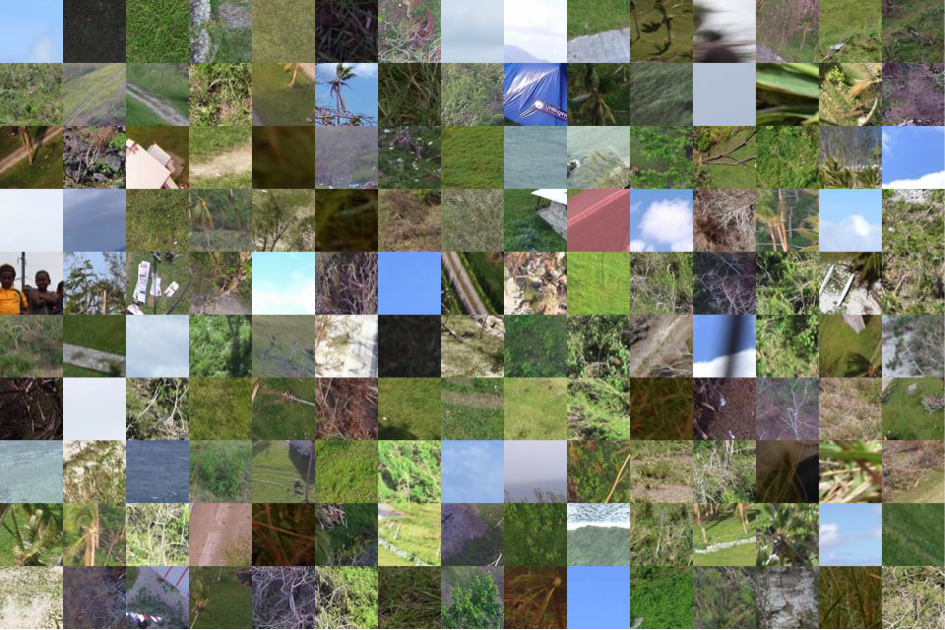
We therefore analyzed the crowdsourced results from the deployment of our MicroMappers platform following Cyclone Pam to determine whether those results could be used to train algorithms to automatically detect disaster damage in future disasters in Vanuatu. During this MicroMappers deployment, digital volunteers analyzed over 3,000 high-resolution oblique aerial images, tracing houses that were fully destroyed, partially damaged and largely intact. My colleague Ferda Ofli and I teamed up with Nicolas Rey (a graduate student from EPFL who interned with us over the summer) to explore whether these traces could be used to train our algorithms. The results below were written with Ferda and Nicolas. Our research is not just an academic exercise. Vanuatu is the most disaster-prone country in the world. What’s more, this year’s El Niño is expected to be one of the strongest in half-a-century.
According to the crowdsourced results, 1,145 of the high-resolution images did not contain any buildings. Above is a simple histogram depicting the number of buildings per image. The aerial images of Vanuatu are very heterogeneous, and vary not only in diversity of features they exhibit but also in the angle of view and the altitude at which the pictures were taken. While the vast majority of the images are oblique, some are almost nadir images, and some were taken very close to the ground or even before take off.
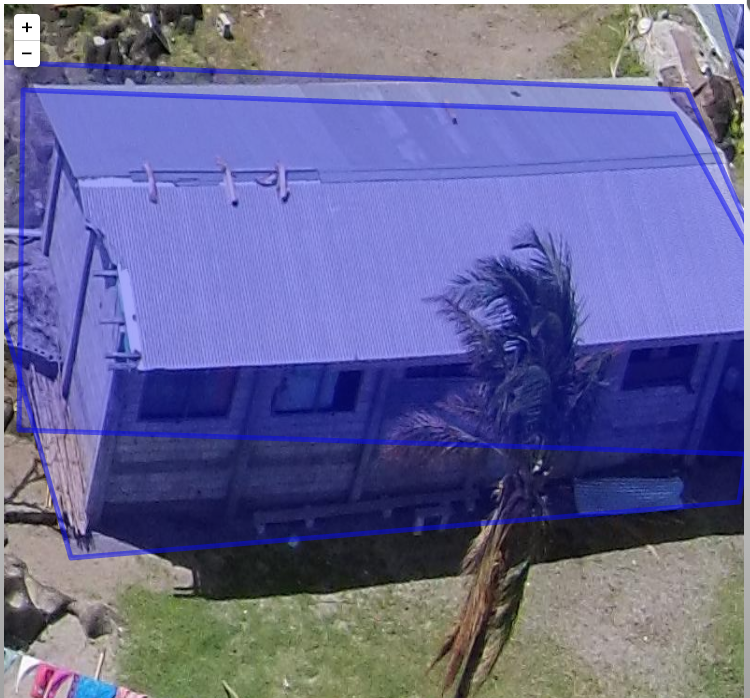
The heterogeneity of our dataset of images makes the automated analysis of this imagery a lot more difficult. Furthermore, buildings that are under construction, of which there are many in our dataset, represent a major difficulty because they look very similar to damaged buildings. Our first task thus focused on training our algorithms to determine whether or not any given aerial image shows some kind of building. This is an important task given that more than ~30% of the images in our dataset do not contain buildings. As such, if we can develop an accurate algorithm to automatically filter out these irrelevant images (like the “noise” below), this will allows us focus the crowdsourced analysis of relevant images only.
While our results are purely preliminary, we are still pleased with our findings thus far. We’ve been able to train our algorithms to determine whether or not an aerial image includes a building with just over 90% accuracy at thetile level. More specifically, our algorithms were able to recognize and filter out 60% of the images that do not contain any buildings (recall rate), and only 10% of the images that contain buildings were mistakingly discarded (precision rate of 90%). The example below is an example. There are still quite a number of major challenges, however, so we want to be sure not to over-promise anything at this stage. In terms of next steps, we would like to explore whether our computer vision algorithms can distinguish between destroyed an intact buildings.
The UAVs we were flying in Vanuatu required that we landed them in order to get access to the collected imagery. Increasingly, newer UAVs offer the option of broadcasting the aerial images and videos back to base in real time. DJI’s new Phantom 3 UAV (pictured below), for example, allows you to broadcast your live aerial video feed directly to YouTube (assuming you have connectivity). There’s absolutely no doubt that this is where the UAV industry is headed; towards real-time data collection and analysis. In terms of humanitarian applications, and search and rescue, having the data-analysis carried out in real-time is preferable.
This explains why my team and I recently teamed up with Elliot Salisbury & Sarvapali Ramchurn from the University of Southampton to crowdsource the analysis of live aerial video footage of disaster zones and to combine this crowdsourcing with (hopefully) near real-time machine learning and automated feature detection. In other words, as digital volunteers are busy tagging disaster damage in video footage, we want our algorithms to learn from these volunteers in real-time. That is, we’d like the algorithms to learn what disaster damage looks like so they can automatically identify any remaining disaster damage in a given aerial video.
So we recently carried out a MicroMappers test-deployment using aerial videos from the humanitarian UAV mission to Vanuatu. Close to 100 digital volunteers participated in this deployment. Their task? To click on any parts of the videos that show disaster damage. And whenever 80% or more of these volunteers clicked on the same areas, we would automatically highlight these areas to provide near-real time feedback to the UAV pilot and humanitarian teams.
At one point during the simulations, we had some 30 digital volunteers clicking on areal videos at the same time, resulting in an average of 12 clicks per second for more than 5 minutes. In fact, we collectively clicked on the videos a total of 49,706 times! This provided more than enough real-time data for MicroMappers to act as a human-intelligence sensor for disaster damage assessments. In terms of accuracy, we had about 87% accuracy with the collective clicks. Here’s how the simulations looked like to the UAV pilots as we were all clicking away:
Thanks to all this clicking, we can export only the most important and relevant parts of the video footage while the UAV is still flying. These snippets, such as this one and this one, can then be pushed to MicroMappers for additional verification. These animations are small and quick, and reduce a long aerial video down to just the most important footage. We’re now analyzing the areas that were tagged in order to determine whether we can use this data to train our algorithms accordingly. Again, this is far more than just an academic curiosity. If we can develop robust algorithms during the next few months, we’ll be ready to use them effectively during the next Typhoon season in the Pacific.
In closing, big thanks to my team at QCRI for translating my vision of Micro-Mappers into reality and for trusting me well over a year ago when I said we needed to extend our work to aerial imagery. All of the above research would simply not have been possible without MicroMappers existing. Big thanks as well to our excellent partners at EPFL and Southampton for sharing our vision and for their hard work on our joint projects. Last but certainly not least, sincerest thanks to digital volunteers from SBTF and beyond for participating in these digital humanitarian deployments.
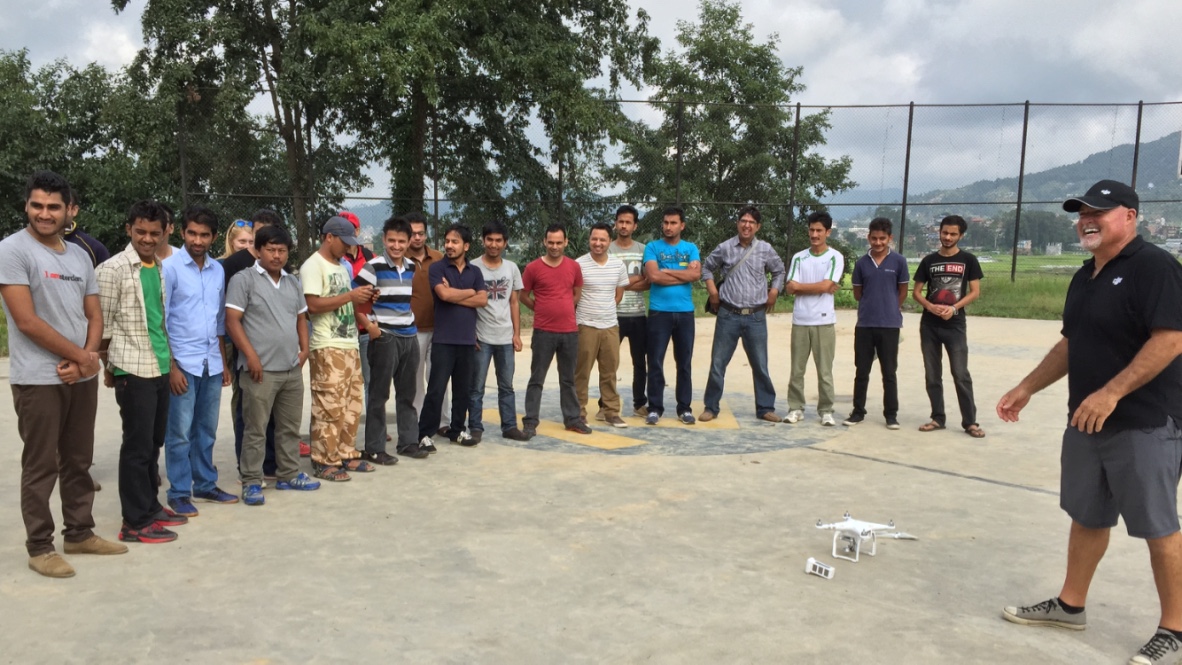
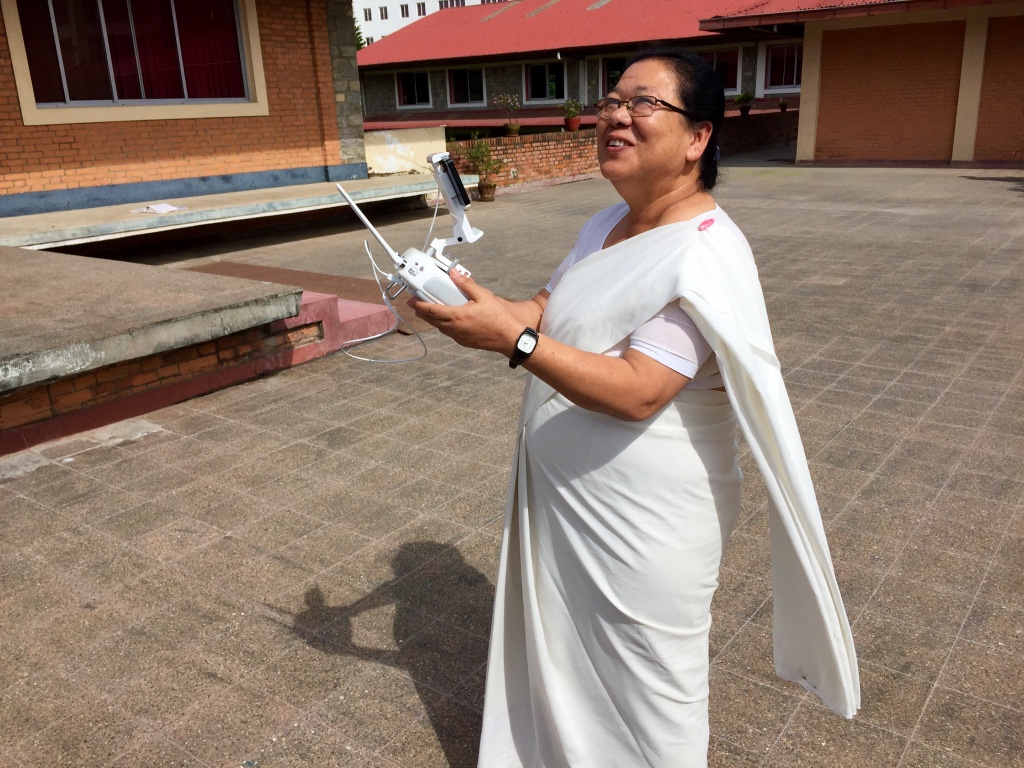
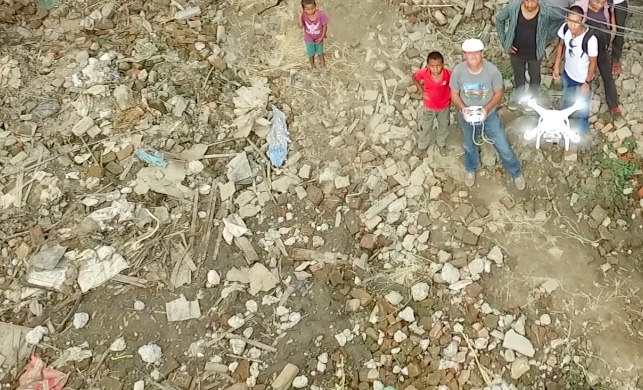
Buddhist Temples adorn Nepal’s blessed land. Their stupas, like Everest, stretch to the heavens, yearning to democratize the sky. We felt the same yearning after landing in Kathmandu with our UAVs. While some prefer the word “drone” over “UAVs”, the reason our Nepali partners use the latter dates back some 3,000 years to the spiritual epic Mahabharata (Great Story of Bharatas). The ancient story features Drona, a master of advanced military arts who slayed hundreds of thousands with his bow & arrows. This strong military connotation explains why our Nepali partners use “UAV” instead, which is the term we also used for our Humanitarian UAV Mission in the land of Buddha. Our purpose: to democratize the sky.
Unmanned Aerial Vehicles (UAVs) are aerial robots. They are the first wave of robotics to impact the humanitarian space. The mission of the Humanitarian UAV Network (UAViators) is to enable the safe, responsible and effective use of UAVs in a wide range of humanitarian and development settings. We thus spearheaded a unique and weeklong UAV Mission in Nepal in close collaboration with Kathmandu University (KU), Kathmandu Living Labs (KLL), DJI and Pix4D. This mission represents the first major milestone for Kathmandu Flying Labs (please see end of this post for background on KFL).
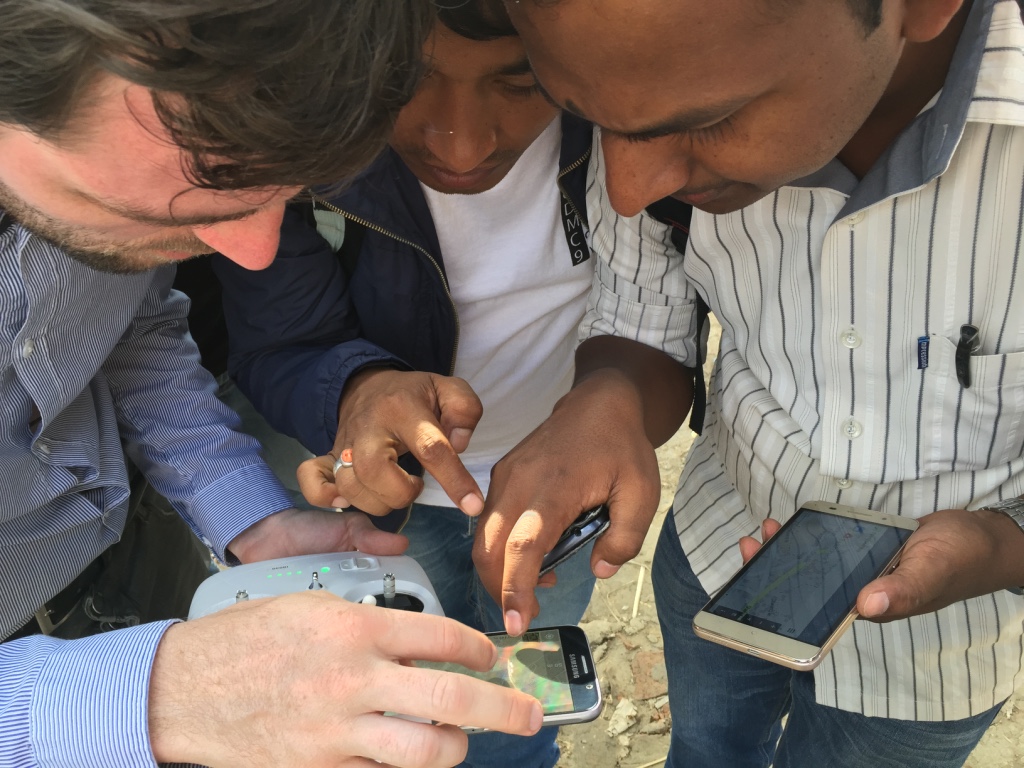
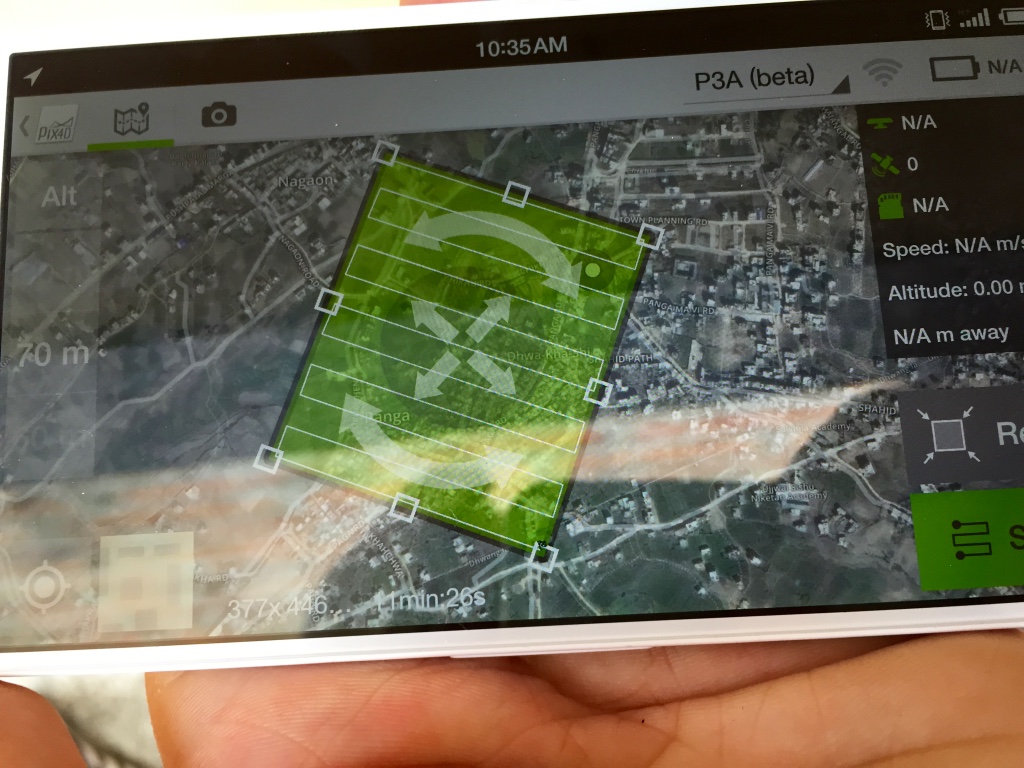
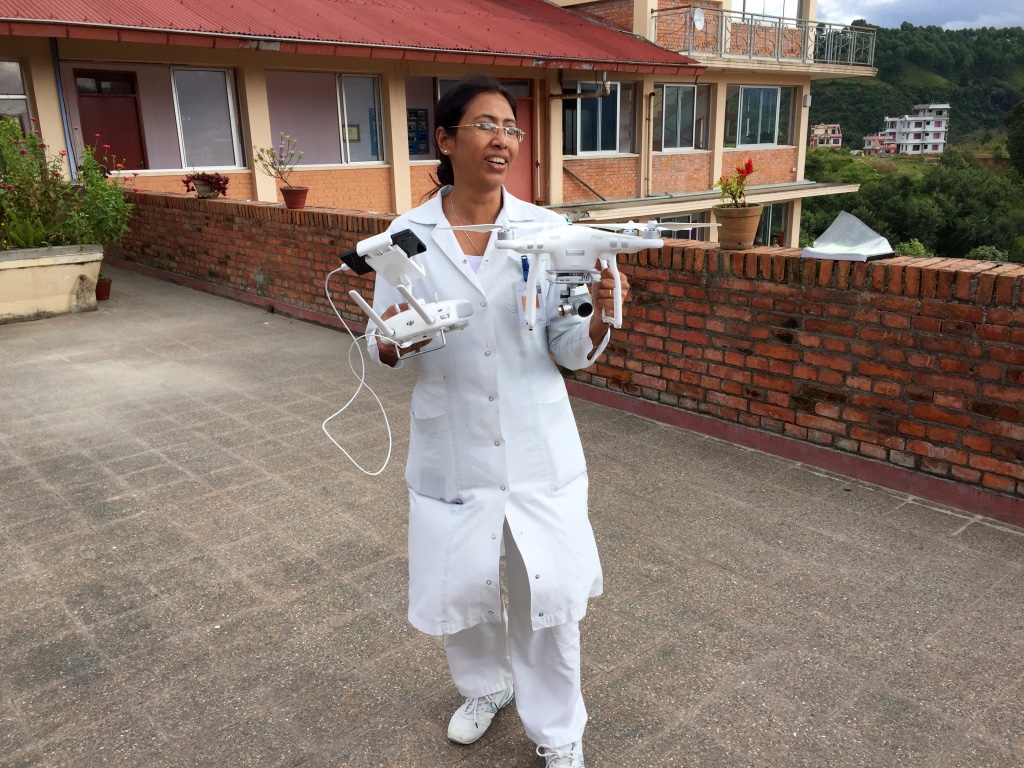
Our joint UAV mission combined both hands-on training and operational deployments. The full program is available here. The first day comprised a series of presentations on Humanitarian UAV Applications, Missions, Best Practices, Guidelines, Technologies, Software and Regulations. These talks were given by myself, KU, DJI, KLL and the Civil Aviation Authority (CAA) of Nepal. The second day focused on direct hands-on training. DJI took the lead by training 30+ participants on how to use the Phantom 3 UAVs safely, responsibly. Pix4D, also on site, followed up by introducing their imagery-analysis software.
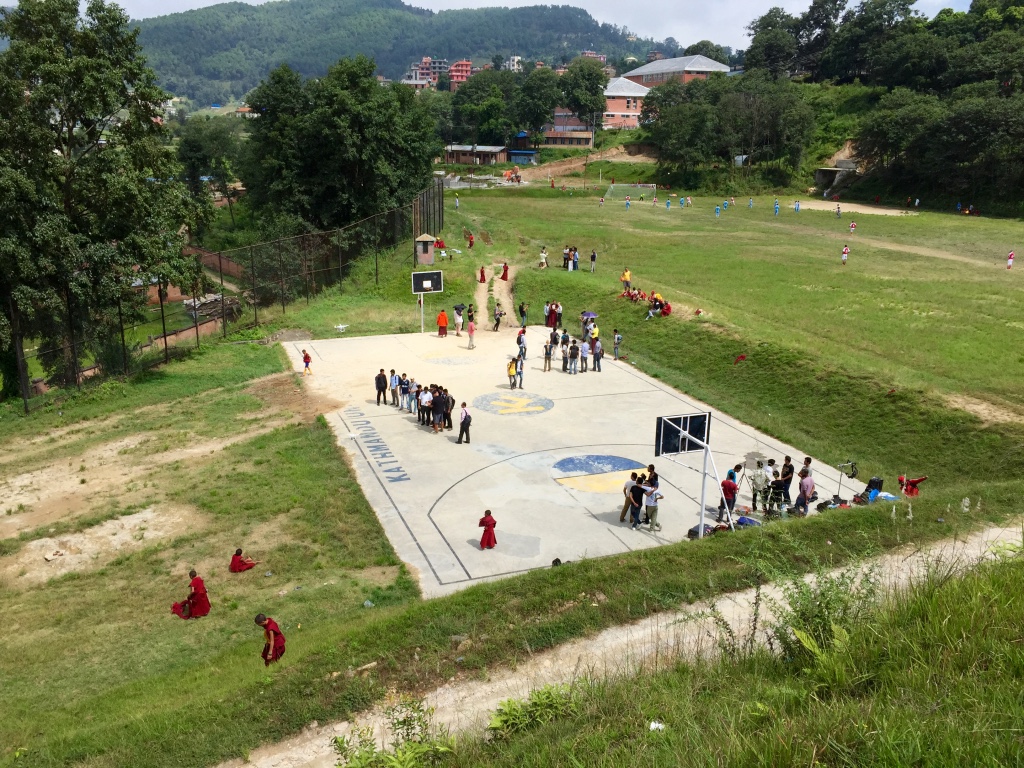
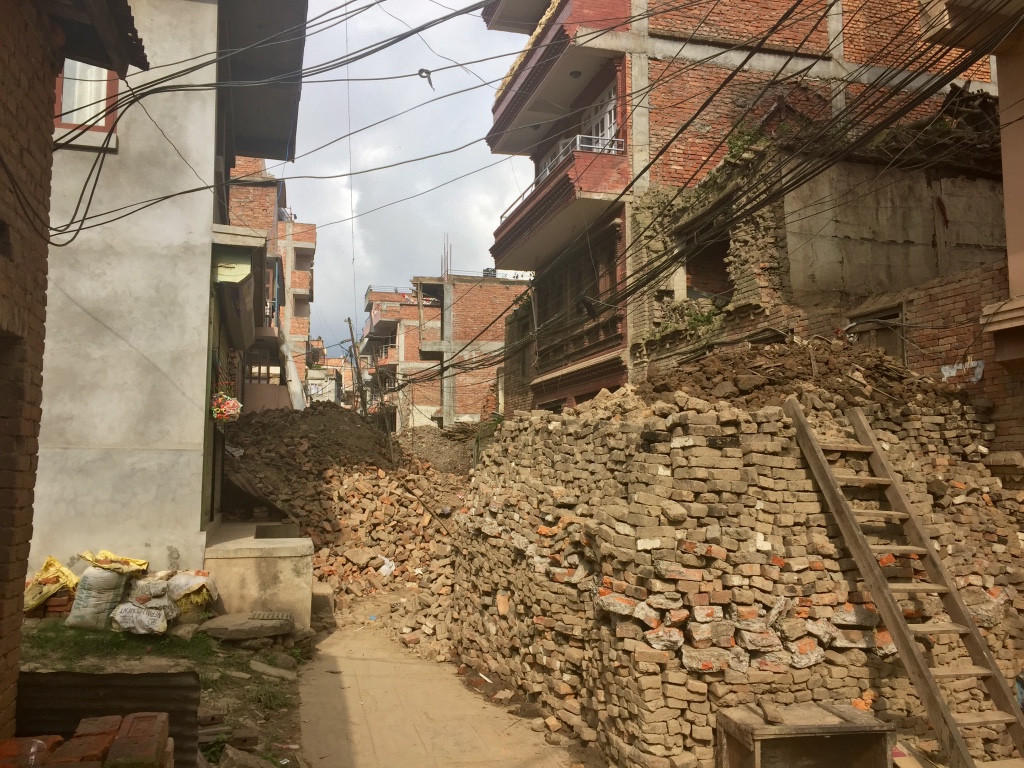
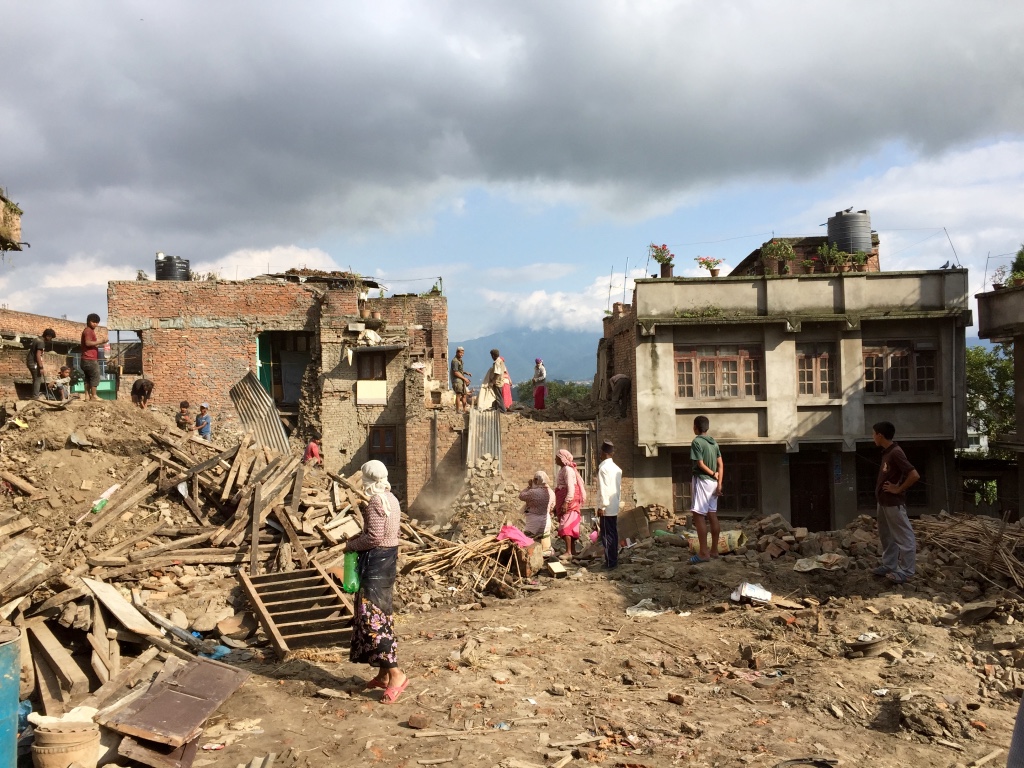
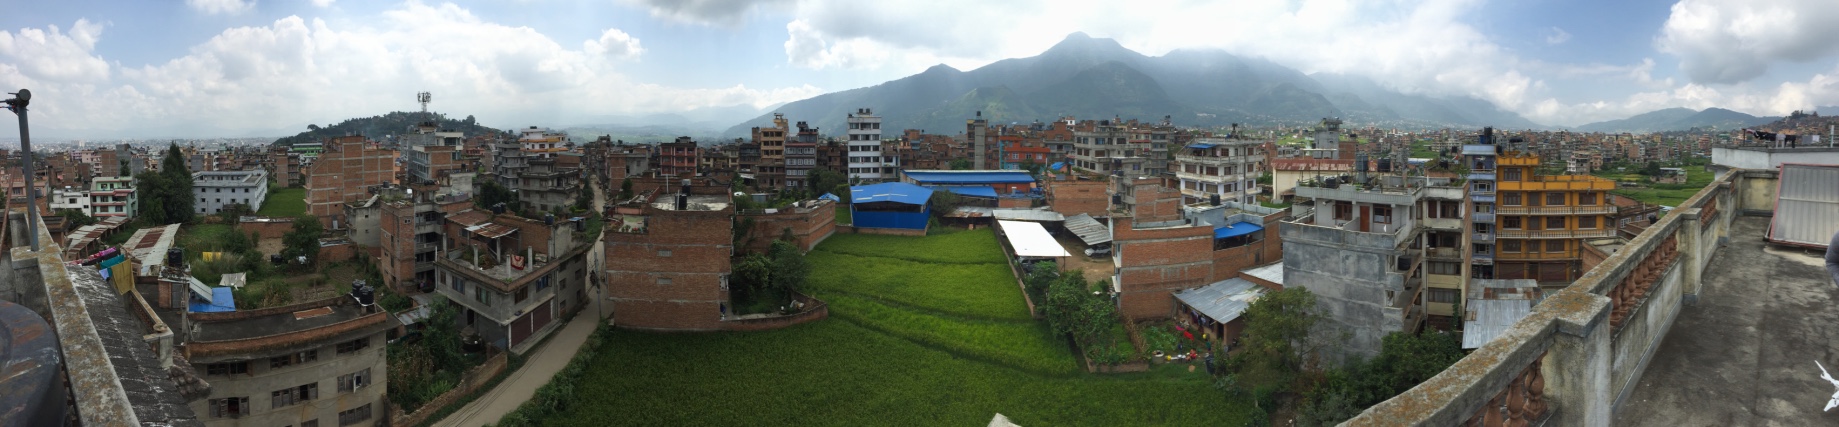
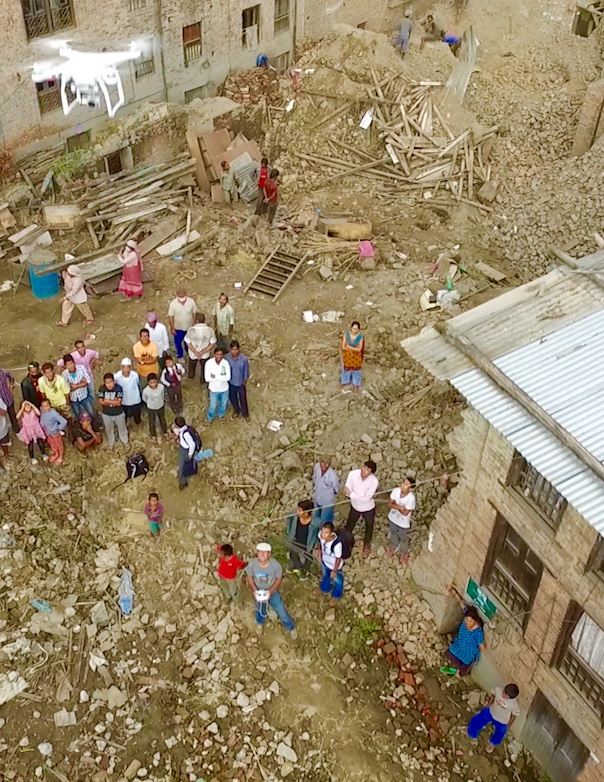
The second-half of the day was dedicated to operations. We had already received written permission from the CAA to carry out all UAV flights thanks to KU’s outstanding leadership. KU also selected the deployment sites and enabled us to team up with the very pro-active Community Disaster Management Committee (CDMC-9) of Kirtipur to survey the town of Panga, which had been severely affected by the earthquake just months earlier. The CDMC was particularly keen to gain access to very high-resolution aerial imagery of the area to build back faster and better, so we spent half-a-day flying half-a-dozen Phantom 3’s over parts of Panga as requested by our local partners.
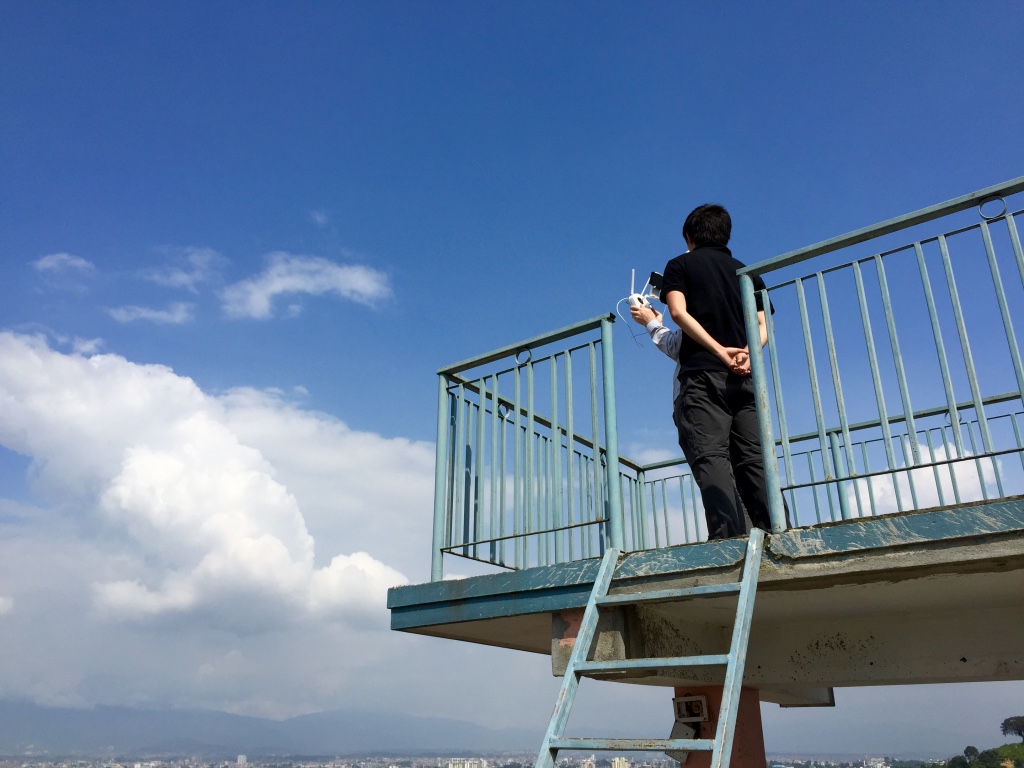
The best part of this operation came at the end of the day when we had finished the mission and were packing up: Our Nepali partners politely noted that we had not in fact finished the job; we still had a lot more area to cover. They wanted us back in Panga the following day to complete our mapping mission. We thus changed our plans and returned the next day during which—thanks to DJI & Pix4D—we flew several dozen additional UAV flights from four different locations across Panga (without taking a single break; no lunch was had). Our local partners were of course absolutely invaluable throughout since they were the ones informing the flight plans. They also made it possible for us to launch and land all our flights from the highest rooftops across town. (Click images to enlarge).
Meanwhile, back at KU, our Pix4D partners provided hands-on training on how to use their software to analyze the aerial imagery we had collected the day before. KLL also provided training on how to use the Humanitarian Open Street Map Tasking Manager to trace this aerial imagery. Incidentally, we flew well over 60 UAV flights all in all over the course of our UAV mission, which includes all our training flights on campus as well as our aerial survey of a teaching hospital. Not a single incident or accident occurred; everyone followed safety guidelines and the technology worked flawlessly.
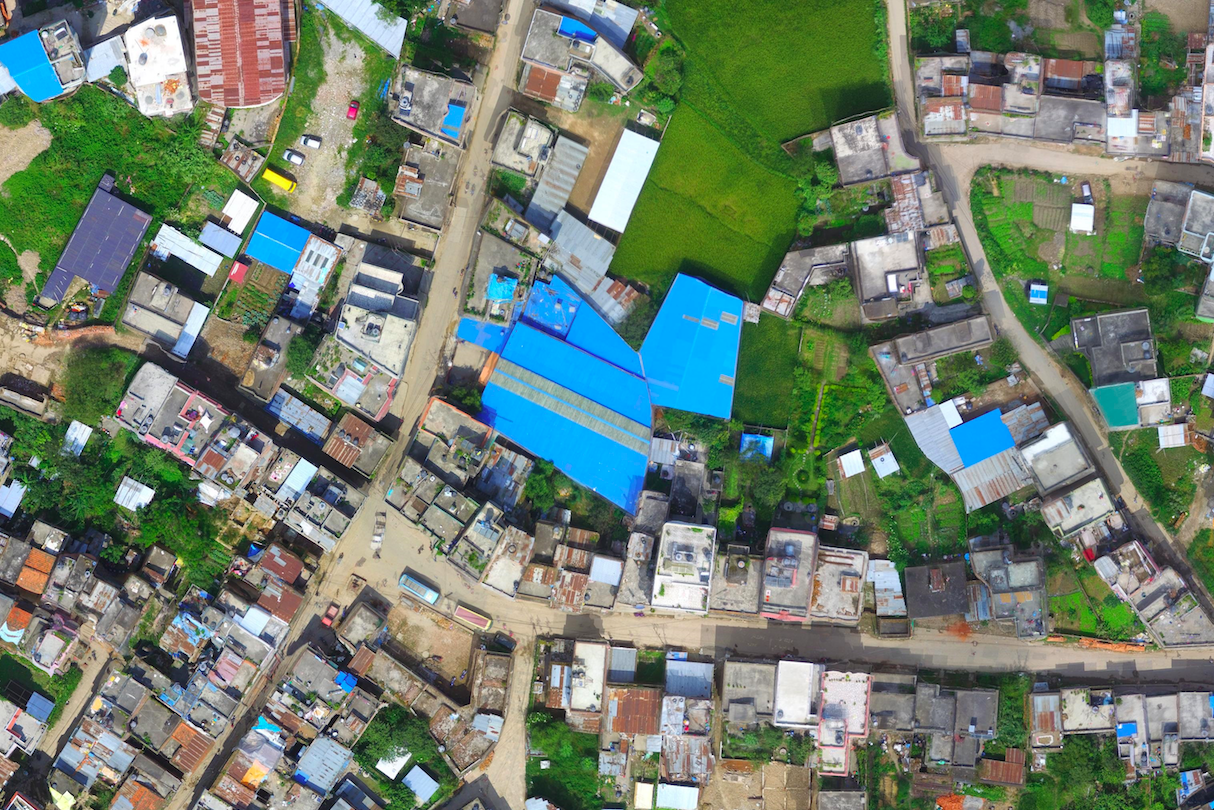
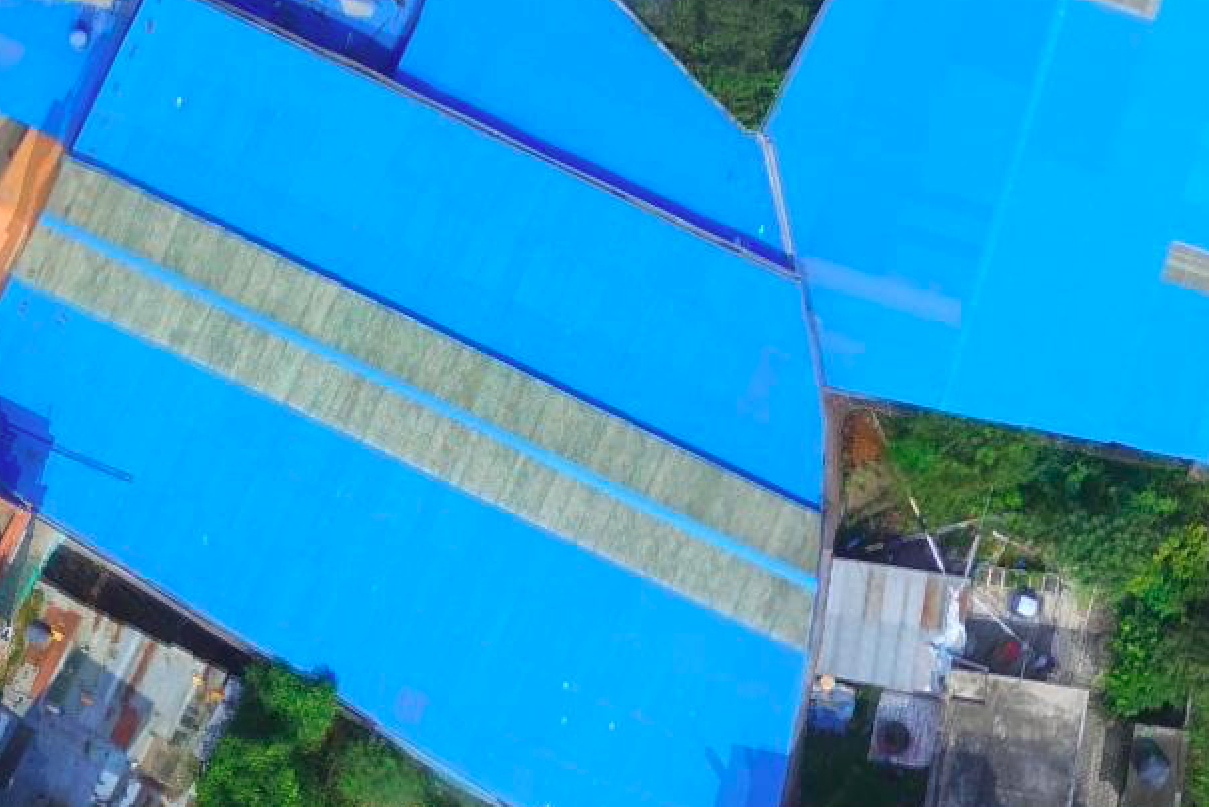
With more than 800 aerial photographs in hand, the Pix4D team worked through the night to produce a very high-resolution orthorectified mosaic of Panga. Here are some of the results.
Compare these results with the resolution and colors of the satellite imagery for the same area (maximum zoom).
We can now use MicroMappers to crowdsource the analysis & digital annotation of oblique aerial pictures and videos collected throughout the mission. This is an important step in the development of automated feature-detection algorithms using techniques from computer vision and machine learning. The reason we want automated solutions is because aerial imagery already presents a Big Data challenge for humanitarian and development organizations. Indeed, a single 20- minute UAV flight can generate some 800 images. A trained analyst needs at least one minute to analyze a single image, which means that more than 13 hours of human time is needed to analyze imagery captured from just one 20-minute UAV flight. More on this Big Data challenge here.
Incidentally, since Pix4D also used their software to produce a number of stunning 3D models, I’m keen to explore ways to crowdsource 3D models via MicroMappers and to explore possible Virtual Reality solutions to the Big Data challenge. In any event, we generated all the aerial data requested by our local partners by the end of the day.
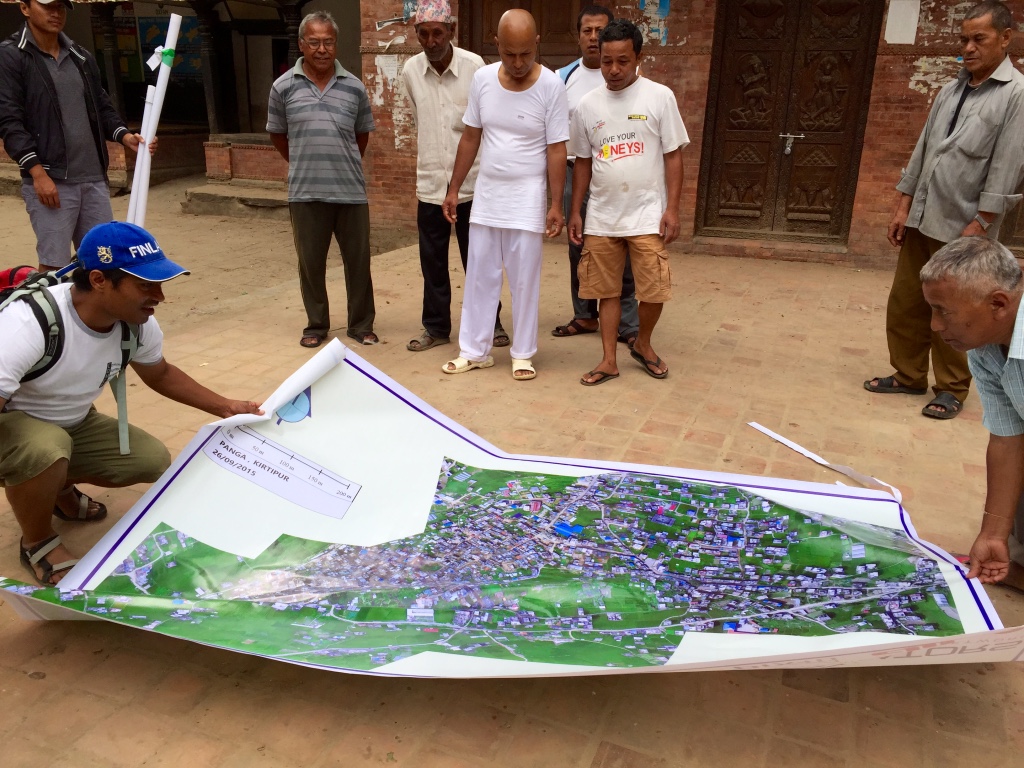
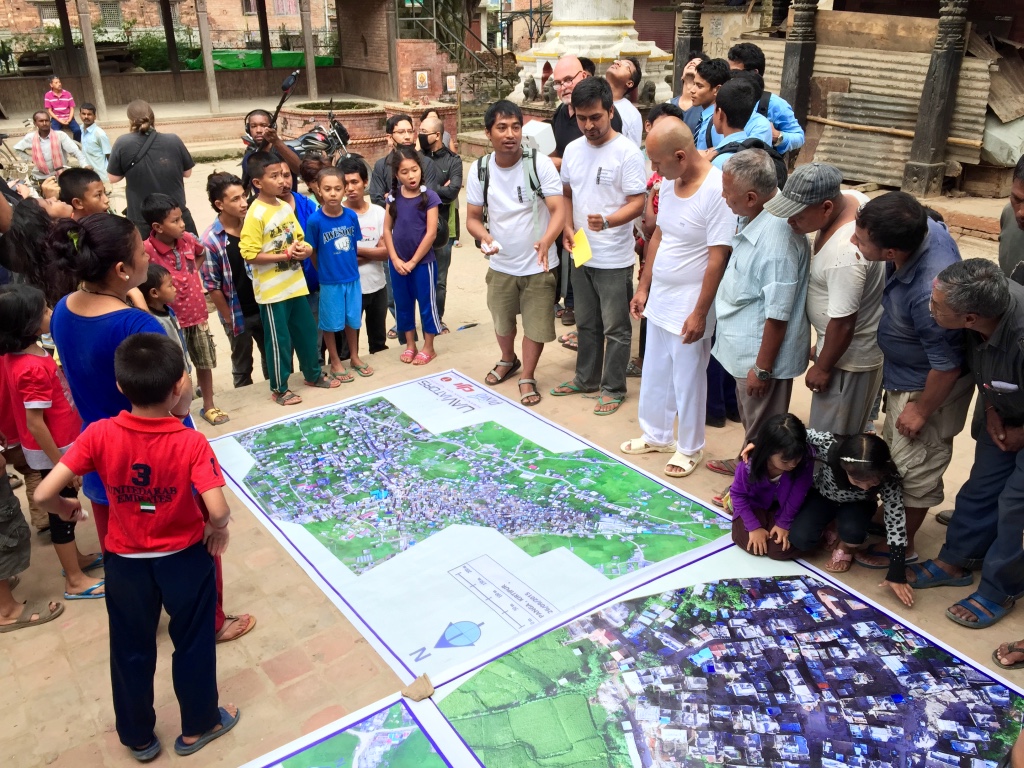
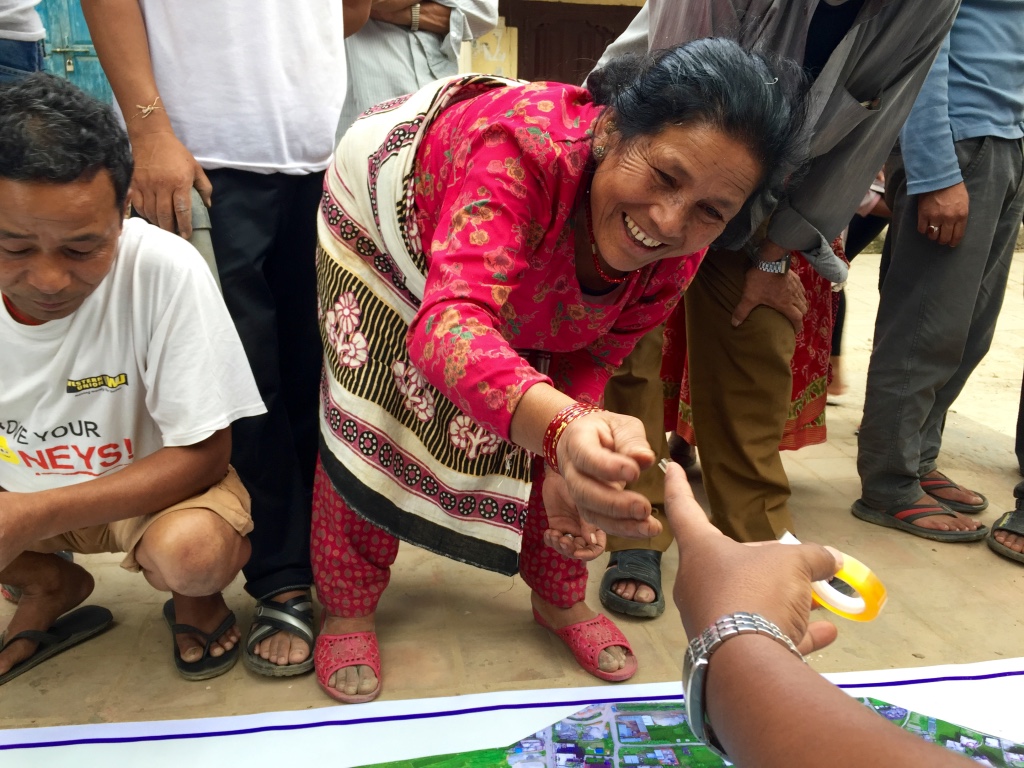
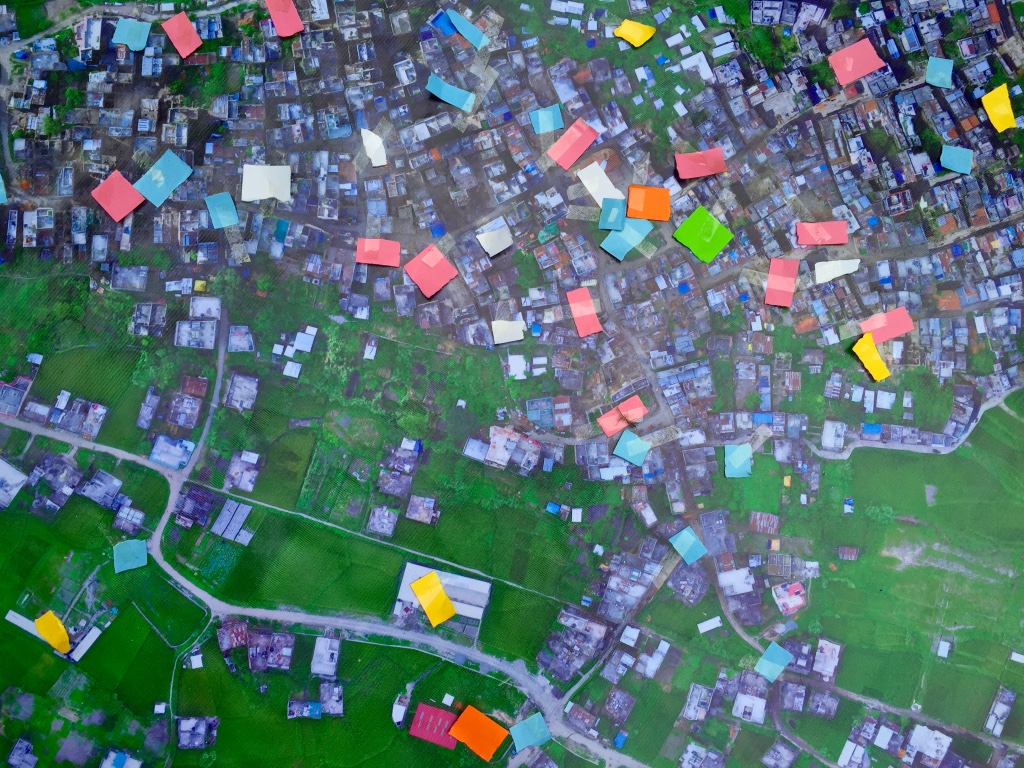
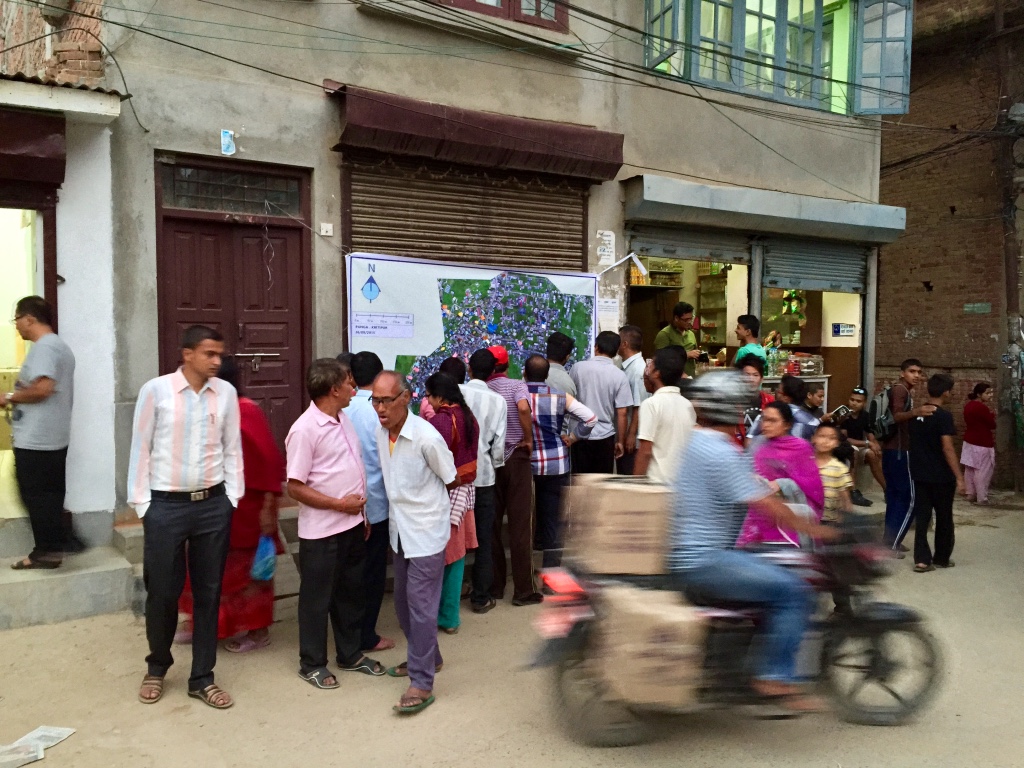
While this technically meant that we had successfully completed our mission, it didn’t feel finished to me. I really wanted to “liberate” the data completely and place it directly into the hands of the CDCM and local community in Panga. What’s the point of “open data” if most of Panga’s residents are not able to view or interact with the resulting maps? So I canceled my return flight and stayed an extra day to print out our aerial maps on very large roll-able and waterproof banners (which are more durable than paper-based maps).
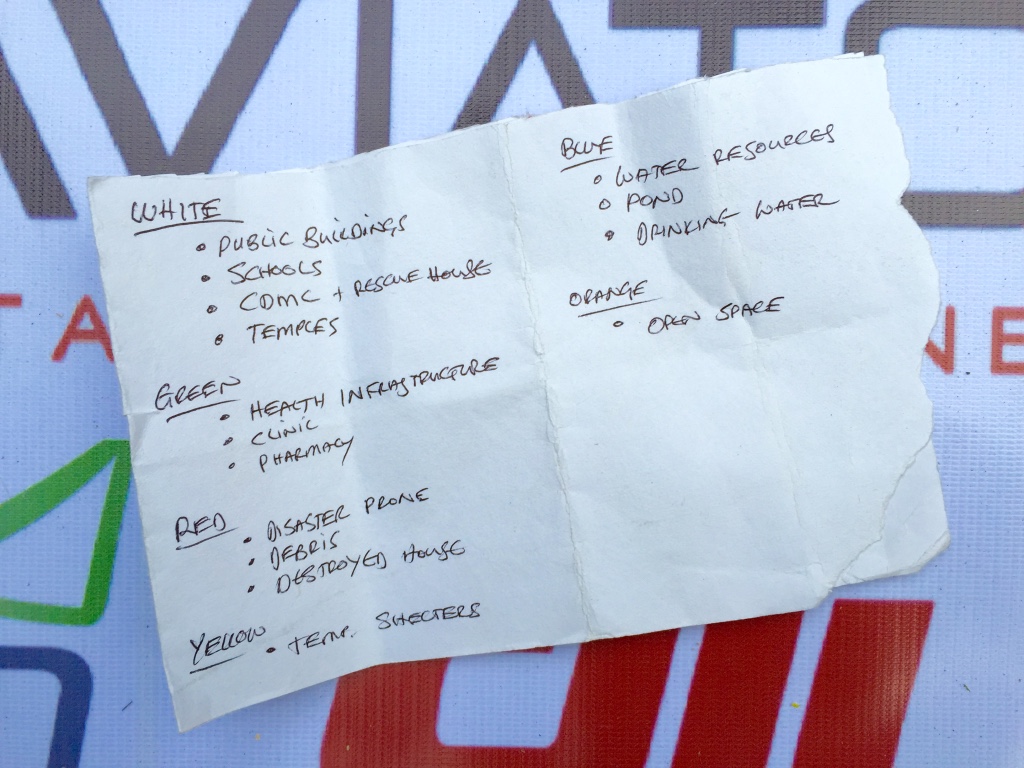
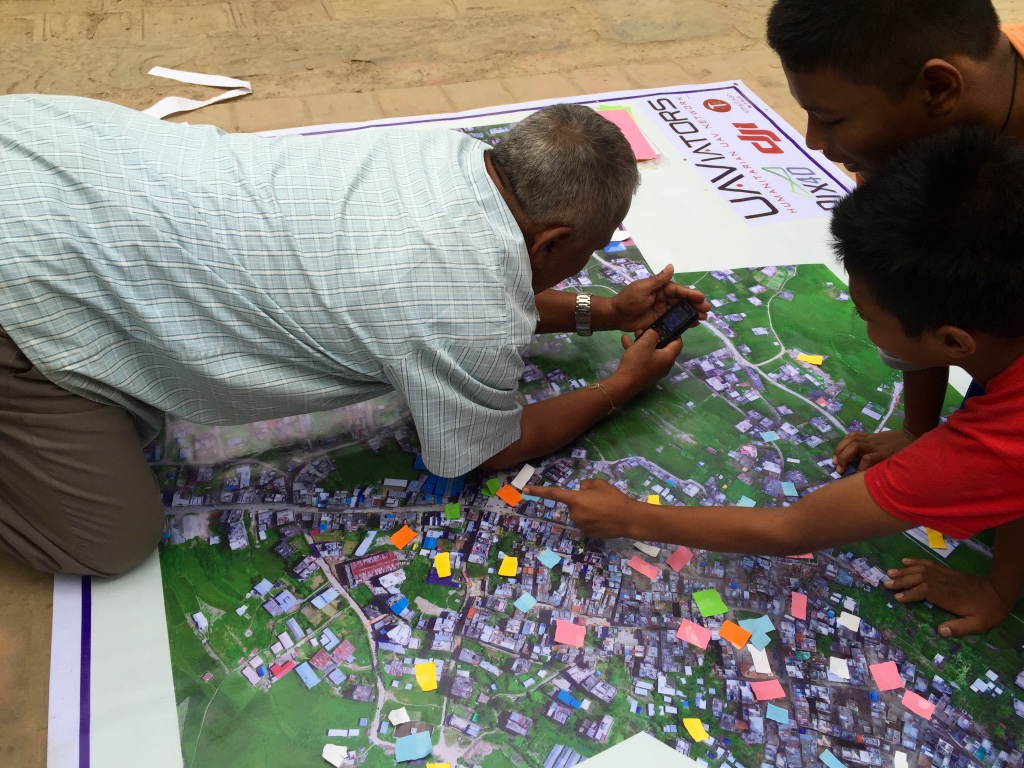
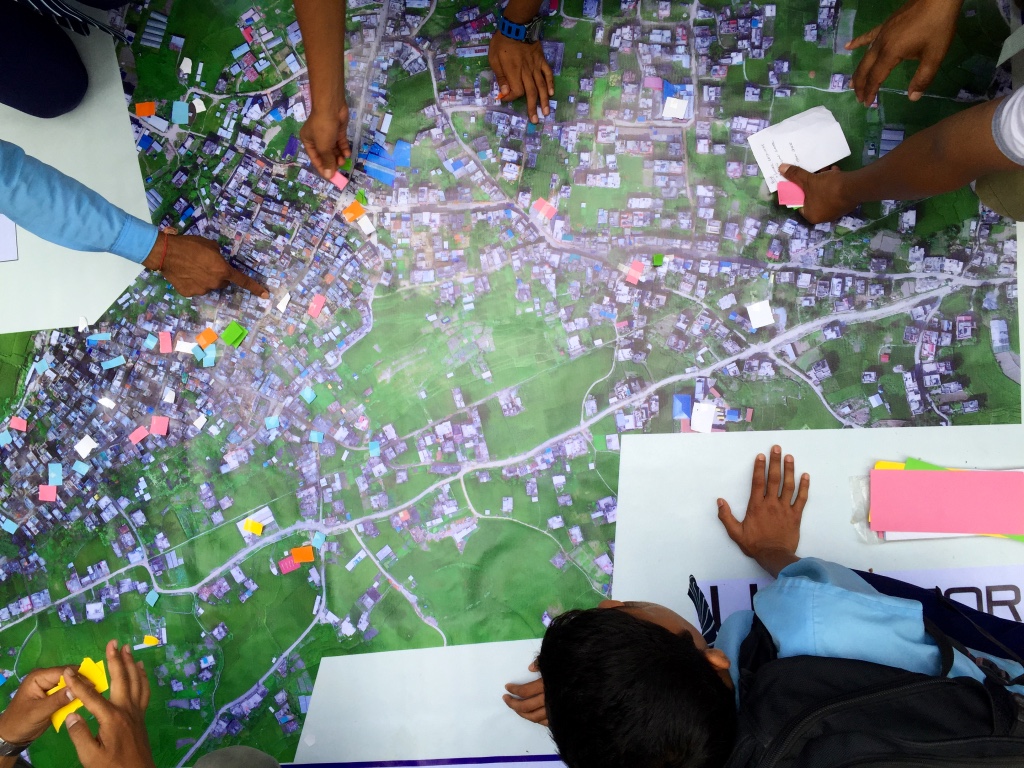
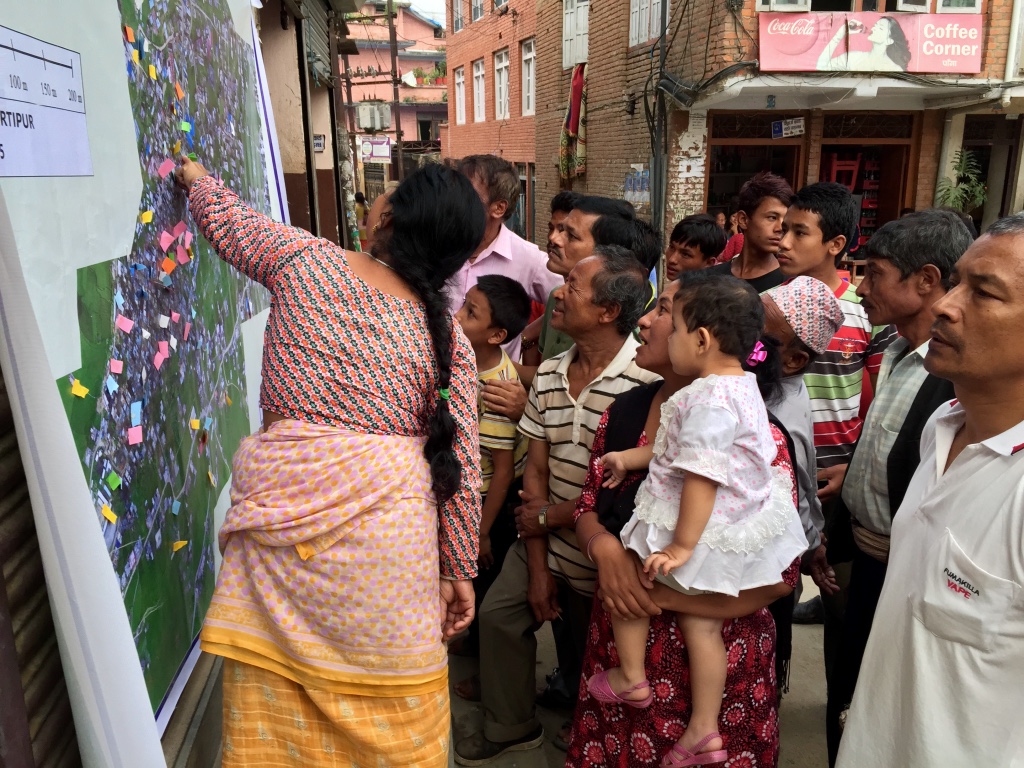
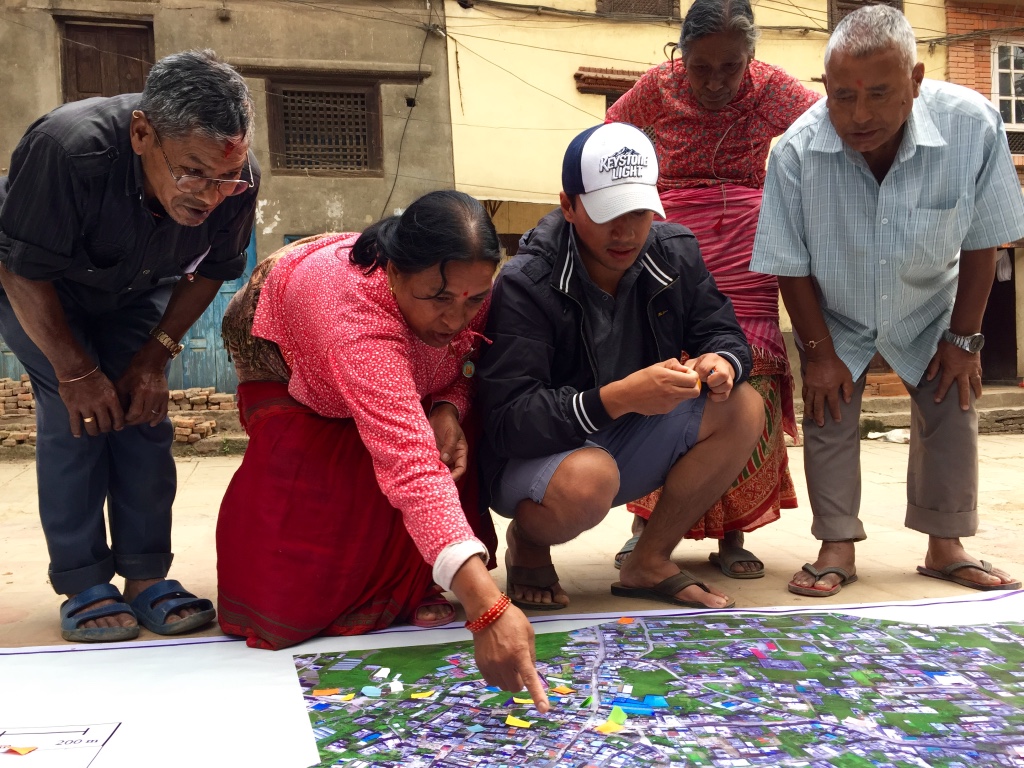
We thus used these banner-maps and participatory mapping methods to engage the local community directly. We invited community members to annotate the very-high resolution aerial maps themselves by using tape and color-coded paper we had brought along. In other words, we used the aerial imagery as a base map to catalyze a community-wide discussion; to crowdsource and to visualize the community’s local knowledge. Participatory mapping and GIS (PPGIS) can play an impactful role in humanitarian and development projects, hence the initiative with our local partners (more here on community mapping).
In short, our humanitarian mission combined aerial robotics, computer vision, waterproof banners, tape, paper and crowdsourcing to inform the rebuilding process at the community level.
The engagement from the community was absolutely phenomenal and definitely for me the highlight of the mission. Our CDMC partners were equally thrilled and excited with the community engagement that the maps elicited. There were smiles all around. When we left Panga some four hours later, dozens of community members were still discussing the map, which our partners had hung up near a popular local teashop.
There’s so much more to share from this UAV mission; so many angles, side-stories and insights. The above is really just a brief and incomplete teaser. So stay tuned, there’s a lot more coming up from DJI and Pix4D. Also, the outstanding film crew that DJI invited along is already reviewing the vast volume of footage captured during the week. We’re excited to see the professionally edited video in coming weeks, not to mention the professional photographs that both DJI and Pix4D took throughout the mission. We’re especially keen to see what our trainees at KU and KLL do next with the technology and software that are now in their hands. Indeed, the entire point of our mission was to help build local capacity for UAV missions in Nepal by transferring knowledge, skills and technology. It is now their turn to democratize the skies of Nepal.
Acknowledgements: Some serious acknowledgements are in order. First, huge thanks to Lecturer Uma Shankar Panday from KU for co-sponsoring this mission, for hosting us and for making our joint efforts a resounding success. The warm welcome and kind hospitality we received from him, KU’s faculty and executive leadership was truly very touching. Second, special thanks to the CAA of Nepal for participating in our training and for giving us permission to fly. Third, big, big thanks to the entire DJI and Pix4D Teams for joining this UAViators mission and for all their very, very hard work throughout the week. Many thanks also to DJI for kindly donating 10 Smartisan phones and 10 Phantom 3’s to KU and KLL; and kind thanks to Pix4D for generously donating licenses of their software to both KU and KLL. Fourth, many thanks to KLL for contributing to the training and for sharing our vision behind Kathmandu Flying Labs. Fifth, I’d like to express my sincere gratitude to Smartisan for co-sponsoring this mission. Sixth, deepest thanks to CDMC and Dhulikhel Hospital for partnering with us on the ops side of the mission. Their commitment and life-saving work are truly inspiring. Seventh, special thanks to the film and photography crew for being so engaged throughout the mission; they were absolutely part of the team. In closing, I want to specifically thank my colleagues Andrew Schroeder from UAViators and Paul & William from DJI for all the heavy lifting they did to make this entire mission possible. On a final and personal note, I’ve made new friends for life as a result of this UAV mission, and for that I am infinitely grateful.
Kathmandu Flying Labs: My colleague Dr. Nama Budhathoki and I began discussing the potential role that small UAVs could play in his country in early 2014, well over a year-and-half before Nepal’s tragic earthquakes. Nama is the Director of Kathmandu Living Labs, a crack team of Digital Humanitarians whose hard work has been featured in The New York Times and the BBC. Nama and team create open-data maps for disaster risk reduction and response. They use Humanitarian OpenStreetMap’s Tasking Server to trace buildings and roads visible from orbiting satellites in order to produce these invaluable maps. Their primary source of satellite imagery for this is Bing. Alas, said imagery is both low-resolution and out-of-date. And they’re not sure they’ll have free access to said imagery indefinitely either.
So Nama and I decided to launch a UAV Innovation Lab in Nepal, which I’ve been referring to as Kathmandu Flying Labs. A year-and-a-half later, the tragic earthquake struck. So I reached out to DJI in my capacity as founder of the Humanitarian UAV Network (UAViators). The mission of UAViators is to enable the safe, responsible and effective use of UAVs in a wide range of humanitarian and development settings. DJI, who are on the Advisory Board of UAViators, had deployed a UAV team in response to the 6.1 earthquake in China the year before. Alas, they weren’t able to deploy to Nepal. But they very kindly donated two Phantom 2’s to KLL.
A few months later, my colleague Andrew Schroeder from UAViators and Direct Relief reconnected with DJI to explore the possibility of a post-disaster UAV Mission focused on recovery and rebuilding. Both DJI and Pix4D were game to make this mission happen, so I reached out to KLL and KU to discuss logistics. Professor Uma at KU worked tirelessly to set everything up. The rest, as they say, is history. There is of course a lot more to be done, which is why Nama, Uma and I are already planning the next important milestones for Kathmandu Flying Labs. Do please get in touch if you’d like to be involved and contribute to this truly unique initiative. We’re also exploring payload delivery options via UAVs and gearing up for new humanitarian UAV missions in other parts of the planet.
To say that Indonesia’s capital is prone to flooding would be an understatement. Well over 40% of Jakarta is at or below sea level. Add to this a rapidly growing population of over 10 million and you have a recipe for recurring disasters. Increasing the resilience of the city’s residents to flooding is thus imperative. Resilience is the capacity of affected individuals to self-organize effectively, which requires timely decision-making based on accurate, actionable and real-time information. But Jakarta is also flooded with information during disasters. Indeed, the Indonesian capital is the world’s most active Twitter city.
So even if relevant, actionable information on rising flood levels could somehow be gleaned from millions of tweets in real-time, these reports could be inaccurate or completely false. Besides, only 3% of tweets on average are geo-located, which means any reliable evidence of flooding reported via Twitter is typically not actionable—that is, unless local residents and responders know where waters are rising, they can’t take tactical action in a timely manner. These major challenges explain why most discount the value of social media for disaster response.
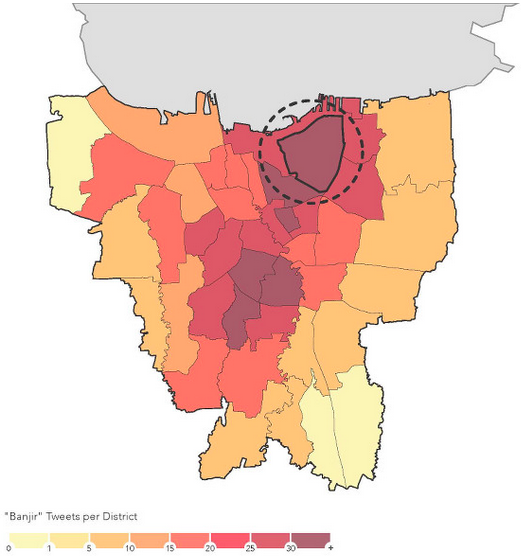
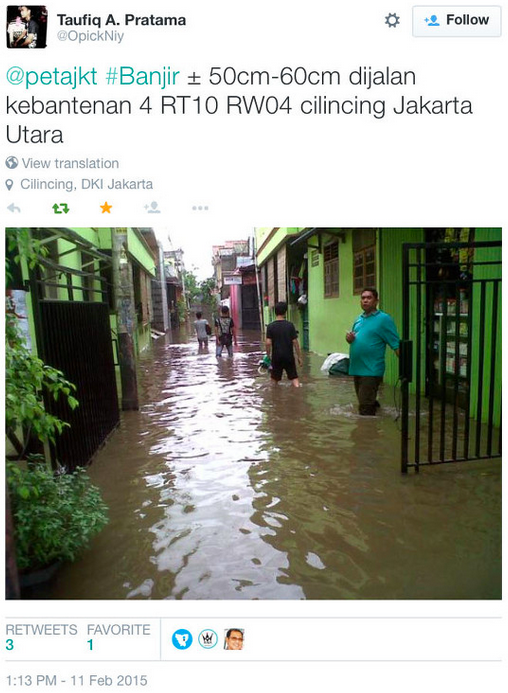
But Digital Humanitarians in Jakarta aren’t your average Digital Humanitarians. These Digital Jedis recently launched one of the most promising humanitarian technology initiatives I’ve seen in years. Code named Peta Jakarta, the project takes social media and digital humanitarian action to the next level. Whenever someone posts a tweet with the word banjir (flood), they receive an automated tweet reply from @PetaJkt inviting them to confirm whether they see signs of flooding in their area: “Flooding? Enable geo-location, tweet @petajkt #banjir and check petajakarta.org.” The user can confirm their report by turning geo-location on and simply replying with the keyword banjir or flood. The result gets added to a live, public crisis map, like the one below.
Over the course of the 2014/2015 monsoon season, Peta Jakarta automatically sent 89,000 tweets to citizens in Jakarta as a call to action to confirm flood conditions. These automated invitation tweets served to inform the user about the project and linked to the video below (via Twitter Cards) to provide simple instructions on how to submit a confirmed report with approximate flood levels. If a Twitter user forgets to turn on the geo-location feature of their smartphone, they receive an automated tweet reminding them to enable geo-location and resubmit their tweet. Finally, the platform “generates a thank you message confirming the receipt of the user’s report and directing them to PetaJakarta.org to see their contribution to the map.” Note that the “overall aim of sending programmatic messages is not to simply solicit a high volume of replies, but to reach active, committed citizen-users willing to participate in civic co-management by sharing nontrivial data that can benefit other users and government agencies in decision-making during disaster scenarios.”
A report is considered verified when a confirmed geo-tagged tweet includes a picture of the flooding, like in the tweet below. These confirmed and verified tweets get automatically mapped and also shared with Jakarta’s Emergency Management Agency (BPBD DKI Jakarta). The latter are directly involved in this initiative since they’re “regularly faced with the difficult challenge of anticipating & responding to floods hazards and related extreme weather events in Jakarta.” This direct partnership also serves to limit the “Data Rot Syndrome” where data is gathered but not utilized. Note that Peta Jakarta is able to carry out additional verification measures by manually assessing the validity of tweets and pictures by cross-checking other Twitter reports from the same district and also by monitoring “television and internet news sites, to follow coverage of flooded areas and cross-check reports.”
During the latest monsoon season, Peta Jakarta “received and mapped 1,119 confirmed reports of flooding. These reports were formed by 877 users, indicating an average tweet to user ratio of 1.27 tweets per user. A further 2,091 confirmed reports were received without the required geolocation metadata to be mapped, highlighting the value of the programmatic geo-location ‘reminders’ […]. With regard to unconfirmed reports, Peta Jakarta recorded and mapped a total of 25,584 over the course of the monsoon.”
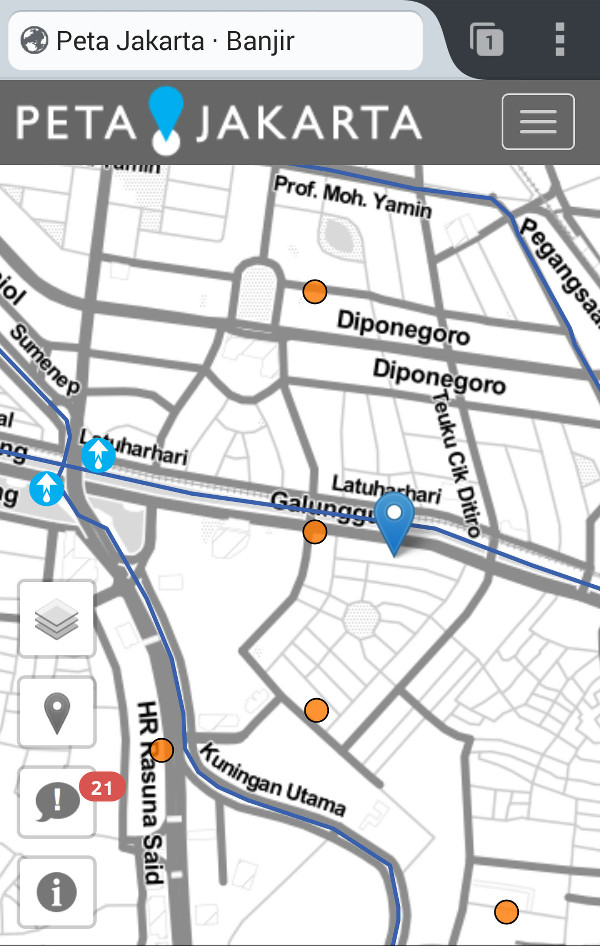
The Live Crisis Maps could be viewed via two different interfaces depending on the end user. For local residents, the maps could be accessed via smartphone with the visual display designed specifically for more tactical decision-making, showing flood reports at the neighborhood level and only for the past hour.
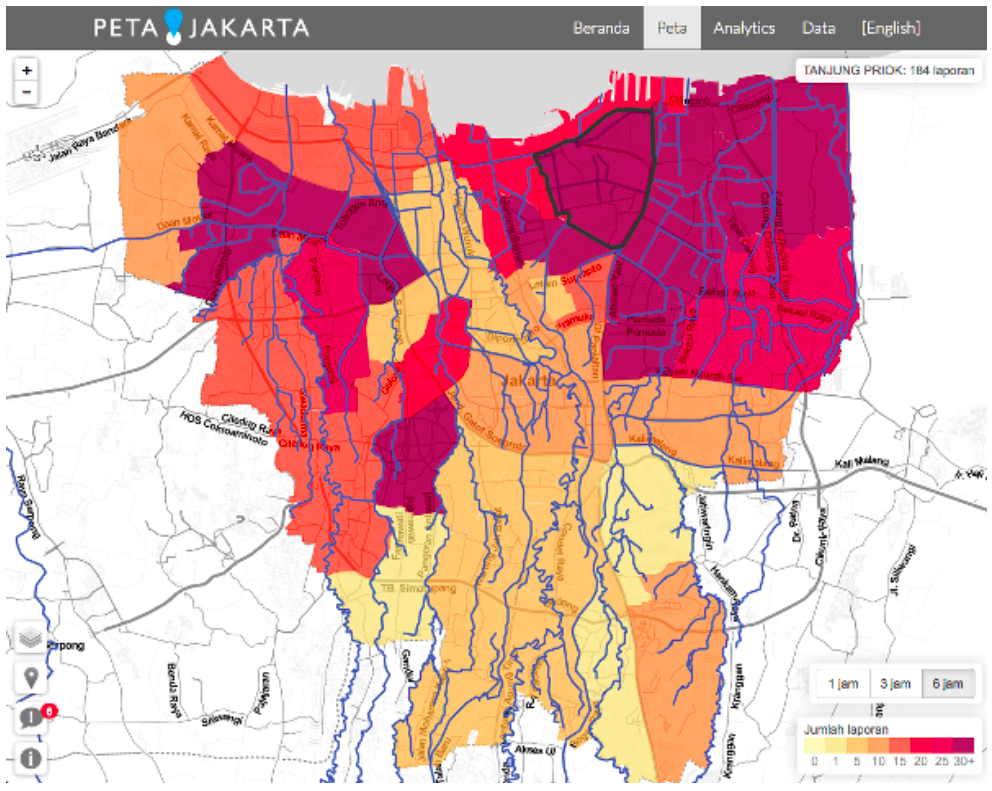
For institutional partners, the data is visualized in more aggregate terms for strategic decision-making based trends-analysis and data integration. “When viewed on a desktop computer, the web-application scaled the map to show a situational overview of the city.”
Peta Jakarta has “proven the value and utility of social media as a mega-city methodology for crowdsourcing relevant situational information to aid in decision-making and response coordination during extreme weather events.” The initiative enables “autonomous users to make independent decisions on safety and navigation in response to the flood in real-time, thereby helping increase the resilience of the city’s residents to flooding and its attendant difficulties.” In addition, by “providing decision support at the various spatial and temporal scales required by the different actors within city, Peta Jakarta offers an innovative and inexpensive method for the crowdsourcing of time-critical situational information in disaster scenarios.” The resulting confirmed and verified tweets were used by BPBD DKI Jakarta to “cross-validate formal reports of flooding from traditional data sources, supporting the creation of information for flood assessment, response, and management in real-time.”
My blog post is based several conversations I had with Peta Jakarta team and on this white paper, which was just published a week ago. The report runs close to 100 pages and should absolutely be considered required reading for all Digital Humanitarians and CrisisMappers. The paper includes several dozen insights which a short blog post simply cannot do justice to. If you can’t find the time to read the report, then please see the key excerpts below. In a future blog post, I’ll describe how the Peta Jakarta team plans to leverage UAVs to complement social media reporting.
Extracting knowledge from the “noise” of social media requires designed engagement and filtering processes to eliminate unwanted information, reward valuable reports, and display useful data in a manner that further enables users, governments, or other agencies to make non-trivial, actionable decisions in a time-critical manner.
While the utility of passively-mined social media data can offer insights for offline analytics and derivative studies for future planning scenarios, the critical issue for frontline emergency responders is the organization and coordination of actionable, real-time data related to disaster situations.
User anonymity in the reporting process was embedded within the Peta Jakarta project. Whilst the data produced by Twitter reports of flooding is in the public domain, the objective was not to create an archive of users who submitted potentially sensitive reports about flooding events, outside of the Twitter platform. Peta Jakarta was thus designed to anonymize reports collected by separating reports from their respective users. Furthermore, the text content of tweets is only stored when the report is confirmed, that is, when the user has opted to send a message to the @petajkt account to describe their situation. Similarly, when usernames are stored, they are encrypted using a one-way hash function.
In developing the Peta Jakarta brand as the public face of the project, it was important to ensure that the interface and map were presented as community-owned, rather than as a government product or academic research tool. Aiming to appeal to first adopters—the young, tech-savvy Twitter-public of Jakarta—the language used in all the outreach materials (Twitter replies, the outreach video, graphics, and print advertisements) was intentionally casual and concise. Because of the repeated recurrence of flood events during the monsoon, and the continuation of daily activities around and through these flood events, the messages were intentionally designed to be more like normal twitter chatter and less like public service announcements.
It was important to design the user interaction with PetaJakarta.org to create a user experience that highlighted the community resource element of the project (similar to the Waze traffic app), rather than an emergency or information service. With this aim in mind, the graphics and language are casual and light in tone. In the video, auto-replies, and print advertisements, PetaJakarta.org never used alarmist or moralizing language; instead, the graphic identity is one of casual, opt-in, community participation.
The most frequent question directed to @petajkt on Twitter was about how to activate the geo-location function for tweets. So far, this question has been addressed manually by sending a reply tweet with a graphic instruction describing how to activate geo-location functionality.
Critical to the success of the project was its official public launch with, and promotion by, the Governor. This endorsement gave the platform very high visibility and increased legitimacy among other government agencies and public users; it also produced a very successful media event, which led substantial media coverage and subsequent public attention.
The aggregation of the tweets (designed to match the spatio-temporal structure of flood reporting in the system of the Jakarta Disaster Management Agency) was still inadequate when looking at social media because it could result in their overlooking reports that occurred in areas of especially low Twitter activity. Instead, the Agency used the @petajkt Twitter stream to direct their use of the map and to verify and cross-check information about flood-affected areas in real-time. While this use of social media was productive overall, the findings from the Joint Pilot Study have led to the proposal for the development of a more robust Risk Evaluation Matrix (REM) that would enable Peta Jakarta to serve a wider community of users & optimize the data collection process through an open API.
Developing a more robust integration of social media data also means leveraging other potential data sets to increase the intelligence produced by the system through hybridity; these other sources could include, but are not limited to, government, private sector, and NGO applications (‘apps’) for on- the-ground data collection, LIDAR or UAV-sourced elevation data, and fixed ground control points with various types of sensor data. The “citizen-as- sensor” paradigm for urban data collection will advance most effectively if other types of sensors and their attendant data sources are developed in concert with social media sourced information.
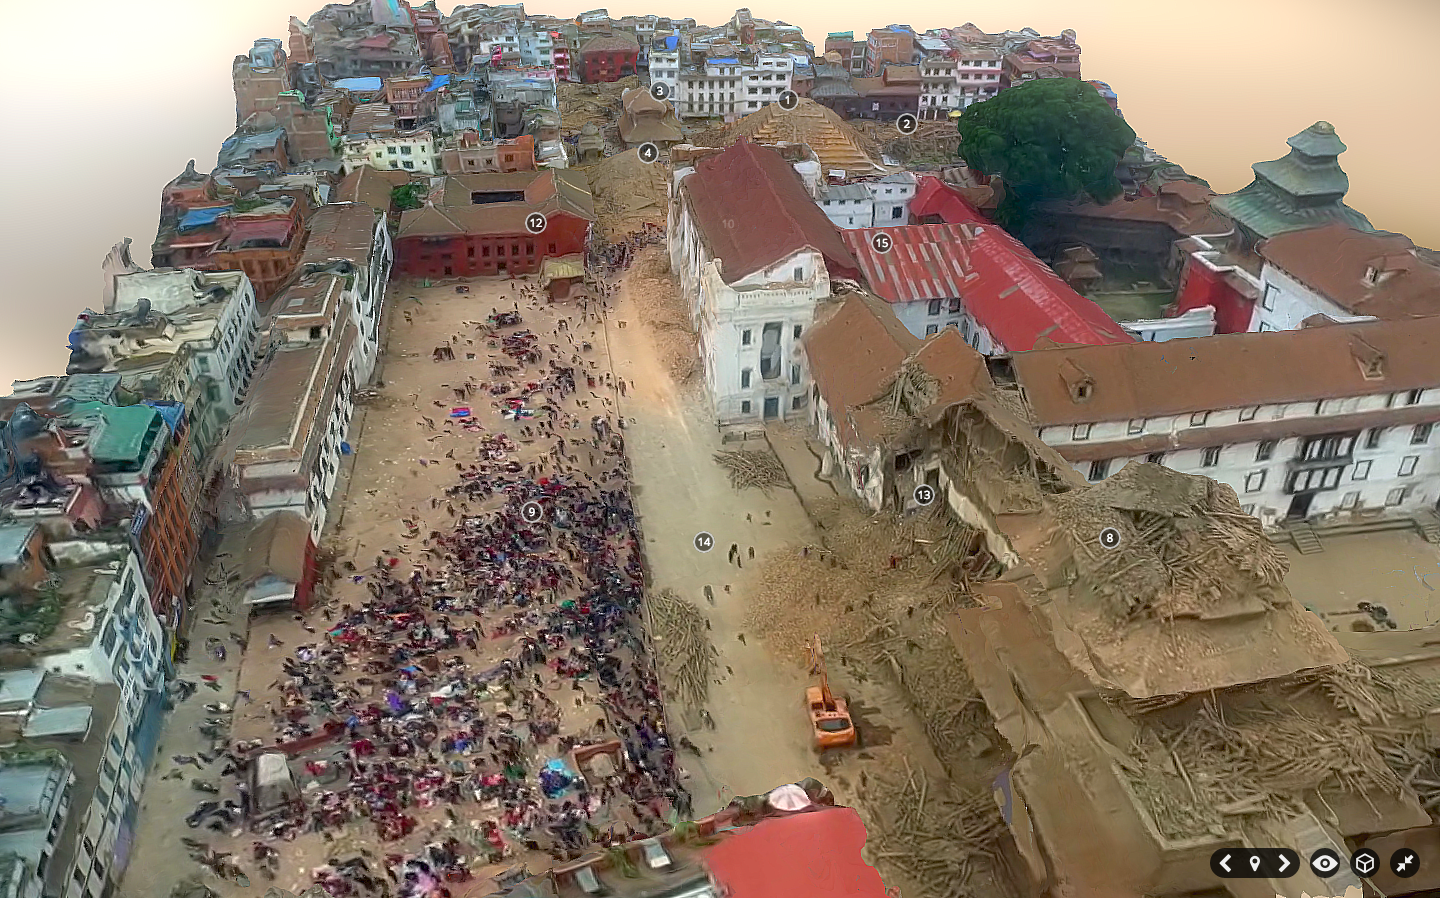
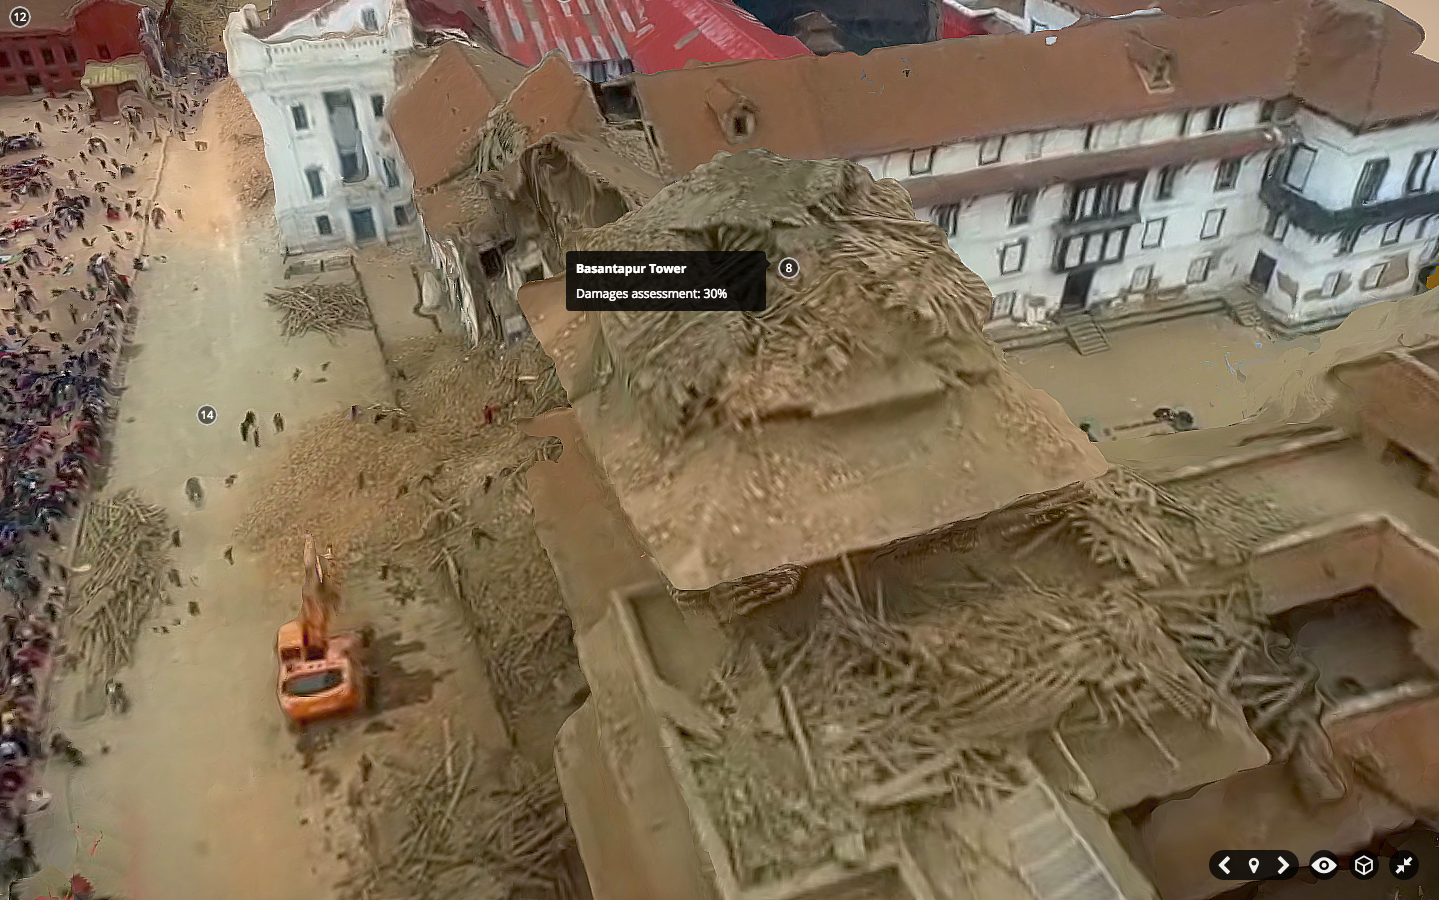
Humanitarian and development organizations like the United Nations and the World Bank typically carry out disaster damage and needs assessments following major disasters. The ultimate goal of these assessments is to measure the impact of disasters on the society, economy and environment of the affected country or region. This includes assessing the damage caused to building infrastructure, for example. These assessment surveys are generally carried out in person—that is, on foot and/or by driving around an affected area. This is a very time-consuming process with very variable results in terms of data quality. Can 3D (Point Clouds) derived from very high resolution aerial imagery captured by UAVs accelerate and improve the post-disaster damage assessment process? Yes, but a number of challenges related to methods, data & software need to be overcome first. Solving these challenges will require pro-active cross-disciplinary collaboration.
The following three-tiered scale is often used to classify infrastructure damage: “1) Completely destroyed buildings or those beyond repair; 2) Partially destroyed buildings with a possibility of repair; and 3) Unaffected buildings or those with only minor damage . By locating on a map all dwellings and buildings affected in accordance with the categories noted above, it is easy to visualize the areas hardest hit and thus requiring priority attention from authorities in producing more detailed studies and defining demolition and debris removal requirements” (UN Handbook). As one World Bank colleague confirmed in a recent email, “From the engineering standpoint, there are many definitions of the damage scales, but from years of working with structural engineers, I think the consensus is now to use a three-tier scale – destroyed, heavily damaged, and others (non-visible damage).”
That said, field-based surveys of disaster damage typically overlook damage caused to roofs since on-the-ground surveyors are bound by the laws of gravity. Hence the importance of satellite imagery. At the same time, however, “The primary problem is the vertical perspective of [satellite imagery, which] largely limits the building information to the roofs. This roof information is well suited for the identification of extreme damage states, that is completely destroyed structures or, to a lesser extent, undamaged buildings. However, damage is a complex 3-dimensional phenomenon,” which means that “important damage indicators expressed on building façades, such as cracks or inclined walls, are largely missed, preventing an effective assessment of intermediate damage states” (Fernandez Galaretta et al. 2014).
This explains why “Oblique imagery [captured from UAVs] has been identified as more useful, though the multi-angle imagery also adds a new dimension of complexity” as we experienced first-hand during the World Bank’s UAV response to Cyclone Pam in Vanuatu (Ibid, 2014). Obtaining photogrammetric data for oblique images is particularly challenging. That is, identifying GPS coordinates for a given house pictured in an oblique photograph is virtually impossible to do automatically with the vast majority of UAV cameras. (Only specialist cameras using gimbal mounted systems can reportedly infer photogrammetric data in oblique aerial imagery, but even then it is unclear how accurate this inferred GPS data is). In any event, oblique data also “lead to challenges resulting from the multi-perspective nature of the data, such as how to create single damage scores when multiple façades are imaged” (Ibid, 2014).
To this end, my colleague Jorge Fernandez Galarreta and I are exploring the use of 3D (point clouds) to assess disaster damage. Multiple software solutions like Pix4D and PhotoScan can already be used to construct detailed point clouds from high-resolution 2D aerial imagery (nadir and oblique). “These exceed standard LiDAR point clouds in terms of detail, especially at façades, and provide a rich geometric environment that favors the identification of more subtle damage features, such as inclined walls, that otherwise would not be visible, and that in combination with detailed façade and roof imagery have not been studied yet” (Ibid, 2014).
Unlike oblique images, point clouds give surveyors a full 3D view of an urban area, allowing them to “fly through” and inspect each building up close and from all angles. One need no longer be physically onsite, nor limited to simply one façade or a strictly field-based view to determine whether a given building is partially damaged. But what does partially damaged even mean when this kind of high resolution 3D data becomes available? Take this recent note from a Bank colleague with 15+ years of experience in disaster damage assessments: “In the [Bank’s] official Post-Disaster Needs Assessment, the classification used is to say that if a building is 40% damaged, it needs to be repaired. In my view this is too vague a description and not much help. When we say 40%, is it the volume of the building we are talking about or the structural components?”
In their recent study, Fernandez Galaretta et al. used point clouds to generate per-building damage scores based on a 5-tiered classification scale (D1-D5). They chose to compute these damage scores based on the following features: “cracks, holes, intersection of cracks with load-carrying elements and dislocated tiles.” They also selected non-damage related features: “façade, window, column and intact roof.” Their results suggest that the visual assessment of point clouds is very useful to identify the following disaster damage features: total collapse, collapsed roof, rubble piles, inclined façades and more subtle damage signatures that are difficult to recognize in more traditional BDA [Building Damage Assessment] approaches. The authors were thus able to compute a per building damage score, taking into account both “the overall structure of the building,” and the “aggregated information collected from each of the façades and roofs of the building to provide an individual per-building damage score.”
Fernandez Galaretta et al. also explore the possibility of automating this damage assessment process based on point clouds. Their conclusion: “More research is needed to extract automatically damage features from point clouds, combine those with spectral and pattern indicators of damage, and to couple this with engineering understanding of the significance of connected or occluded damage indictors for the overall structural integrity of a building.” That said, the authors note that this approach would “still suffer from the subjectivity that characterizes expert-based image analysis.”
Hence my interest in using crowdsourcing to analyze point clouds for disaster damage. Naturally, crowdsourcing alone will not eliminate subjectivity. In fact, having more people analyze point clouds may yield all kinds of disparate results. This is explains why a detailed and customized imagery interpretation guide is necessary; like this one, which was just released by my colleagues at the Harvard Humanitarian Initiative (HHI). This also explains why crowdsourcing platforms require quality-control mechanisms. One easy technique is triangulation: have ten different volunteers look at each point cloud and tag features in said cloud that show cracks, holes, intersection of cracks with load-carrying elements and dislocated tiles. Surely more eyes are better than two for tasks that require a good eye for detail.
Next, identify which features have the most tags—this is the triangulation process. For example, if one area of a point cloud is tagged as a “crack” by 8 or more volunteers, chances are there really is a crack there. One can then count the total number of distinct areas tagged as cracks by 8 or more volunteers across the point cloud to calculate the total number of cracks per façade. Do the same with the other metrics (holes, dislocated titles, etc.), and you can compute a per building damage score based on overall consensus derived from hundreds of crowdsourced tags. Note that “tags’ can also be lines or polygons; meaning that individual cracks could be traced by volunteers, thus providing information on the approximate lengths/size of a crack. This variable could also be factored in the overall per-building damage score.
In sum, crowdsourcing could potentially overcome some of the data quality issues that have already marked field-based damage assessment surveys. In addition, crowdsourcing could potentially speed up the data analysis since professional imagery and GIS analysts tend to already be hugely busy in the aftermath of major disasters. Adding more data to their plate won’t help anyone. Crowdsourcing the analysis of 3D point clouds may thus be our best bet.
So why hasn’t this all been done yet? For several reasons. For one, creating very high-resolution point clouds requires more pictures and thus more UAV flights, which can be time consuming. Second, processing aerial imagery to construct point clouds can also take some time. Third, handling, sharing and hosting point clouds can be challenging given how large those files quickly get. Fourth, no software platform currently exists to crowdsource the annotation of point clouds as described above (particularly when it comes to the automated quality control mechanisms that are necessary to ensure data quality). Fifth, we need more robust imagery interpretation guides. Sixth, groups like the UN and the World Bank are still largely thinking in 2D rather than 3D. And those few who are considering 3D tend to approach this from a data visualization angle rather than using human and machine computing to analyze 3D data. Seventh, this area, point cloud analysis for 3D feature detection, is still a very new area of research. Many of the methodology questions that need answers have yet to be answered, which is why my team and I at QCRI are starting to explore this area from the perspective of computer vision and machine learning.
The holy grail? Combining crowdsourcing with machine learning for real-time feature detection of disaster damage in 3D point clouds rendered in real-time via airborne UAVs surveying a disaster site. So what is it going to take to get there? Well, first of all, UAVs are becoming more sophisticated; they’re flying faster and for longer and will increasingly be working in swarms. (In addition, many of the new micro-UAVs come with a “follow me” function, which could enable the easy and rapid collection of aerial imagery during field assessments). So the first challenge described above is temporary as are the second and third challenges since computer processing power is increasing, not decreasing, over time.
This leaves us with the software challenge and imagery guides. I’m already collaborate with HHI on the latter. As for the former, I’ve spoken with a number of colleagues to explore possible software solutions to crowdsource the tagging of point clouds. One idea is simply to extend MicroMappers. Another is to add simple annotation features to PLAS.io and PointCloudViz since these platforms are already designed to visualize and interact with point clouds. A third option is to use a 3D model platform like SketchFab, which already enables annotations. (Many thanks to colleague Matthew Schroyer for pointing me to SketchFab last week). I’ve since had a long call with SketchFab and am excited by the prospects of using this platform for simple point cloud annotation.
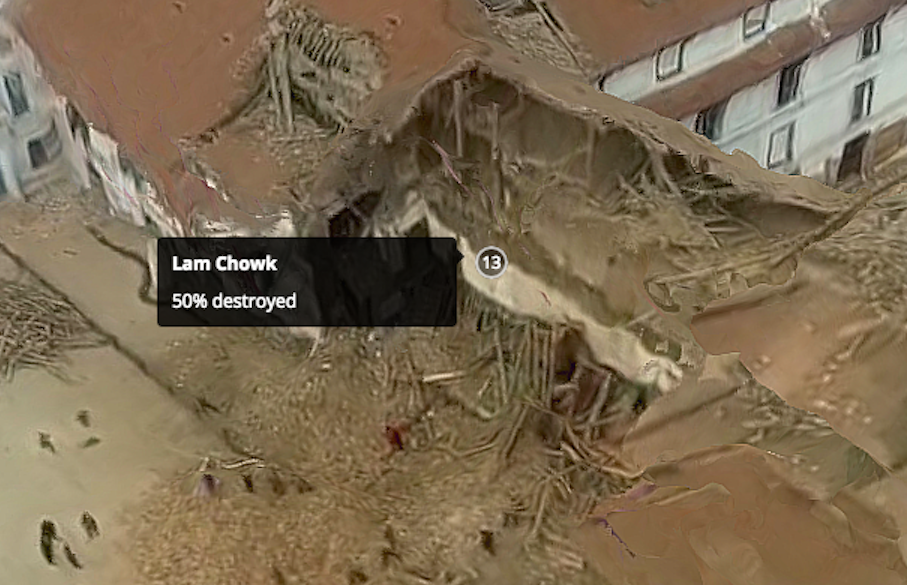
In fact, Matthew already used SketcFab to annotate a 3D model of Durbar Square neighborhood in downtown Kathmandu post-earthquake. He found an aerial video of the area, took multiple screenshots of this video, created a point cloud from these and then generated a 3D model which he annotated within SketchFab. This model, pictured below, would have been much higher resolution if he had the original footage or 2D images. Click pictures to enlarge.
Here’s a short video with all the annotations in the 3D model:
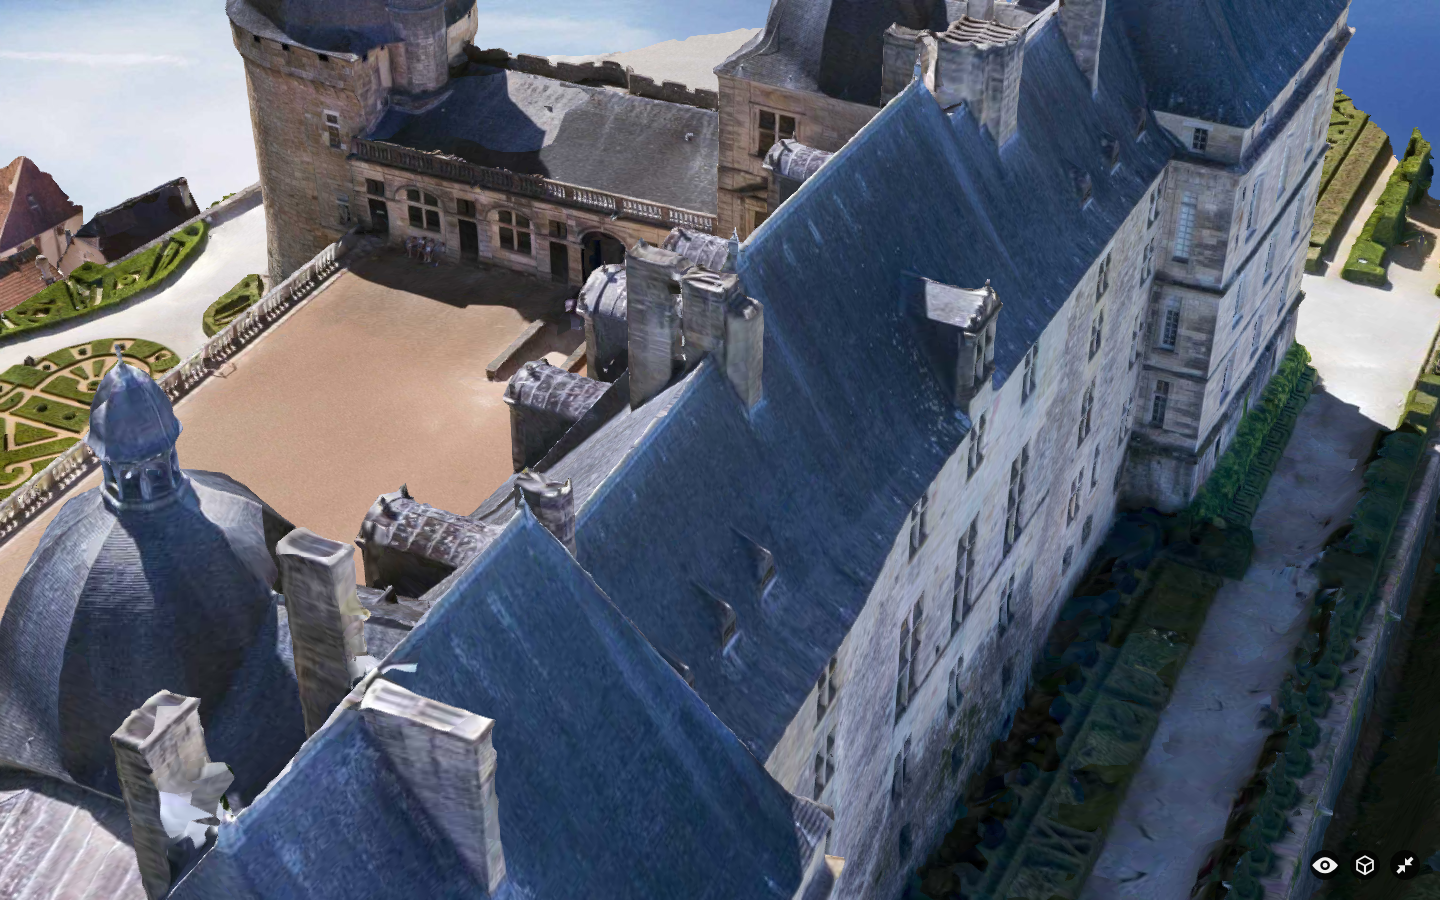
And here’s the link to the “live” 3D model. And to drive home the point that this 3D model could be far higher resolution if the underlying imagery had been directly accessible to Matthew, check out this other SketchFab model below, which you can also access in full here.
The SketchFab team has kindly given me a SketchFab account that allows up to 50 annotations per 3D model. So I’ll be uploading a number of point clouds from Vanuatu (post Cyclone Pam) and Nepal (post earthquakes) to explore the usability of SketchFab for crowdsourced disaster damage assessments. In the meantime, one could simply tag-and-number all major features in a point cloud, create a Google Form, and ask digital volunteers to rate the level of damage near each numbered tag. Not a perfect solution, but one that works. Ultimately, we’d need users to annotate point clouds by tracing 3D polygons if we wanted a more easy way to use the resulting data for automated machine learning purposes.
In any event, if readers do have any suggestions on other software platforms, methodologies, studies worth reading, etc., feel free to get in touch via the comments section below or by email, thank you. In the meantime, many thanks to colleagues Jorge, Matthew, Ferda & Ji (QCRI), Salvador (PointCloudViz), Howard (PLAS.io) and Corentin (SketchFab) for the time they’ve kindly spent brainstorming the above issues with me.
I thrive when working across disciplines, building diverse cross-cutting coalitions to create, translate and apply innovative strategies driven by shared values. This has enabled the 20+ organizations I’ve worked with, and those I’ve led, to accelerate meaningful and inclusive social impact.
Which is why I've been called a social entrepreneur and a translational leader by successful innovators. President Clinton once called me a digital pioneer, while recent colleagues describe me as kind, dedicated, values-driven, authentic, creative, ethical, and impactful.