Category Archives: Early Warning

How to Counter Rumors and Prevent Violence Using UAVs

The Sentinel Project recently launched their Human Security UAV program in Kenya’s violence-prone Tana Delta to directly support Una Hakika (“Are You Sure”). Hakika is an information service that serves to “counteract malicious misinformation [disinformation] which has been the trigger for recent outbreaks of violence in the region.” While the Tana Delta is one of Kenya’s least developed areas, both “mobile phone and internet usage is still surprisingly high.” At the same time, misinformation has “played a significant role in causing fear, distrust and hatred between communities” because the Tana Delta is perhaps parado-xically also an “information-starved environment in which most people still rely on word-of-mouth to get news about the world around them.”

TanaDeltaPic2

In other words, there are no objective, authoritative sources of information per se, so Una Hakika (“Are You Sure”) seeks to be the first accurate, neutral and reliable source of information. Una Hakika is powered by a dedicated toll-free SMS short code and an engaged, trusted network of volunteer ambassadors. When the team receives a rumor verification request via SMS, they proceed to verify the rumor and report the findings back (via SMS) to the community. This process involves “gathering a lot of information from various different sources and trying to make sense of it […]. That’s where WikiRumours comes in as our purpose-built software for managing the Una Hakika workflow.”

TanaPic1

A year after implementing the project, the Sentinel team carried out a series of focus groups to assess impact The findings are particularly encouraging. In a way, the Sentinel team has formalized and stream-lined the organic verification process I describe here: How To Use Technology To Counter Rumors During Crises: Anecdotes from Kyrgyzstan. So where do UAVs come in?

The Sentinel team recently introduced the use of UAVs to support Una Hakika’s verification efforts and will be expanding the program to include a small fleet of multi-rotor and fixed wing platforms. Before piloting this new technology, the team carried out research to better understand local perceptions around UAVs (also referred to as Unmanned Aerial Systems, UAS):

“Common public opinion concerns in places like Europe and North America relate to the invasion of privacy, misuse by government or law enforcement, a related concern about an overbearing security state, and fears of an aviation disaster. Concerns found among residents of the Tana Delta revolve around practical issues such as whether the UAS-mounted camera would be powerful enough to be useful, how far such systems can operate, whether they are hampered by weather, how quickly a drone can be deployed in an emergency, and who will be in physical possession of the system.”

“For the most part, they [local residents] are genuinely curious, have a plethora of questions about the implementation of UAS in their communities, and are enthusiastic about the many possibilities. This genuine technological optimism makes the Tana Delta a likely site for one of the first programs of its kind. The Sentinel Project is conducting its UAS operations with the policy of ‘progress through caution,’ which seeks to engage communities within the proposed deployment while offering complete transparency and involvement but always emphasizing exposure to (and demonstration of) systems in the field with the people who have the potential to benefit from these initiatives. This approach has been extremely well received & has already resulted in improvements to implementation.”

While Una Hakika’s verification network includes hundreds of volunteer ambassadors, they can’t be everywhere at the same time. As the Sentinel team mentioned during one of our recent conversations, there are some places that simply can’t be reached by foot reliably. In addition, the UAVs can operate both day and night; wandering around at night can be dangerous for Una Hakika’s verification ambassadors. The Sentinel team thus plans to add InfraRed, thermal imaging capabilities to the UAVs. The core of the program will be to use UAVs to set up perimeter security areas around threatened communities. In addition, the program can address other vectors which have led to recent violence: using the UAVs to help find lost (potentially stolen) cattle, track crop health, and monitor contested land use. The team mentioned that the UAVs could also be used to support search and rescue efforts during periods of drought and floods.

Tana3

Lastly, they’ve started discussing the use of UAVs for payload transportation. For example, UAVs could deliver medical supplies to remote villages that have been attacked. After all, the World Health Organization (WHO) is already using UAVs for this purpose. With each of these applications, the Sentinel team clearly emphasizes that the primary users and operators of the UAVs must be the local staff in the region. “We believe that successful technology driven programs must not only act as tools to serve these communities but also allow community members to have direct involvement in their use”.

As the Sentinel team rightly notes, their approach helps to “counteract the paralysis which arises from the unknowns of a new endeavour when studied in a purely academic setting. The Sentinel Project team believes that a cautious but active strategy of real-world deployments will best demonstrate the value of such programs to governments and global citizens.” This very much resonates with me, which is why I am pleased to serve on the organization’s Advisory Board.

Big Data: Sensing and Shaping Emerging Conflicts

The National Academy of Engineering (NAE) and US Institute of Peace (USIP) co-organized a fascinating workshop on “Sensing & Shaping Emerging Conflicts” in November 2012. I had the pleasure of speaking at this workshop, the objective of which was to “identify major opportunities and impediments to providing better real-time information to actors directly involved in situations that could lead to deadly violence.” We explored “several scenarios of potential violence drawn from recent country cases,” and “considered a set of technologies, applications and strategies that have been particularly useful—or could be, if better adapted for conflict prevention.” 

neurons_cropped

The workshop report was finally published this week. If you don’t have time to leaf through the 40+page study, then the following highlights may be of interest. One of the main themes to emerge was the promise of machine learning (ML), a branch of Artificial Intelligence (AI). These approaches “continue to develop and be applied in un-anticipated ways, […] the pressure from the peacebuilding community directed at technology developers to apply these new technologies to the cause of peace could have tremendous benefits.” On a personal note, this is one of the main reasons I joined the Qatar Computing Research Institute (QCRI); namely to apply the Institute’s expertise in ML and AI to the cause of peace, development and disaster relief.

“As an example of the capabilities of new technologies, Rafal Rohozinski, principal with the SecDev Group, described a sensing exercise focused on Syria. Using social media analytics, his group has been able to identify the locations of ceasefire violations or regime deployments within 5 to 15 minutes of their occurrence. This information could then be passed to UN monitors and enable their swift response. In this way, rapid deductive cycles made possible through technology can contribute to rapid inductive cycles in which short-term predictions have meaningful results for actors on the ground. Further analyses of these events and other data also made it possible to capture patterns not seen through social media analytics. For example, any time regime forces moved to a particular area, infrastructure such as communications, electricity, or water would degrade, partly because the forces turned off utilities, a normal practice, and partly because the movement of heavy equipment through urban areas caused electricity systems go down. The electrical grid is connected to the Internet, so monitoring of Internet connections provided immediate warnings of force movements.”

This kind of analysis may not be possible in many other contexts. To be sure, the challenge of the “Digital Divide” is particularly pronounced vis-a-vis the potential use of Big Data for sensing and shaping emerging conflicts. That said, my colleague Duncan Watts “clarified that inequality in communications technology is substantially smaller than other forms of inequality, such as access to health care, clean water, transportation, or education, and may even help reduce some of these other forms of inequality. Innovation will almost always accrue first to the wealthier parts of the world, he said, but inequality is less striking in communications than in other areas.” By 2015, for example, Sub-Saharan Africa will have more people with mobile network access than with electricity at home.

Screen Shot 2013-03-16 at 5.46.35 PM

My colleague Chris Spence from NDI also presented at the workshop. He noted the importance of sensing the positive and not just the negative during an election. “In elections you want to focus as much on the positive as you do on the negative and tell a story that really does convey to the public what’s actually going on and not just a … biased sample of negative reports.” Chris also highlighted that “one problem with election monitoring is that analysts still typically work with the software tools they used in the days of manual reporting rather than the Web-based tools now available. There’s an opportunity that we’ve been trying to solve, and we welcome help.” Building on our expertise in Machine Learning and Artificial Intelligence, my QCRI colleagues and I want to develop classifiers that automatically categorize large volumes of crowdsourced election reports. So I’m exploring this further with Chris & NDI. Check out the Artificial Intelligence for Monitoring Elections (AIME) project for more information.

One of the most refreshing aspects of the day-long workshop was the very clear distinction made between warning and response. As colleague Sanjana Hattotuwa cautioned: “It’s an open question whether some things are better left unsaid and buried literally and metaphorically.”  Duncan added that, “The most important question is what to do with information once it has been gathered.” Indeed, “Simply giving people more information doesn’t necessarily lead to a better outcome, although some-times it does.” My colleague Dennis King summed it up very nicely, “Political will is not an icon on your computer screen… Generating political will is the missing factor in peacebuilding and conflict resolution.”

In other words, “the peacebuilding community often lacks actionable strategies to convert sensing into shaping,” as colleague Fred Tipson rightly noted. Libbie Prescott, who served as strategic advisor to the US Secretary of State and participated in the workshop, added: “Policymakers have preexisting agendas, and just presenting them with data does not guarantee a response.” As my colleague Peter Walker wrote in a book chapter published way back in 1992, “There is little point in investing in warning systems if one then ignores the warnings!” To be clear, “early warning should not be an end in itself; it is only a tool for preparedness, prevention and mitigation with regard to disasters, emergencies and conflict situations, whether short or long term ones. […] The real issue is not detecting the developing situation, but reacting to it.”

Now Fast froward to 2013: OCHA just published this groundbreaking report confirming that “early warning signals for the Horn of Africa famine in 2011 did not produce sufficient action in time, leading to thousands of avoidable deaths. Similarly, related research has shown that the 2010 Pakistan floods were predictable.” As DfID notes in this 2012 strategy document, “Even when good data is available, it is not always used to inform decisions. There are a number of reasons for this, including data not being available in the right format, not widely dispersed, not easily accessible by users, not being transmitted through training and poor information management. Also, data may arrive too late to be able to influence decision-making in real time operations or may not be valued by actors who are more focused on immediate action” (DfID)So how do we reconcile all this with Fred’s critical point: “The focus needs to be on how to assist the people involved to avoid the worst consequences of potential deadly violence.”

mind-the-gap

The fact of the matter is that this warning-response gap in the field of conflict prevention is over 20 years old. I have written extensively about the warning-response problem here (PDF) and here (PDF), for example. So this challenge is hardly a new one, which explains why a number of innovative and promising solutions have been put forward of the years, e..g, the decentralization of conflict early warning and response. As my colleague David Nyheim wrote five years ago:

A state-centric focus in conflict management does not reflect an understanding of the role played by civil society organisations in situations where the state has failed. An external, interventionist, and state-centric approach in early warning fuels disjointed and top down responses in situations that require integrated and multilevel action.” He added: “Micro-level responses to violent conflict by ‘third generation early warning systems’ are an exciting development in the field that should be encouraged further. These kinds of responses save lives.”

This explains why Sanjana is right when he emphasizes that “Technology needs to be democratized […], made available at the lowest possible grassroots level and not used just by elites. Both sensing and shaping need to include all people, not just those who are inherently in a position to use technology.” Furthermore, Fred is spot on when he says that “Technology can serve civil disobedience and civil mobilization […] as a component of broader strategies for political change. It can help people organize and mobilize around particular goals. It can spread a vision of society that contests the visions of authoritarian.”

In sum, As Barnett Rubin wrote in his excellent book (2002) Blood on the Doorstep: The Politics of Preventive Action, “prevent[ing] violent conflict requires not merely identifying causes and testing policy instruments but building a political movement.” Hence this 2008 paper (PDF) in which I explain in detail how to promote and facilitate technology-enabled civil resistance as a form of conflict early response and violence prevention.

Bio

See Also:

  • Big Data for Conflict Prevention [Link]

The Geography of Twitter: Mapping the Global Heartbeat

My colleague Kalev Leetaru recently co-authored this comprehensive study on the various sources and accuracies of geographic information on Twitter. This is the first detailed study of its kind. The detailed analysis, which runs some 50-pages long, has important implications vis-a-vis the use of social media in emergency management and humanitarian response. Should you not have the time to analyze the comprehensive study, this blog post highlights the most important and relevant findings.

Kalev et al. analyzed 1.5 billion tweets (collected from the Twitter Decahose via GNIP) between October 23 and November 30th, 2012. This came to 14.3 billion words posted by 35% of all active users at the time. Note that 2.9% of the world’s population are active Twitter users and that 87% of all tweets ever posted since the launch of Twitter in 2006 were posted in the past 24 months alone. On average, Kalev and company found that the lowest number of tweets posted per hour is one million; the highest is 2 million. In addition, almost 50% of all tweets are posted by 5% of users. (Click on images to enlarge).

Tweets

In terms of geography, there are two ways to easily capture geographic data from Twitter. The first is from the location information specified by a user when registering for a Twitter account (selected from a drop down menu of place names). The second, which is automatically generated, is from the coordinates of the Twitter user’s location when tweeting, which is typically provided via GPS or cellular triangulation. On a typical day, about 2.7% of Tweets contain GPS or cellular data while 2.02% of users list a place name when registering (1.4% have both). The figure above displays all GPS/cellular coordinates captured from tweets during the 39 days of study. In contrast, the figure below combines all Twitter locations, adding registered place names and GPS/cellular data (both in red), and overlays this with the location of electric lights (blue) based on satellite imagery obtained from NASA.

Tweets / Electricity

White areas depict locations with an equal balance of tweets and electricity. Red areas reveal a higher density of tweets than night lights while blue areas have more night lights than tweets.” Iran and China show substantially fewer tweets than their electricity levels would suggest, reflecting their bans on Twitter, while India shows strong clustering of Twitter usage along the coast and its northern border, even as electricity use is far more balanced throughout the country. Russia shows more electricity usage in its eastern half than Twitter usage, while most countries show far more Twitter usage than electricity would suggest.”

The Pearson correlation between tweets and lights is 0.79, indicating very high similarity. That is, wherever in the world electricity exists, the chances of there also being Twitter users is very high indeed. That is, tweets are evenly distributed geographically according to the availability of electricity. And so, event though “less than three percent of all tweets having geolocation information, this suggests they could be used as a dynamic reference baseline to evaluate the accuracy of other methods of geographic recovery.” Keep in mind that the light bulb was invented 134 years ago in contrast to Twitter’s short 7-year history. And yet, the correlation is already very strong. This is why they call it an information revolution. Still, just 1% of all Twitter users accounted for 66% of all georeferenced tweets during the period of study, which means that relying purely on these tweets may provide a skewed view of the Twitterverse, particularly over short periods of time. But whether this poses a problem ultimately depends on the research question or task at hand.

Twitter table

The linguistic geography of Twitter is critical: “If English is rarely used outside of the United States, or if English tweets have a fundamentally different geographic profile than other languages outside of the United States, this will significantly skew geocoding results.” As the table below reveals, georeferenced tweets with English content constitute 41.57% of all geo-tagged tweets.

Geo Tweets Language

The data from the above table is displayed geographically below for the European region. See the global map here. “In cases where multiple languages are present at the same coordinate, the point is assigned to the most prevalent language at that point and colored accordingly.” Statistical analyses of geo-tagged English tweets compared to all other languages suggests that “English offers a spatial proxy for all languages and that a geocoding algorithm which processes only English will still have strong penetration into areas dominated by other languages (though English tweets may discuss different topics or perspectives).”

Twitter Languages Europe

Another important source of geographic information is a Twitter user’s bio. This public location information was available for 71% of all tweets studied by Kalev and company. Interestingly, “Approximately 78.4 percent of tweets include the user’s time zone in textual format, which offers an approximation of longitude […].” As Kalev et al. note, “Nearly one third of all locations on earth share their name with another location somewhere else on the planet, meaning that a reference to ‘Urbana’ must be disambiguated by a geocoding system to determine which of the 12 cities in the world it might refer to, including 11 cities in the United States with that name.”

There are several ways to get around this challenging, ranging from developing a Full Text Geocoder to using gazetteers such a Wikipedia Gazetteer and MaxFind which machine translation. Applying the latter has revealed that the “textual geographic density of Twitter changes by more than 53 percent over the course of each day. This has enormous ramifications for the use of Twitter as a global monitoring system, as it suggests that the representativeness of geographic tweets changes considerably depending on time of day.” That said, the success of a monitoring system is solely dependent on spatial data. Temporal factors and deviations from a baseline also enable early detection.  In any event, “The small volume of georeferenced tweets can be dramatically enhanced by applying geocoding algorithms to the textual content and metadata of each tweet.”

Kalet et al. also carried out a comprehensive analysis of geo-tagged retweets. They find that “geography plays little role in the location of influential users, with the volume of retweets instead simply being a factor of the total population of tweets originating from that city.” They also calculated that the average geographical distance between two Twitter users “connected” by retweets (RTs) and who geotag their tweets is about 750 miles or 1,200 kilometers. When a Twitter user references another (@), the average geographical distance between the two is 744 miles. This means that RTs and @’s cannot be used for geo-referencing Twitter data, even when coupling this information with time zone data. The figure below depicts the location of users retweeting other users. The geodata for this comes from the geotagged tweets (rather than account information or profile data).

Map of Retweets

On average, about 15.85% of geo-tagged tweets contain links. The most popular links for these include Foursquare, Instagram, Twitter and Facebook. See my previous blog post on the analysis & value of such content for disaster response. In terms of Twitter geography versus that of mainstream news, Kalev et al. analyzed all news items available via Google News during the same period as the tweets they collected. This came to over 3.3 million articles pointing to just under 165,000 locations. The latter are color-coded red in the data ziv below, while Tweets are blue and white areas denote equal balance of both.

Twitter vs News

“Mainstream media appears to have significantly less coverage of Latin America and vastly better greater of Africa. It also covers China and Iran much more strongly, given their bans on Twitter, as well as having enhanced coverage of India and the Western half of the United States. Overall, mainstream media appears to have more even coverage, with less clustering around major cities.” This suggests “there is a strong difference in the geographic profiles of Twitter and mainstream media and that the intensity of discourse mentioning a country does not necessarily match the intensity of discourse emanating from that country in social media. It also suggests that Twitter is not simply a mirror of mainstream media, but rather has a distinct geographic profile […].”

In terms of future growth, “the Middle East and Eastern Europe account for some of Twitter’s largest new growth areas, while Indonesia, Western Europe, Africa, and Central America have high proportions of the world’s most influential Twitter users.”

Bio

See also:

  • Social Media – Pulse of the Planet? [Link]
  • Big Data for Disaster Response – A list of Wrong Assumptions [Link]
  • A Multi-Indicator Approach for Geolocalization of Tweets [Link]

Big Data for Conflict Prevention

I had the great pleasure of co-authoring the International Peace Institute’s (IPI) unique report on “Big Data for Conflict Prevention” with my two colleagues Emmanuel Letouzé and Patrick Vinck. The study explores how Big Data may help reveal key insights into the drivers, triggers, and early signs of large-scale violence in order to support & improve conflict prevention initiatives.

The main sections of the report include:

  • What Do We Mean By Big  Data for Conflict Prevention?
  • What Are the Current Uses or Related Techniques in Other Fields?
  • How Can Big Data Be Used for Conflict Prevention?
  • What Are The Main Challenges and Risks?
  • Which Principles/Institutions Should Guide this Field?

The study ties many of my passions together. Prior to Crisis Mapping and Humanitarian Technology, I worked in the field of Conflict Prevention and Conflict Early Warning. So revisiting that field of practice and literature almost 10 years later was quite a thrill given all the technological innovations that have occurred since. At the same time, plus ça change, plus c’est la même chose. The classic “warning-response gap” does not magically disappear with the rise of Big Data. This gap points to the fact that information does not equal action. Response is political. And while evidence may be plentiful, that still does not translate into action. This explains the shift towards people-centered approaches to early warning and response. The purpose of people-centered solutions is to directly empower at-risk communities to get out of harm’s way. Capacity for self-organization is what drives resilience. This means that unless Big Data facilitates disaster preparedness at the community level and real-time self-organization during disasters, the promise of Big Data for Conflict Prevention will remain largely an academic discussion.

Take the 2011 Somalia Famine, for example. “Did, in fact, the famine occur because data from this conflict-affected country were just not available and the famine was impossible to predict? Would more data have driven a better decision making process that could have averted disaster? Unfortunately, this does not appear to be the case. There had, in fact, been eleven months of escalating warnings emanating from the famine early warning systems that monitor Somalia. Somalia was, at the time, one of the most frequently surveyed countries in the world, with detailed data available on malnutrition prevalence, mortality rates, and many other indicators. The evolution of the famine was reported in almost real time, yet there was no adequate scaling up of humanitarian intervention until too late” (1). Our study on Big Data for Conflict Prevention is upfront about these limitations, which explains why a people-centered approach to Big Data is pivotal for the latter is to have meaningful impact on the prevention of violent conflict.

We look forward to your feedback and the conversations that ensue. The suggested hashtag is #ipinst. This thought piece is meant to catalyze a conversation, so your input is important to help crystalize the opportunities and challenges of leveraging Big Data for Conflict Prevention.

bio

See also:

  • How to Create Resilience Through Big Data [Link]

PeaceTXT Kenya: Since Wars Begin in Minds of Men


“Since wars begin in the minds of men, it is in the minds of men that the defenses of peace must be constructed.” – 
UNESCO Constitution, 1945

Today, in Kenya, PeaceTXT is building the defenses of peace out of text messages (SMS). As The New York Times explains, PeaceTXT is developing a “text messaging service that sends out blasts of pro-peace messages to specific areas when trouble is brewing.” Launched by PopTech in partnership with the Kenyan NGO Sisi ni Amani (We are Peace), the Kenyan implementation of PeaceTXT uses mobile advertising to market peace and change men’s behaviors.

Conflicts are often grounded in the stories and narratives that people tell them-selves and in the emotions that these stories evoke. Narratives shape identity and the social construct of reality—we interpret our lives through stories. These have the power to transform or infect relationships and communities. As US-based PeaceTXT partner CureViolence (formerly CeaseFire) has clearly shown, violence propagates in much the same way as infectious diseases do. The good news is that we already know how to treat the later: by blocking transmission and treating the infected. This is precisely the approach taken by CureViolence to successfully prevent violence on the streets of Chicago, Baghdad and elsewhere.

The challenge? CureViolence cannot be everywhere at the same time. But the “Crowd” is always there and where the crowd goes, mobile phones often follow. PeaceTXT leverages this new reality by threading a social narrative of peace using mobile messages. Empirical research in public health (and mobile adver-tising) clearly demonstrates that mobile messages & reminders can change behaviors. Given that conflicts are often grounded in the narratives that people tell themselves, we believe that mobile messaging may also influence conflict behavior and possibly prevent the widespread transmission of violent mindsets.

To test this hypothesis, PopTech partnered with Sisi ni Amani in 2011 to pilot and assess the use of mobile messaging for violence interruption and prevention since SNA-K had already been using mobile messaging for almost three years to promote peace, raise awareness about civic rights and encourage recourse to legal instruments for dispute resolution. During the twelve months leading up to today’s Presidential Elections, the Kenyan NGO Sisi ni Amani (SNA-K) has worked with PopTech and PeaceTXT partners (Medic Mobile, QCRI, Ushahidi & CureViolence) to identify the causes of peace in some of the country’s most conflict-prone communities. Since wars begin in the minds of men, SNA-K has held dozens of focus groups in many local communities to better understand the kinds of messaging that might make would-be perpetrators think twice before committing violence. Focus group participants also discussed the kinds of messaging needed to counter rumors. Working with Ogilvy, a global public relations agency with expertise in social marketing, SNA-K subsequently codified the hundreds of messages developed by the local communities to produce a set of guidelines for SNA-K staff to follow. These guidelines describe what types of messages to send to whom, where and when depending on the kinds of tensions being reported.

In addition to organizing these important focus groups, SNA-K literally went door-to-door in Kenya’s most conflict-prone communities to talk with residents about PeaceTXT and invite them to subscribe to SNA-Ks free SMS service. Today, SNA-K boasts over 60,000 SMS subscribers across the country. Thanks to Safaricom, the region’s largest mobile operator, SNA-K will be able to send out 50 million text messages completely for free, which will significantly boost the NGO’s mobile reach during today’s elections. And thanks to SNA-K’s customized mobile messaging platform built by the Praekelt Foundation, the Kenyan NGO can target specific SMS’s to individual subscribers based on their location, gender and demographics. In sum, as CNN explains, “the intervention combines targeted SMS with intensive on-the-ground work by existing peace builders and community leaders to target potential flashpoints of violence.” 

The partnership with Pop-Tech enabled SNA-K to scale thanks to the new funding and strategic partnerships provided by PopTech. Today, PeaceTXT and Sisi ni Amani have already had positive impact in the lead up to today’s important elections. For example, a volatile situation in Dandora recently led to the stabbing of several individuals, which could have resulted in a serious escalation of violence. So SNA-K sent the following SMS: 

Screen Shot 2013-03-03 at 4.34.44 PM 

“Tu dumisha amani!” means “Lets keep the peace!” SNA-K’s local coordinator in Dandore spoke with a number of emotionally distraught and (initially) very angry individuals in the area who said they had been ready to mobilizing and take revenge. But, as they later explained, the SMS sent out by SNA-K made them think twice. They discussed the situation and decided that more violence wouldn’t bring their friend back and would only bring more violence. They chose to resolve the volatile situation through mediation instead.

In Sagamian, recent tensions over land issues resulted in an outbreak of violence. So SNA-K sent the following message:

Screen Shot 2013-03-03 at 4.37.48 PM 

Those involved in the fighting subsequently left the area, telling SNA-K that they had decided not to fight after receiving the SMS. What’s more, they even requested that additional messages to be sent. Sisi ni Amani has collected dozens of such testimonials, which suggest that PeaceTXT is indeed having an impact. Historian Geoffrey Blainey once wrote that “for every thousand pages on the causes of war, there is less than one page directly on the causes of peace.” Today, the PeaceTXT Kenya & SNAK partnership is making sure that for every one SMS that may incite violence, a thousand messages of peace, calm and solidarity will follow to change the minds of men. Tudumishe amani!

bio

Cross-posted on PopTech blog.

How to Create Resilience Through Big Data

Revised! I have edited this article several dozen times since posting the initial draft. I have also made a number of substantial changes to the flow of the article after discovering new connections, synergies and insights. In addition, I  have greatly benefited from reader feedback as well as the very rich conversa-tions that took place during the PopTech & Rockefeller workshop—a warm thank you to all participants for their important questions and feedback!

Introduction

I’ve been invited by PopTech and the Rockefeller Foundation to give the opening remarks at an upcoming event on interdisciplinary dimensions of resilience, which is  being hosted at Georgetown University. This event is connected to their new program focus on “Creating Resilience Through Big Data.” I’m absolutely de-lighted to be involved and am very much looking forward to the conversations. The purpose of this blog post is to summarize the presentation I intend to give and to solicit feedback from readers. So please feel free to use the comments section below to share your thoughts. My focus is primarily on disaster resilience. Why? Because understanding how to bolster resilience to extreme events will provide insights on how to also manage less extreme events, while the converse may not be true.

Big Data Resilience

terminology

One of the guiding questions for the meeting is this: “How do you understand resilience conceptually at present?” First, discourse matters.  The term resilience is important because it focuses not on us, the development and disaster response community, but rather on local at-risk communities. While “vulnerability” and “fragility” were used in past discourse, these terms focus on the negative and seem to invoke the need for external protection, overlooking the fact that many local coping mechanisms do exist. From the perspective of this top-down approach, international organizations are the rescuers and aid does not arrive until these institutions mobilize.

In contrast, the term resilience suggests radical self-sufficiency, and self-sufficiency implies a degree of autonomy; self-dependence rather than depen-dence on an external entity that may or may not arrive, that may or may not be effective, and that may or may not stay the course. The term “antifragile” just recently introduced by Nassim Taleb also appeals to me. Antifragile sys-tems thrive on disruption. But lets stick with the term resilience as anti-fragility will be the subject of a future blog post, i.e., I first need to finish reading Nassim’s book! I personally subscribe to the following definition of resilience: the capacity for self-organization; and shall expand on this shortly.

(See the Epilogue at the end of this blog post on political versus technical defini-tions of resilience and the role of the so-called “expert”. And keep in mind that poverty, cancer, terrorism etc., are also resilient systems. Hint: we have much to learn from pernicious resilience and the organizational & collective action models that render those systems so resilient. In their book on resilience, Andrew Zolli and Ann Marie Healy note the strong similarities between Al-Qaeda & tuber-culosis, one of which are the two systems’ ability to regulate their metabolism).

Hazards vs Disasters

In the meantime, I first began to study the notion of resilience from the context of complex systems and in particular the field of ecology, which defines resilience as “the capacity of an ecosystem to respond to a perturbation or disturbance by resisting damage and recovering quickly.” Now lets unpack this notion of perturbation. There is a subtle but fundamental difference between disasters (processes) and hazards (events); a distinction that Jean-Jacques Rousseau first articulated in 1755 when Portugal was shaken by an earthquake. In a letter to Voltaire one year later, Rousseau notes that, “nature had not built [process] the houses which collapsed and suggested that Lisbon’s high population density [process] contributed to the toll” (1). In other words, natural events are hazards and exogenous while disas-ters are the result of endogenous social processes. As Rousseau added in his note to Voltaire, “an earthquake occurring in wilderness would not be important to society” (2). That is, a hazard need not turn to disaster since the latter is strictly a product or calculus of social processes (structural violence).

And so, while disasters were traditionally perceived as “sudden and short lived events, there is now a tendency to look upon disasters in African countries in particular, as continuous processes of gradual deterioration and growing vulnerability,” which has important “implications on the way the response to disasters ought to be made” (3). (Strictly speaking, the technical difference between events and processes is one of scale, both temporal and spatial, but that need not distract us here). This shift towards disasters as processes is particularly profound for the creation of resilience, not least through Big Data. To under-stand why requires a basic introduction to complex systems.

complex systems

All complex systems tend to veer towards critical change. This is explained by the process of Self-Organized Criticality (SEO). Over time, non-equilibrium systems with extended degrees of freedom and a high level of nonlinearity become in-creasingly vulnerable to collapse. Social, economic and political systems certainly qualify as complex systems. As my “alma mater” the Santa Fe Institute (SFI) notes, “The archetype of a self-organized critical system is a sand pile. Sand is slowly dropped onto a surface, forming a pile. As the pile grows, avalanches occur which carry sand from the top to the bottom of the pile” (4). That is, the sand pile becomes increasingly unstable over time.

Consider an hourglass or sand clock as an illustration of self-organized criticality. Grains of sand sifting through the narrowest point of the hourglass represent individual events or natural hazards. Over time a sand pile starts to form. How this process unfolds depends on how society chooses to manage risk. A laisser-faire attitude will result in a steeper pile. And grain of sand falling on an in-creasingly steeper pile will eventually trigger an avalanche. Disaster ensues.

Why does the avalanche occur? One might ascribe the cause of the avalanche to that one grain of sand, i.e., a single event. On the other hand, a complex systems approach to resilience would associate the avalanche with the pile’s increasing slope, a historical process which renders the structure increasingly vulnerable to falling grains. From this perspective, “all disasters are slow onset when realisti-cally and locally related to conditions of susceptibility”. A hazard event might be rapid-onset, but the disaster, requiring much more than a hazard, is a long-term process, not a one-off event. The resilience of a given system is therefore not simply dependent on the outcome of future events. Resilience is the complex product of past social, political, economic and even cultural processes.

dealing with avalanches

Scholars like Thomas Homer-Dixon argue that we are becoming increasingly prone to domino effects or cascading changes across systems, thus increasing the likelihood of total synchronous failure. “A long view of human history reveals not regular change but spasmodic, catastrophic disruptions followed by long periods of reinvention and development.” We must therefore “reduce as much as we can the force of the underlying tectonic stresses in order to lower the risk of synchro-nous failure—that is, of catastrophic collapse that cascades across boundaries between technological, social and ecological systems” (5).

Unlike the clock’s lifeless grains of sand, human beings can adapt and maximize their resilience to exogenous shocks through disaster preparedness, mitigation and adaptation—which all require political will. As a colleague of mine recently noted, “I wish it were widely spread amongst society  how important being a grain of sand can be.” Individuals can “flatten” the structure of the sand pile into a less hierarchical but more resilience system, thereby distributing and diffusing the risk and size of an avalanche. Call it distributed adaptation.

operationalizing resilience

As already, the field of ecology defines  resilience as “the capacity of an ecosystem to respond to a perturbation or disturbance by resisting damage and recovering quickly.” Using this understanding of resilience, there are at least 2 ways create more resilient “social ecosystems”:

  1. Resist damage by absorbing and dampening the perturbation.
  2. Recover quickly by bouncing back or rather forward.

Resisting Damage

So how does a society resist damage from a disaster? As hinted earlier, there is no such thing as a “natural” disaster. There are natural hazards and there are social systems. If social systems are not sufficiently resilient to absorb the impact of a natural hazard such as an earthquake, then disaster unfolds. In other words, hazards are exogenous while disasters are the result of endogenous political, economic, social and cultural processes. Indeed, “it is generally accepted among environmental geographers that there is no such thing as a natural disaster. In every phase and aspect of a disaster—causes, vulnerability, preparedness, results and response, and reconstruction—the contours of disaster and the difference between who lives and dies is to a greater or lesser extent a social calculus” (6).

So how do we apply this understanding of disasters and build more resilient communities? Focusing on people-centered early warning systems is one way to do this. In 2006, the UN’s International Strategy for Disaster Reduction (ISDR) recognized that top-down early warning systems for disaster response were increasingly ineffective. They thus called for a more bottom-up approach in the form of people-centered early warning systems. The UN ISDR’s Global Survey of Early Warning Systems (PDF), defines the purpose of people-centered early warning systems as follows:

“… to empower individuals and communities threatened by hazards to act in sufficient time and in an appropriate manner so as to reduce the possibility of personal injury, loss of life, damage to property and the environment, and loss of livelihoods.”

Information plays a central role here. Acting in sufficient time requires having timely information about (1) the hazard/s, (2) our resilience and (3) how to respond. This is where information and communication technologies (ICTs), social media and Big Data play an important role. Take the latter, for example. One reason for the considerable interest in Big Data is prediction and anomaly detection. Weather and climatic sensors provide meteorologists with the copious amounts of data necessary for the timely prediction of weather patterns and  early detection of atmospheric hazards. In other words, Big Data Analytics can be used to anticipate the falling grains of sand.

Now, predictions are often not correct. But the analysis of Big Data can also help us characterize the sand pile itself, i.e., our resilience, along with the associated trends towards self-organized criticality. Recall that complex systems tend towards instability over time (think of the hourglass above). Thanks to ICTs, social media and Big Data, we now have the opportunity to better characterize in real-time the social, economic and political processes driving our sand pile. Now, this doesn’t mean that we have a perfect picture of the road to collapse; simply that our picture is clearer than ever before in human history. In other words, we can better measure our own resilience. Think of it as the Quantified Self move-ment applied to an entirely different scale, that of societies and cities. The point is that Big Data can provide us with more real-time feedback loops than ever before. And as scholars of complex systems know, feedback loops are critical for adaptation and change. Thanks to social media, these loops also include peer-to-peer feedback loops.

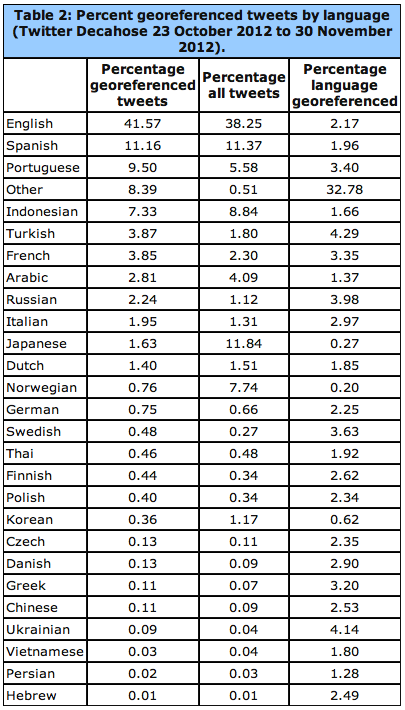
An example of monitoring resilience in real-time (and potentially anticipating future changes in resilience) is the UN Global Pulse’s project on food security in Indonesia. They partnered with Crimson Hexagon to forecast food prices in Indonesia by analyzing tweets referring to the price of rice. They found an inter-esting relationship between said tweets and government statistics on food price inflation. Some have described the rise of social media as a new nervous system for the planet, capturing the pulse of our social systems. My colleagues and I at QCRI are therefore in the process of appling this approach to the study of the Arabic Twittersphere. Incidentally, this is yet another critical reason why Open Data is so important (check out the work of OpenDRI, Open Data for Resilience Initiative. See also this post on Demo-cratizing ICT for Development with DIY Innovation and Open Data). More on open data and data philanthropy in the conclusion.

Finally, new technologies can also provide guidance on how to respond. Think of Foursquare but applied to disaster response. Instead of “Break Glass in Case of Emergency,” how about “Check-In in Case of Emergency”? Numerous smart-phone apps such as Waze already provide this kind of at-a-glance, real-time situational awareness. It is only a matter of time until humanitarian organiza-tions develop disaster response apps that will enable disaster-affected commu-nities to check-in for real time guidance on what to do given their current location and level of resilience. Several disaster preparedness apps already exist. Social computing and Big Data Analytics can power these apps in real-time.

Quick Recovery

As already noted, there are at least two ways create more resilient “social eco-systems”. We just discussed the first: resisting damage by absorbing and dam-pening the perturbation.  The second way to grow more resilient societies is by enabling them to rapidly recover following a disaster.

As Manyena writes, “increasing attention is now paid to the capacity of disaster-affected communities to ‘bounce back’ or to recover with little or no external assistance following a disaster.” So what factors accelerate recovery in eco-systems in general? In ecological terms, how quickly the damaged part of an ecosystem can repair itself depends on how many feedback loops it has to the non- (or less-) damaged parts of the ecosystem(s). These feedback loops are what enable adaptation and recovery. In social ecosystems, these feedback loops can be comprised of information in addition to the transfer of tangible resources.  As some scholars have argued, a disaster is first of all “a crisis in communicating within a community—that is, a difficulty for someone to get informed and to inform other people” (7).

Improving ways for local communities to communicate internally and externally is thus an important part of building more resilient societies. Indeed, as Homer-Dixon notes, “the part of the system that has been damaged recovers by drawing resources and information from undamaged parts.” Identifying needs following a disaster and matching them to available resources is an important part of the process. Indeed, accelerating the rate of (1) identification; (2) matching and, (3) allocation, are important ways to speed up overall recovery.

This explains why ICTs, social media and Big Data are central to growing more resilient societies. They can accelerate impact evaluations and needs assessments at the local level. Population displacement following disasters poses a serious public health risk. So rapidly identifying these risks can help affected populations recover more quickly. Take the work carried out by my colleagues at Flowminder, for example. They  empirically demonstrated that mobile phone data (Big Data!) can be used to predict population displacement after major disasters. Take also this study which analyzed call dynamics to demonstrate that telecommunications data could be used to rapidly assess the impact of earthquakes. A related study showed similar results when analyzing SMS’s and building damage Haiti after the 2010 earthquake.

haiti_overview_570

Resilience as Self-Organization and Emergence

Connection technologies such as mobile phones allow individual “grains of sand” in our societal “sand pile” to make necessary connections and decisions to self-organize and rapidly recover from disasters. With appropriate incentives, pre-paredness measures and policies, these local decisions can render a complex system more resilient. At the core here is behavior change and thus the importance of understanding behavior change models. Recall  also Thomas Schelling’s observation that micro-motives can lead to macro-behavior. To be sure, as Thomas Homer-Dixon rightly notes, “Resilience is an emergent property of a system—it’s not a result of any one of the system’s parts but of the synergy between all of its parts.  So as a rough and ready rule, boosting the ability of each part to take care of itself in a crisis boosts overall resilience.” (For complexity science readers, the notions of transforma-tion through phase transitions is relevant to this discussion).

In other words, “Resilience is the capacity of the affected community to self-organize, learn from and vigorously recover from adverse situations stronger than it was before” (8). This link between resilience and capacity for self-organization is very important, which explains why a recent and major evaluation of the 2010 Haiti Earthquake disaster response promotes the “attainment of self-sufficiency, rather than the ongoing dependency on standard humanitarian assistance.” Indeed, “focus groups indicated that solutions to help people help themselves were desired.”

The fact of the matter is that we are not all affected in the same way during a disaster. (Recall the distinction between hazards and disasters discussed earlier). Those of use who are less affected almost always want to help those in need. Herein lies the critical role of peer-to-peer feedback loops. To be sure, the speed at which the damaged part of an ecosystem can repair itself depends on how many feedback loops it has to the non- (or less-) damaged parts of the eco-system(s). These feedback loops are what enable adaptation and recovery.

Lastly, disaster response professionals cannot be every where at the same time. But the crowd is always there. Moreover, the vast majority of survivals following major disasters cannot be attributed to external aid. One study estimates that at most 10% of external aid contributes to saving lives. Why? Because the real first responders are the disaster-affected communities themselves, the local popula-tion. That is, the real first feedback loops are always local. This dynamic of mutual-aid facilitated by social media is certainly not new, however. My colleagues in Russia did this back in 2010 during the major forest fires that ravaged their country.

While I do have a bias towards people-centered interventions, this does not mean that I discount the importance of feedback loops to external actors such as traditional institutions and humanitarian organizations. I also don’t mean to romanticize the notion of “indigenous technical knowledge” or local coping mechanism. Some violate my own definition of human rights, for example. However, my bias stems from the fact that I am particularly interested in disaster resilience within the context of areas of limited statehood where said institutions and organizations are either absent are ineffective. But I certainly recognize the importance of scale jumping, particularly within the context of social capital and social media.

RESILIENCE THROUGH SOCIAL CAPITAL

Information-based feedback loops general social capital, and the latter has been shown to improve disaster resilience and recovery. In his recent book entitled “Building Resilience: Social Capital in Post-Disaster Recovery,” Daniel Aldrich draws on both qualitative and quantitative evidence to demonstrate that “social resources, at least as much as material ones, prove to be the foundation for resilience and recovery.” His case studies suggest that social capital is more important for disaster resilience than physical and financial capital, and more important than conventional explanations. So the question that naturally follows given our interest in resilience & technology is this: can social media (which is not restricted by geography) influence social capital?

Social Capital

Building on Daniel’s research and my own direct experience in digital humani-tarian response, I argue that social media does indeed nurture social capital during disasters. “By providing norms, information, and trust, denser social networks can implement a faster recovery.” Such norms also evolve on Twitter, as does information sharing and trust building. Indeed, “social ties can serve as informal insurance, providing victims with information, financial help and physical assistance.” This informal insurance, “or mutual assistance involves friends and neighbors providing each other with information, tools, living space, and other help.” Again, this bonding is not limited to offline dynamics but occurs also within and across online social networks. Recall the sand pile analogy. Social capital facilitates the transformation of the sand pile away (temporarily) from self-organized criticality. On a related note vis-a-vis open source software, “the least important part of open source software is the code.” Indeed, more important than the code is the fact that open source fosters social ties, networks, communities and thus social capital.

(Incidentally, social capital generated during disasters is social capital that can subsequently be used to facilitate self-organization for non-violent civil resistance and vice versa).

RESILIENCE through big data

My empirical research on tweets posted during disasters clearly shows that while many use twitter (and social media more generally) to post needs during a crisis, those who are less affected in the social ecosystem will often post offers to help. So where does Big Data fit into this particular equation? When disaster strikes, access to information is equally important as access to food and water. This link between information, disaster response and aid was officially recognized by the Secretary General of the International Federation of Red Cross & Red Crescent Societies in the World Disasters Report published in 2005. Since then, disaster-affected populations have become increasingly digital thanks to the very rapid and widespread adoption of mobile technologies. Indeed, as a result of these mobile technologies, affected populations are increasingly able to source, share and generate a vast amount of information, which is completely transforming disaster response.

In other words, disaster-affected communities are increasingly becoming the source of Big (Crisis) Data during and following major disasters. There were over 20 million tweets posted during Hurricane Sandy. And when the major earth-quake and Tsunami hit Japan in early 2011, over 5,000 tweets were being posted every secondThat is 1.5 million tweets every 5 minutes. So how can Big Data Analytics create more resilience in this respect? More specifically, how can Big Data Analytics accelerate disaster recovery? Manually monitoring millions of tweets per minute is hardly feasible. This explains why I often “joke” that we need a local Match.com for rapid disaster recovery. Thanks to social computing, artifi-cial intelligence, machine learning and Big Data Analytics, we can absolutely develop a “Match.com” for rapid recovery. In fact, I’m working on just such a project with my colleagues at QCRI. We are also developing algorithms to auto-matically identify informative and actionable information shared on Twitter, for example. (Incidentally, a by-product of developing a robust Match.com for disaster response could very well be an increase in social capital).

There are several other ways that advanced computing can create disaster resilience using Big Data. One major challenge is digital humanitarian response is the verification of crowdsourced, user-generated content. Indeed, misinforma-tion and rumors can be highly damaging. If access to information is tantamount to food access as noted by the Red Cross, then misinformation is like poisoned food. But Big Data Analytics has already shed some light on how to develop potential solutions. As it turns out, non-credible disaster information shared on Twitter propagates differently than credible information, which means that the credibility of tweets could be predicted automatically.

Conclusion

In sum, “resilience is the critical link between disaster and development; monitoring it [in real-time] will ensure that relief efforts are supporting, and not eroding […] community capabilities” (9). While the focus of this blog post has been on disaster resilience, I believe the insights provided are equally informa-tive for less extreme events.  So I’d like to end on two major points. The first has to do with data philanthropy while the second emphasizes the critical importance of failing gracefully.

Big Data is Closed and Centralized

A considerable amount of “Big Data” is Big Closed and Centralized Data. Flow-minder’s study mentioned above draws on highly proprietary telecommunica-tions data. Facebook data, which has immense potential for humanitarian response, is also closed. The same is true of Twitter data, unless you have millions of dollars to pay for access to the full Firehose, or even Decahose. While access to the Twitter API is free, the number of tweets that can be downloaded and analyzed is limited to several thousand a day. Contrast this with the 5,000 tweets per second posted after the earthquake and Tsunami in Japan. We therefore need some serious political will from the corporate sector to engage in “data philanthropy”. Data philanthropy involves companies sharing proprietary datasets for social good. Call it Corporate Social Responsibility (CRS) for digital humanitarian response. More here on how this would work.

Failing Gracefully

Lastly, on failure. As noted, complex systems tend towards instability, i.e., self-organized criticality, which is why Homer-Dixon introduces the notion of failing gracefully. “Somehow we have to find the middle ground between dangerous rigidity and catastrophic collapse.” He adds that:

“In our organizations, social and political systems, and individual lives, we need to create the possibility for what computer programmers and disaster planners call ‘graceful’ failure. When a system fails gracefully, damage is limited, and options for recovery are preserved. Also, the part of the system that has been damaged recovers by drawing resources and information from undamaged parts.” Homer-Dixon explains that “breakdown is something that human social systems must go through to adapt successfully to changing conditions over the long term. But if we want to have any control over our direction in breakdown’s aftermath, we must keep breakdown constrained. Reducing as much as we can the force of underlying tectonic stresses helps, as does making our societies more resilient. We have to do other things too, and advance planning for breakdown is undoubtedly the most important.”

As Louis Pasteur famously noted, “Chance favors the prepared mind.” Preparing for breakdown is not defeatist or passive. Quite on the contrary, it is wise and pro-active. Our hubris—including our current infatuation with Bid Data—all too often clouds our better judgment. Like Macbeth, rarely do we seriously ask our-selves what we would do “if we should fail.” The answer “then we fail” is an option. But are we truly prepared to live with the devastating consequences of total synchronous failure?

In closing, some lingering (less rhetorical) questions:

  • How can resilience can be measured? Is there a lowest common denominator? What is the “atom” of resilience?
  • What are the triggers of resilience, creative capacity, local improvisation, regenerative capacity? Can these be monitored?
  • Where do the concepts of “lived reality” and “positive deviance” enter the conversation on resilience?
  • Is resiliency a right? Do we bear a responsibility to render systems more resilient? If so, recalling that resilience is the capacity to self-organize, do local communities have the right to self-organize? And how does this differ from democratic ideals and freedoms?
  • Recent research in social-psychology has demonstrated that mindfulness is an amplifier of resilience for individuals? How can be scaled up? Do cultures and religions play a role here?
  • Collective memory influences resilience. How can this be leveraged to catalyze more regenerative social systems?

bio

Epilogue: Some colleagues have rightfully pointed out that resilience is ultima-tely political. I certainly share that view, which is why this point came up in recent conversations with my PopTech colleagues Andrew Zolli & Leetha Filderman. Readers of my post will also have noted my emphasis on distinguishing between hazards and disasters; that the latter are the product of social, economic and political processes. As noted in my blog post, there are no natural disastersTo this end, some academics rightly warn that “Resilience is a very technical, neutral, apolitical term. It was initially designed to characterize systems, and it doesn’t address power, equity or agency…  Also, strengthening resilience is not free—you can have some winners and some losers.”

As it turns out, I have a lot say about the political versus technical argument. First of all, this is hardly a new or original argument but nevertheless an important one. Amartya Senn discussed this issue within the context of famines decades ago, noting that famines do not take place in democracies. In 1997, Alex de Waal published his seminal book, “Famine Crimes: Politics and the Disaster Relief In-dustry in Africa.” As he rightly notes, “Fighting famine is both a technical and political challenge.” Unfortunately, “one universal tendency stands out: technical solutions are promoted at the expense of political ones.” There is also a tendency to overlook the politics of technical actions, muddle or cover political actions with technical ones, or worse, to use technical measures as an excuse not to undertake needed political action.

De Waal argues that the use of the term “governance” was “an attempt to avoid making the political critique too explicit, and to enable a focus on specific technical aspects of government.” In some evaluations of development and humanitarian projects, “a caveat is sometimes inserted stating that politics lies beyond the scope of this study.” To this end, “there is often a weak call for ‘political will’ to bridge the gap between knowledge of technical measures and action to implement them.” As de Waal rightly notes, “the problem is not a ‘missing link’ but rather an entire political tradition, one manifestation of which is contemporary international humanitarianism.” In sum, “technical ‘solutions’ must be seen in the political context, and politics itself in the light of the domi-nance of a technocratic approach to problems such as famine.”

From a paper I presented back in 2007: “the technological approach almost always serves those who seek control from a distance.” As a result of this technological drive for pole position, a related “concern exists due to the separation of risk evaluation and risk reduction between science and political decision” so that which is inherently politically complex becomes depoliticized and mechanized. In Toward a Rational Society (1970), the German philosopher Jürgen Habermas describes “the colonization of the public sphere through the use of instrumental technical rationality. In this sphere, complex social problems are reduced to technical questions, effectively removing the plurality of contending perspectives.”

To be sure, Western science tends to pose the question “How?” as opposed to “Why?”What happens then is that “early warning systems tend to be largely conceived as hazard-focused, linear, topdown, expert driven systems, with little or no engagement of end-users or their representatives.” As De Waal rightly notes, “the technical sophistication of early warning systems is offset by a major flaw: response cannot be enforced by the populace. The early warning information is not normally made public.”  In other words, disaster prevention requires “not merely identifying causes and testing policy instruments but building a [social and] political movement” since “the framework for response is inherently political, and the task of advocacy for such response cannot be separated from the analytical tasks of warning.”

Recall my emphasis on people-centered early warning above and the definition of resilience as capacity for self-organization. Self-organization is political. Hence my efforts to promote greater linkages between the fields of nonviolent action and early warning years ago. I have a paper (dated 2008) specifically on this topic should anyone care to read. Anyone who has read my doctoral dissertation will also know that I have long been interested in the impact of technology on the balance of power in political contexts. A relevant summary is available here. Now, why did I not include all this in the main body of my blog post? Because this updated section already runs over 1,000 words.

In closing, I disagree with the over-used criticism that resilience is reactive and about returning to initial conditions. Why would we want to be reactive or return to initial conditions if the latter state contributed to the subsequent disaster we are recovering from? When my colleague Andrew Zolli talks about resilience, he talks about “bouncing forward”, not bouncing back. This is also true of Nassim Taleb’s term antifragility, the ability to thrive on disruption. As Homer-Dixon also notes, preparing to fail gracefully is hardly reactive either.

From Crowdsourcing Crisis Information to Crowdseeding Conflict Zones (Updated)

Friends Peter van der Windt and Gregory Asmolov are two of the sharpest minds I know when it comes to crowdsourcing crisis information and crisis response. So it was a real treat to catch up with them in Berlin this past weekend during the “ICTs in Limited Statehood” workshop. An edited book of the same title is due out next year and promises to be an absolute must-read for all interested in the impact of Information and Communication Technologies (ICTs) on politics, crises and development.

I blogged about Gregory’s presentation following last year’s workshop, so this year I’ll relay Peter’s talk on research design and methodology vis-a-vis the collection of security incidents in conflict environments using SMS. Peter and mentor Macartan Humphreys completed their Voix des Kivus project in the DRC last year, which ran for just over 16 months. During this time, they received 4,783 text messages on security incidents using the FrontlineSMS platform. These messages were triaged and rerouted to several NGOs in the Kivus as well as the UN Mission there, MONUSCO.

How did they collect this information in the first place? Well, they considered crowdsourcing but quickly realized this was the wrong methodology for their project, which was to assess the impact of a major conflict mitigation program in the region. (Relaying text messages to various actors on the ground was not initially part of the plan). They needed high-quality, reliable, timely, regular and representative conflict event-data for their monitoring and evaluation project. Crowdsourcing is obviously not always the most appropriate methodology for the collection of information—as explained in this blog post.

Peter explained the pro’s and con’s of using crowdsourcing by sharing the framework above. “Knowledge” refers to the fact that only those who have knowledge of a given crowdsourcing project will know that participating is even an option. “Means” denotes whether or not an individual has the ability to participate. One would typically need access to a mobile phone and enough credit to send text messages to Voix des Kivus. In the case of the DRC, the size of subset “D” (no knowledge / no means) would easily dwarf the number of individuals comprising subset “A” (knowledge / means). In Peter’s own words:

“Crowdseeding brings the population (the crowd) from only A (what you get with crowdsourcing) to A+B+C+D: because you give phones&credit and you go to and inform the phoneholds about the project. So the crowd increases from A to A+B+C+D. And then from A+B+C+D one takes a representative sample. So two important benefits. And then a third: the relationship with the phone holder: stronger incentive to tell the truth, and no bad people hacking into the system.”

In sum, Peter and Macartan devised the concept of “crowdseeding” to increase the crowd and render that subset a representative sample of the overall population. In addition, the crowdseeding methodology they developed genera-ted more reliable information than crowdsourcing would have and did so in a way that was safer and more sustainable.

Peter traveled to 18 villages across the Kivus and in each identified three representatives to serve as the eyes and years of the village. These representatives were selected in collaboration with the elders and always included a female representative. They were each given a mobile phone and received extensive training. A code book was also shared which codified different types of security incidents. That way, the reps simply had to type the number corresponding to a given incident (or several numbers if more than one incident had taken place). Anyone in the village could approach these reps with relevant information which would then be texted to Peter and Macartan.

The table above is the first page of the codebook. Note that the numerous security risks of doing this SMS reporting were discussed at length with each community before embarking on the selection of 3 village reps. Each community decided to voted to participate despite the risks. Interestingly, not a single village voted against launching the project. However, Peter and Macartan chose not to scale the project beyond 18 villages for fear that it would get the attention of the militias operating in the region.

A local field representative would travel to the villages every two weeks or so to individually review the text messages sent out by each representative and to verify whether these incidents had actually taken place by asking others in the village for confirmation. The fact that there were 3 representatives per village also made the triangulation of some text messages possible. Because the 18 villages were randomly selected as part the randomized control trial (RCT) for the monitoring and evaluation project, the text messages were relaying a representative sample of information.

But what was the incentive? Why did a total of 54 village representatives from 18 villages send thousands of text messages to Voix des Kivus over a year and a half? On the financial side, Peter and Macartan devised an automated way to reimburse the cost of each text message sent on a monthly basis and in addition provided an additional $1.5/month. The only ask they made of the reps was that each had to send at least one text message per week, even if that message had the code 00 which referred to “no security incident”.

The figure above depicts the number of text messages received throughout the project, which formally ended in January 2011. In Peter’s own words:

“We gave $20 at the end to say thanks but also to learn a particular thing. During the project we heard often: ‘How important is that weekly $1.5?’ ‘Would people still send messages if you only reimburse them for their sent messages (and stop giving them the weekly $1.5)?’ So at the end of the project […] we gave the phone holder $20 and told them: the project continues exactly the same, the only difference is we can no longer send you the $1.5. We will still reimburse you for the sent messages, we will still share the bulletins, etc. While some phone holders kept on sending textmessages, most stopped. In other words, the financial incentive of $1.5 (in the form of phonecredit) was important.”

Peter and Macartan have learned a lot during this project, and I urge colleagues interested in applying their project to get in touch with them–I’m happy to provide an email introduction. I wish Swisspeace’s Early Warning System (FAST) had adopted this methodology before running out of funding several years ago. But the leadership at the time was perhaps not forward thinking enough. I’m not sure whether the Conflict Early Warning and Response Network (CEWARN) in the Horn has fared any better vis-a-vis demonstrated impact or lack thereof.

To learn more about crowdsourcing as a methodology for information collection, I recommend the following three articles:

How Can Innovative Technology Make Conflict Prevention More Effective?

I’ve been asked to participate in an expert working group in support of a research project launched by the International Peace Institute (IPI) on new technologies for conflict prevention. Both UNDP and USAID are also partners in this effort. To this end, I’ve been invited to make some introductory remarks during our upcoming working group meeting. The purpose of this blog post is to share my preliminary thoughts on this research and provide some initial suggestions.

Before I launch into said thoughts, some context may be in order. I spent several years studying, launching and improving conflict early warning systems for violence prevention. While I haven’t recently blogged about conflict prevention on iRevolution, you’ll find my writings on this topic posted on my other blog, Conflict Early Warning. I have also published and presented several papers on conflict prevention, most of which are available here. The most relevant ones include the following:

  • Meier, Patrick. 2011. Early Warning Systems and the Prevention of Violent Conflict. In Peacebuilding in the Information Age: Sifting Hype from Reality, ed. Daniel Stauffacher et al. GenevaICT4Peace. Available online.
  • Leaning, Jennifer and Patrick Meier. 2009. “The Untapped Potential of Information Communication Technology for Conflict Early Warning and Crisis Mapping,” Working Paper Series, Harvard Humanitarian Initiative (HHI), Harvard University. Available online.
  • Leaning, Jennifer and Patrick Meier. 2008. “Community Based Conflict Early Warning and Response Systems: Opportunities and Challenges.” Working Paper Series, Harvard Humanitarian Initiative (HHI), Harvard University. Available online.
  • Leaning, Jennifer and Patrick Meier. 2008. “Conflict Early Warning and Response: A Critical Reassessment.” Working Paper Series, Harvard Humanitarian Initiative (HHI), Harvard University. Available online.
  • Meier, Patrick. 2008. “Upgrading the Role of Information Communication Technology (ICT) for Tactical Early Warning/Response.” Paper prepared for the 49th Annual Convention of the International Studies Association (ISA) in San Francisco. Available online.
  • Meier, Patrick. 2007. “New Strategies for Effective Early Response: Insights from Complexity Science.” Paper prepared for the 48th Annual Convention of the International Studies Association (ISA) in Chicago.Available online.
  • Campbell, Susanna and Patrick Meier. 2007. “Deciding to Prevent Violent Conflict: Early Warning and Decision-Making at the United Nations.” Paper prepared for the 48th Annual Convention of the International Studies Association (ISA) in Chicago. Available online.
  • Meier, Patrick. 2007. From Disaster to Conflict Early Warning: A People-Centred Approach. Monday Developments 25, no. 4, 12-14. Available online.
  • Meier, Patrick. 2006. “Early Warning for Cowardly Lions: Response in Disaster & Conflict Early Warning Systems.” Unpublished academic paper, The Fletcher SchoolAvailable online.
  • I was also invited to be an official reviewer of this 100+ page workshop summary on “Communication and Technology for Violence Prevention” (PDF), which was just published by the National Academy of Sciences. In addition, I was an official referee for this important OECD report on “Preventing Violence, War and State Collapse: The Future of Conflict Early Warning and Response.”

An obvious first step for IPI’s research would be to identify the conceptual touch-points between the individual functions or components of conflict early warning systems and information & communication technology (ICT). Using this concep-tual framework put forward by ISDR would be a good place to start:

That said, colleagues at IPI should take care not to fall prey to technological determinism. The first order of business should be to understand exactly why previous (and existing) conflict early warning systems are complete failures—a topic I have written extensively about and been particularly vocal on since 2004. Throwing innovative technology at failed systems will not turn them into successful operations. Furthermore, IPI should also take note of the relatively new discourse on people-centered approaches to early warning and distinguish between first, second, third and fourth generation conflict early warning systems.

On this note, IPI ought to focus in particular on third and fourth generation systems vis-a-vis the role of innovative technology. Why? Because first and second generation systems are structured for failure due to constraints explained by organizational theory. They should thus explore the critical importance of conflict preparedness and the role that technology can play in this respect since preparedness is key to the success of third and fourth generation systems. In addition, IPI should consider the implications of crowdsourcing, crisis mapping, Big Data, satellite imagery and the impact that social media analytics might play for the early detection and respons to violent conflict. They should also take care not to ignore critical insights from the field of nonviolent civil resistance vis-a-vis preparedness and tactical approaches to community-based early response. Finally, they should take note of new and experimental initiatives in this space, such as PeaceTXT.

IPI’s plans to write up several case studies on conflict early warning systems to understand how innovative technology might (or already are) making these more effective. I would recommend focusing on specific systems in Kenya, Kyrgyzstan Sri Lanka and Timor-Leste. Note that some community-based systems are too sensitive to make public, such as one in Burma for example. In terms of additional experts worth consulting, I would recommend David Nyheim, Joe Bock, Maria Stephan, Sanjana Hattotuwa, Scott Edwards and Casey Barrs. I would also shy away from inviting too many academics or technology companies. The former tend to focus too much on theory while the latter often have a singular focus on technology.

Many thanks to UNDP for including me in the team of experts. I look forward to the first working group meeting and reviewing IPI’s early drafts. In the meantime, if iRevolution readers have certain examples or questions they’d like me to relay to the working group, please do let me know via the comments section below and I’ll be sure to share.

Behind the Scenes: The Digital Operations Center of the American Red Cross

The Digital Operations Center at the American Red Cross is an important and exciting development. I recently sat down with Wendy Harman to learn more about the initiative and to exchange some lessons learned in this new world of digital  humanitarians. One common challenge in emergency response is scaling. The American Red Cross cannot be everywhere at the same time—and that includes being on social media. More than 4,000 tweets reference the Red Cross on an average day, a figure that skyrockets during disasters. And when crises strike, so does Big Data. The Digital Operations Center is one response to this scaling challenge.

Sponsored by Dell, the Center uses customized software produced by Radian 6 to monitor and analyze social media in real-time. The Center itself sits three people who have access to six customized screens that relate relevant information drawn from various social media channels. The first screen below depicts some of key topical areas that the Red Cross monitors, e.g., references to the American Red Cross, Storms in 2012, and Delivery Services.

Circle sizes in the first screen depict the volume of references related to that topic area. The color coding (red, green and beige) relates to sentiment analysis (beige being neutral). The dashboard with the “speed dials” right underneath the first screen provides more details on the sentiment analysis.

Lets take a closer look at the circles from the first screen. The dots “orbiting” the central icon relate to the categories of key words that the Radian 6 platform parses. You can click on these orbiting dots to “drill down” and view the individual key words that make up that specific category. This circles screen gets updated in near real-time and draws on data from Twitter, Facebook, YouTube, Flickr and blogs. (Note that the distance between the orbiting dots and the center does not represent anything).

An operations center would of course not be complete without a map, so the Red Cross uses two screens to visualize different data on two heat maps. The one below depicts references made on social media platforms vis-a-vis storms that have occurred during the past 3 days.

The screen below the map highlights the bio’s of 50 individual twitter users who have made references to the storms. All this data gets generated from the “Engagement Console” pictured below. The purpose of this web-based tool, which looks a lot like Tweetdeck, is to enable the Red Cross to customize the specific types of information they’re looking form, and to respond accordingly.

Lets look at the Consul more closely. In the Workflow section on the left, users decide what types of tags they’re looking for and can also filter by priority level. They can also specify the type of sentiment they’re looking, e.g., negative feelings vis-a-vis a particular issue. In addition, they can take certain actions in response to each information item. For example, they can reply to a tweet, a Facebook status update, or a blog post; and they can do this directly from the engagement consul. Based on the license that the Red Cross users, up to 25 of their team members can access the Consul and collaborate in real-time when processing the various tweets and Facebook updates.

The Consul also allows users to create customized timelines, charts and wordl graphics to better understand trends changing over time in the social media space. To fully leverage this social media monitoring platform, Wendy and team are also launching a digital volunteers program. The goal is for these volunteers to eventually become the prime users of the Radian platform and to filter the bulk of relevant information in the social media space. This would considerably lighten the load for existing staff. In other words, the volunteer program would help the American Red Cross scale in the social media world we live in.

Wendy plans to set up a dedicated 2-hour training for individuals who want to volunteer online in support of the Digital Operations Center. These trainings will be carried out via Webex and will also be available to existing Red Cross staff.


As  argued in this previous blog post, the launch of this Digital Operations Center is further evidence that the humanitarian space is ready for innovation and that some technology companies are starting to think about how their solutions might be applied for humanitarian purposes. Indeed, it was Dell that first approached the Red Cross with an expressed interest in contributing to the organization’s efforts in disaster response. The initiative also demonstrates that combining automated natural language processing solutions with a digital volunteer net-work seems to be a winning strategy, at least for now.

After listening to Wendy describe the various tools she and her colleagues use as part of the Operations Center, I began to wonder whether these types of tools will eventually become free and easy enough for one person to be her very own operations center. I suppose only time will tell. Until then, I look forward to following the Center’s progress and hope it inspires other emergency response organizations to adopt similar solutions.

Twitcident: Filtering Tweets in Real-Time for Crisis Response

The most recent newcomer to the “tweetsourcing” space comes to us from Delft University of Technology in the Netherlands. Twitcident is a web-based filtering system that extracts crisis information from Twitter in real-time to support emergency response efforts. Dutch emergency services have been testing the platform over the past 10 months and results “show the system to be far more useful than simple keyword searching of a twitter feed” (NewScientist).

Here’s how it works. First the dashboard, which shows current events-of-interest being monitored.

Lets click on “Texas”, which produces the following page. More than 22,000 tweets potentially relate to the actual fire of interest.

This is where the filtering comes in:

The number of relevant tweets is reduced with every applied filter.

Naturally, geo-location is also an optional filter.

Twitcident also allows for various visualization options, including timelines, word clouds and charts.

The system also allows the user to view the filtered tweets on a map. The pictures and videos shared via twitter are also aggregated and viewable on dedicated tabs.

The developers of the platform have not revealed how their algorithms work but will demo the tool at the World Wide Web 2012 conference in France next week. In the meantime, here’s a graphic that summarizes the platform workflow.

I look forward to following Twitcident’s developments. I’d be particularly interested in learning more about how Dutch emergency services have been using the tool and what features they think would improve the platform’s added value.