Category Archives: Big Data

Moving on from WeRobotics, with Gratitude

CDA Photo 1

It is time for a new chapter of WeRobotics to begin. This next stretch of the journey must include more diverse executive leadership. I’m thus stepping down as Executive Director of WeRobotics.* I feel deeply about this personal and professional decision, and didn’t come to it lightly or quickly. Thankfully, the WeRobotics Board has given me their full backing. With this next step, we can continue to walk the talk on diversity, equity, inclusion, localization and shift the power. Equally importantly, this new chapter presents all Flying Labs with a positive opportunity to shape the governance of WeRobotics itself.

Flying Labs are independent, locally-led knowledge hubs that combine local leadership and expertise with emerging technologies to drive positive and sustainable social impact. They’re co-created with WeRobotics but hosted and run by locally-owned organizations, companies, and/or social enterprises. WeRobotics serves as the primary enabler of the Flying Labs Network. 

Screenshot 2023-01-10 at 11.38.52

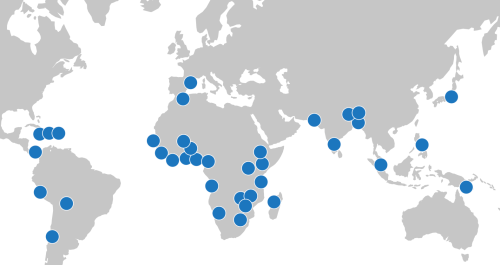
I want to express my deepest gratitude to all of you who worked with us to expand the power of locally-led action over the past 7+ years. Together, we’ve significantly expanded the quality and quantity of locally-led opportunities across multiple sectors. We also built greater respect and more robust demand for local leadership, ownership, knowledge, and expertise. How? By co-creating and co-implementing a radical decentralization and localization model with a wide range of Flying Labs in nearly 40 countries. The collective impact of this model speaks for itself.

We’ve accomplished a lot together. I can’t list every single example here, so will just share a few key accomplishments that mean a lot to me given my values, interests, and direct contributions. While I was largely responsible for catalyzing, championing, and/or coordinating the efforts below, it took our outstanding and purpose-driven teammates at WeRobotics and across the Flying Labs Network to refine these efforts, improve and extend them, and to translate them into direct, meaningful impact. We also relied on strong external partners, donors, dedicated Board Members and phenomenal interns. This was a true team effort in every sense of the word. As we all know, the myth of the lone leader is pure fantasy. 


2015WeR

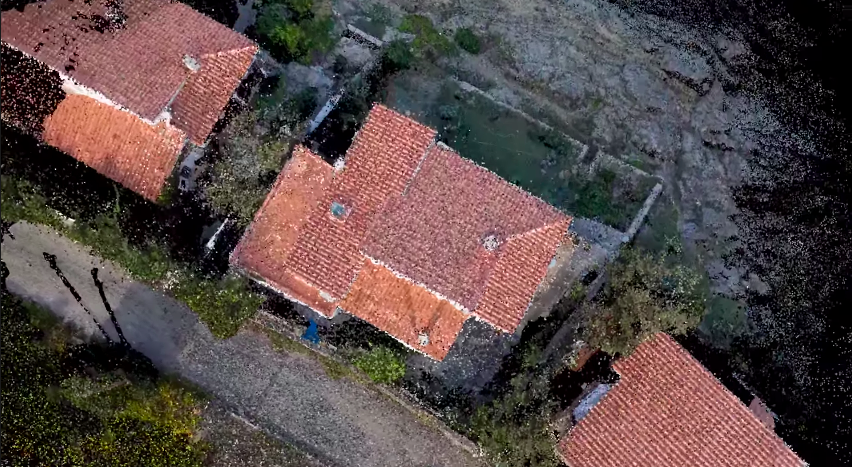
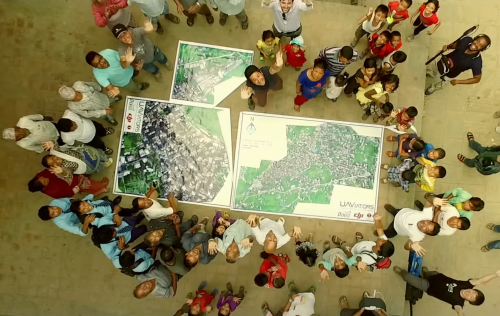
In 2015, one of my WeRobotics Co-Founders — Dr. Andrew Schroeder — and I launched the first-ever program dedicated to the locally-led use of drones for disaster management (AidRobotics). Together with many Flying Labs, we built the World Food Program’s (WFP) own institutional expertise in this space over multiple years. This included WeRobotics and Flying Labs leading half-a-dozen hands-on professional trainings for country teams in Africa, Asia, Latin America, and the Caribbean, not to mention with other UN agencies, from Malawi to the Maldives. Since then, Flying Labs have led their own trainings and operational deployments in response to a wide range of disasters across the globe. What’s more, we were amongst the first to apply machine learning and AI to automate the analysis of drone imagery (building on earlier work done at QCRI). I also launched a professional, peer-reviewed online training on the use of drones in humanitarian action, the only course of its kind. 

AidRobotics was our foundational and single most active program during the first critical years of WeRobotics. In fact, this program played an instrumental role in defining WeRobotics’ values, model and mission. So it’s worth expanding on this. AidRobotics was strongly influenced by UAViators, a global professional network and community of practice I founded in 2013 with an explicit focus on localization, ethics, and best practices. In fact, the initial decentralization idea of Flying Labs actually originated from UAViators. This also explains why Nepal Flying Labs (the first Flying Labs) predates WeRobotics by well over a year, and why the first Flying Labs projects were implemented in partnership with UAViators. Our joint learnings in Nepal later informed the launch of this digital solution to coordinate drone flights in disasters.

Screenshot 2023-01-12 at 15.15.24

In fact, the entire AidRobotics Program — including the Code of Conduct, training expertise, and our deployment experience — was a direct spinoff from the open collaborations at the heart of the UAViators community. We brought to WeRobotics our strong interest in localization and locally-led action thanks to this early operational and policy engagement. We also brought our core values and a strong commitment to decentralization and locally-led action. See the section “From UAViators to WeRobotics” in this peer-reviewed publication.

The foundational work through UAViators served to catalyze the co-creation of the Flying Labs Network, which has successfully expanded the space for locally-led action in the use of emerging technologies for social impact. So the Flying Labs Network feels like the pinnacle of a long journey from when I first began working on localization and people-centered projects in 2006, within the context of early warning and response systems in humanitarian emergencies. On the tech side, I’ve been working in humanitarian technology since co-founding and co-directing the Harvard Humanitarian Initiative’s (HHI) Program on Crisis Mapping in 2007. The first time I wrote about the use of drones in humanitarian action was in 2008.

2016WeR

In 2016, we teamed up with Peru Flying Labs to launch the first-ever program dedicated to the locally-led use of drones for medical delivery (HealthRobotics). Peru Flying Labs initiated this program through an explicit request to explore the possibilities of medical drone delivery in the Amazon Rainforest. To date, WeRobotics and several different Flying Labs have carried out more locally-driven drone delivery trainings and projects in more countries than any other organization or company thanks to our strategic partnerships with WHO, the CDC, Gates Foundation, Pfizer, Johnson & Johnson, and BD, along with multiple Ministries of Health, hospitals, clinics, doctors, nurses, and patients in Africa, Asia, Latin America, the Caribbean, and the South Pacific. Furthermore, we made drone delivery far more accessible than any other organization. 

drcargo

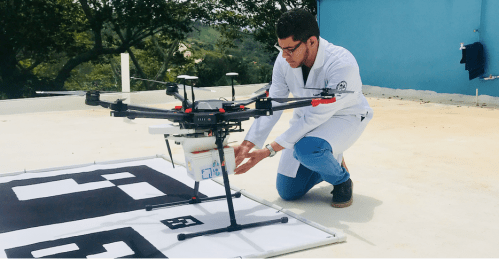
What’s more, thanks to the leadership of Flying Labs, we were the first to enable locally-led cargo drone deliveries in Peru, Dominican Republic, Nepal, Papua New Guinea, Uganda, and the Philippines, among others. We also enabled large-scale locally-led deliveries in Madagascar. To share our learnings, I launched a professional, peer-reviewed online training on using cargo drones in health. This is still the only ongoing course of its kind. Like the AidRobotics course, it was peer-reviewed by MIT, UPenn and Direct Relief experts.  

2017WeR

In 2017, we collectively launched and grew our dedicated engineering team to make cargo drones far more accessible to Flying Labs, and to offer Flying Labs both in-house add-on technology to use drones in a broader range of social good applications. The purpose of doing so was to enable Flying Labs to become first-movers in their own countries, as opposed to foreign companies and consultants who often parachute in with little local knowledge or interest in local ownership. 

WeRWMPic

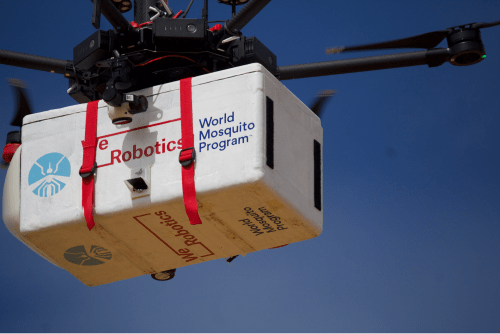
Our engineering expertise enabled both WeRobotics and Flying Labs to explore novel drone applications, including the precision release of beneficial mosquitoes to eliminate Dengue and Zika; Ladybugs to protect pecan trees and Mangrove seeds for climate change mitigation. The level of expertise needed to design and build these autonomous and drone-optimized release systems was considerable. Some members of the WeRobotics engineering team have since created a spinoff (formerly called Release Labs) to pursue related opportunities in the social impact space. I’m proud to have played a long and instrumental role in incubating this climate tech startup.

2018WeR

In 2018, we fully democratized the Flying Labs Network, enabling qualified local organizations worldwide to join the Network. We co-created a localization model with all the required guidelines and governance mechanisms to respond to the priorities and interests of local organizations. This development was important to me because of my strong interest in locally-led action and decentralization prior to WeRobotics. Fellow Co-Founder Andrew hasn’t received enough public credit for helping to shape this democratization and decentralization model, which paved the way for the Flying Labs Network to become a social movement dedicated to The Power of Local. This model ultimately enabled the Network to grow from three Flying Labs in 2018 to nearly 40 in 2023 (despite the devastating multi-year pandemic in between). You can read more about the model and its applications to other sectors here. Another proud accomplishment of 2018 was the launch of our Online Training Academy!

2019WeR

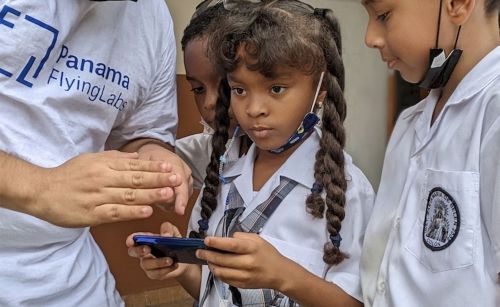
In 2019, we launched a new dedicated program to engage youth directly (YouthRobotics). WeRobotics and Flying Labs were the first to carry out hands-on youth trainings and projects in dozens of countries. These locally-led projects included aerial, terrestrial, and marine robotics. I initially took the lead in this program and secured our first funding for STEM projects. Together with multiple colleagues, we subsequently had the opportunity to co-implement these first activities in the South Pacific. This opened the door for many STEM projects that followed. As part of the YouthRobotics Program, we also teamed up with Flying Labs to co-create the first-ever picture book for children that is explicitly geared towards the importance of local knowledge, leadership, and ownership when it comes to the use of emerging technologies for social good projects. There are plans to turn this into a book series with Flying Labs.

panyouth

It’s worth noting that the three most active and impactful operational programs at WeRobotics over the past 7+ years have been the AidRobotics, HealthRobotics, and YouthRobotics Programs. This is all thanks to the dedicated WeRobotics and Flying Labs Teams who took these programs to the next level. There are many more accomplishments to write about within each of these three programs, so perhaps another book is in order! 

2020WeR

In 2020, with the COVID outbreak, I led the launch of this dedicated campaign to directly inform the appropriate use of drone technology in response to the pandemic. That same year, following our public commitment to anti-racism, I catalyzed our efforts to diversify our Board, shift our communications strategy and make the WeRobotics Team more inclusive. I’m very proud that we successfully accomplished each of the goals in our public commitment thanks to a huge team effort. I later led the launch of this shift-the-power series to document our concrete steps in shifting power with local organizations. All these efforts were central to our organizational transformation. In addition, we launched the Flying Council with Flying Labs to accelerate our Stopping-as-Success explorations. I’m a western white male who works hard to understand and reflect on my privileged role and how to transform individually. This position of power can have an impact on organizations, including WeRobotics and Flying Labs. I recognize that shifting the power is a continuous and hard-fought journey, and still have a lot to learn.

2021WeR

In 2021, we teamed up with multiple Flying Labs to fully document our joint localization and shift-the-power model, which we first began co-creating with Flying Labs in 2018. Why? Because the model was simply not getting enough visibility in policy circles, or influencing mainstream discussions on localization. We also wanted to make the model more accessible for others to adapt and adopt. So I took the lead from the WeRobotics side by working closely with many Flying Labs. As always, their insights were considerable and their input invaluable. The applied research and writing took over five months. Once completed, we launched this detailed report on our decentralization model at the Skoll World Forum to demonstrate and explain the model’s success. CDA Photo 2 - LocRep

The co-creation of this model will undoubtedly remain one of my proudest accomplishments at WeRobotics. We also used the high-profile Skoll event to formally launch the Power Footprint Project, which I’m also very passionate about. And we fully updated our Shift-the-Power strategy, along with the impact pages of WeRobotics and Flying Labs

2022WeR

In 2022, following another successful independent audit, we publicly confirmed that in 2021, WeRobotics transferred 42% of its own revenue and funding to local organizations. The industry average in the humanitarian and development space is typically 2-3%. This makes us one of the few international nonprofit organizations worldwide to accomplish such high levels of equity. We did this by walking the talk; by using our co-created localization model that clearly places local organizations first, along with local leadership, ownership, and expertise. In 2022, we also launched this dedicated call for the Power Footprint Project. The Board is exploring how best to move this project forward. 

During the second half of 2022, I worked closely with colleagues to initiate necessary organizational improvements in terms of Board oversight, governance, decision-making, executive performance reviews, accountability mechanisms, and more. I proactively reached out to the Board on this, working directly with them — and with the Head of Human Resources and Head of Finance — to ensure that WeRobotics stands on solid institutional foundations for the future. This essential work took up 120% of my own time between June and October 2022; groundwork that should enable WeRobotics to be more in line with institutional best practices in 2023. These organizational improvements are among the most important contributions I’ve made at WeRobotics. Leading a transformation agenda can be complex and result in burnout.

On the funding front, we successfully secured support from innovative partners who strongly believed in our mission throughout the years. This includes — but is certainly not limited to — The Rockefeller Foundation, Hewlett Foundation, Gates Foundation, Autodesk Foundation, Jansen Foundation, Atlassian Foundation, Fondation Botnar, Omidyar Network, Twilio Foundation, PagerDuty, MIT Solve, multiple United Nations Agencies, World Bank, Inter-American Development Bank (IADB), USAID, Australia’s Department of Foreign Affairs and Trade (DFAT), BD, Pfizer, Johnson & Johnson, and more. 

There’s definitely a lot more that I’m proud of, such as our 100% success rate in passing all of our rigorous and independent audits; the many technology partnerships we’ve secured; leading our expansion into both marine robotics and terrestrial robotics; the Social Ripples systems change project; and our new and improved impact monitoring framework. Not to mention many other essential accomplishments that I wasn’t involved in, such as locally-led drone certification courses, WeShare — our knowledge sharing platform built with Flying Labs; the Labs’ Global Model; the launch of Labs Use-Cases; and many more projects featured on the WeRobotics and Flying Labs blogs, and in our Annual Reports.

To conclude, the most crucial point to take away is this: the enormous team efforts across both WeRobotics and the Flying Labs Network made all the above accomplishments possible and successful. 


2023WeR

I’m excited about the next chapter of WeRobotics and Flying Labs. The Flying Labs Network is expected to grow to well over 40 Flying Labs in 2023. There simply is no other network quite like this one. Flying Labs are already training each other and implementing joint projects with each other. This trend will increase substantially, resulting in even more network effects. As I remind all my Flying Labs colleagues during our retreats over the years: “You are each other’s single best resource!” 

Whoever becomes the next Executive Director of WeRobotics matters a lot to Flying Labs. So the WeRobotics Board will reach out to all Labs to invite their nominations for strong leadership candidates who are fully committed to our core values. This new chapter is a big positive opportunity for Flying Labs to shape the governance of WeRobotics itself. While change is never easy, the benefits are clear. The significant value-add of greater diversity in team leadership is very well proven. More diverse leadership at WeRobotics will also enable Flying Labs to gain greater access to new funding opportunities.

And don’t forget that WeRobotics has a strong Alumni Network! For example, Joseph (former Head of Drone Data and Systems); Jürg (former Head of Engineering); Seb (former Lead Engineer), and also Cameron (former Lead Engineer), amongst others, all joined the Alumni Network in the past 10 months. What’s more, the Head of HR is joining the network in the coming months, as is the Head of Finance. So WeRobotics has top-notch alumni to draw on. In fact, several alumni have already supported multiple colleagues at Flying Labs and WeRobotics. I pledge to do the same. 

When the time is right, I’ll publish a blog post to share the most important professional and personal insights I’ve gained while at WeRobotics, along with the most important lessons learned as executive director during the past 7+ years. This will include my first-hand experience and lessons learned working with a Board. I hope that sharing my learnings will be of value to others. It is essential to me that we live up to our core values externally and internally. 

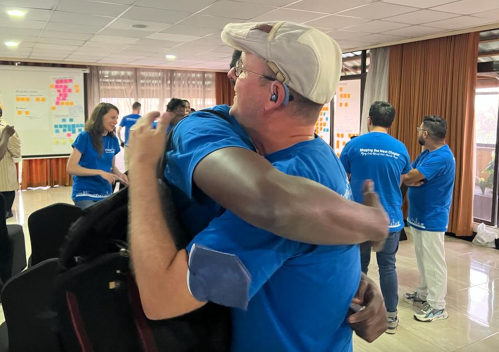
It was an incredible honor and privilege to serve as the official director of this organization.* What I’ll miss the most is my dear colleagues at WeRobotics and Flying Labs; their compassion, kindness, brilliance, dedication and humor. We laughed a lot during our recent Flying Labs Retreat in Nairobi, and we cried (happy tears of gratitude), shared meals, sang, listened to powerful poetry, and even danced. It was good for the soul, as were the many in-person hugs and the energy, inspiration, determination, and brilliance that Flying Labs colleagues brought to the many discussions. I’ll miss this Flying Labs magic, the Power of Local. So I look forward to following their good work.

Screenshot 2023-01-10 at 12.11.25

In sum, I am deeply grateful to everyone who made the above contributions possible and more impactful. You all know who you are. You were there, time and time again, to expand the space for locally-led action. I’ll be forever grateful to you. Lastly, and equally importantly, I want to explicitly recognize and thank each of my colleagues for their proudest accomplishments at WeRobotics and across the Flying Labs Network. Keep shining!

Per Aspera ad Astra.
Through adversity to the stars.


* The WeRobotics Board of Directors did not approve the Co-CEO titles, which is why I’m using the approved title of ED.

Digital Humanitarians in Space: Planet Launches Rapid Response Team

Planet has an unparalleled constellation of satellites in orbit. In addition to their current constellation of 130 micro-satellites, they have 5 RapidEye satellites and the 7 SkySat satellites (recently acquired from Google). What’s more, 48 new micro-satellites were just launched into orbit this July, bringing the total number of Planet satellites to 190. And once the 48 satellites begin imaging, Planet will have global, daily coverage of the entire Earth, covering over 150 million square kilometers every day. Never before has the humanitarian community had access to such a vast amount of timely satellite imagery.

As described in my book, Digital Humanitarians, this vast amount of new data adds to the rapidly growing Big Data challenge that humanitarian organizations are facing. As such, what humanitarians need is not just data philanthropy—i.e., free and rapid access to relevant data—they also need insight philanthropy. This is where Planet’s new Rapid Response Team comes in.

Planet just launched this new digital volunteer program in partnership with the Digital Humanitarian Network to help ensure that Planet’s data and insights get to the right people at the right time to accelerate and improve humanitarian response. After major disasters hit, members of the Rapid Response Team can provide the latest satellite images available and/or geospatial analysis directly to field-based aid organizations.

So if you’re an established humanitarian group and need rapid access to satellite imagery and/or analysis after major disasters, simply activate the Digital Humanitarian Network. You can request satellite images of disaster affected areas on a daily basis as well as before/after analysis (sliders) of those areas as shown above. This is an exciting and generous new resource being made available to the international humanitarian community by Planet, so please do take advantage.

In the meantime, if you have any questions or suggestions, please feel free to get in touch by email or via the comments section below. I serve as an advisor to Planet and am keen to make the Rapid Response initiative as useful as possible to humanitarian organizations.

Using Sound and Artificial Intelligence to Detect Human Rights Violations

Video continues to be a powerful way to capture human rights abuses around the world. Videos posted to social media can be used to hold perpetrators of gross violations accountable. But video footage poses a “Big Data” challenge to human rights organizations. Two billion smartphone users means almost as many video cameras. This leads to massive amounts of visual content of both suffering and wrong-doing during conflict zones. Reviewing these videos manually is a very labor intensive, time consuming, expensive and often traumatic task. So my colleague Jay Aronson at CMU has been exploring how artificial intelligence and in particular machine learning might solve this challenge.

blog1pic

As Jay and team rightly note in a recent publication (PDF), “the dissemination of conflict and human rights related video has vastly outpaced the ability of researchers to keep up with it – particularly when immediate political action or rapid humanitarian response is required.” The consequences of this are similar to what I’ve observed in humanitarian aid: At some point (which will vary from organization to organization), time and resource limitations will necessitate an end to the collection, archiving, and analysis of user generated content unless the process can be automated.” In sum, information overload can “prevent human rights researchers from uncovering widely dispersed events taking place over long periods of time or large geographic areas that amount to systematic human rights violations.”

jayblog1

To take on this Big Data challenge, Jay and team have developed a new machine learning-based audio processing system that “enables both synchronization of multiple audio-rich videos of the same event, and discovery of specific sounds (such as wind, screaming, gunshots, airplane noise, music, and explosions) at the frame level within a video.” The system basically “creates a unique “soundprint” for each video in a collection, synchronizes videos that are recorded at the same time and location based on the pattern of these signatures, and also enables these signatures to be used to locate specific sounds precisely within a video. The use of this tool for synchronization ultimately provides a multi-perspectival view of a specific event, enabling more efficient event reconstruction and analysis by investigators.”

Synchronizing image features is far more complex than synchronizing sound. “When an object is occluded, poorly illuminated, or not visually distinct from the background, it cannot always be detected by computer vision systems. Further, while computer vision can provide investigators with confirmation that a particular video was shot from a particular location based on the similarity of the background physical environment, it is less adept at synchronizing multiple videos over time because it cannot recognize that a video might be capturing the same event from different angles or distances. In both cases, audio sensors function better so long as the relevant videos include reasonably good audio.”

Ukrainian human rights practitioners working with families of protestors killed during the 2013-2014 Euromaidan Protests recently approached Jay and company to analyze videos from those events. They wanted to “ locate every video available in their collection of the moments before, during, and just after a specific set of killings. They wanted to extract information from these videos, including visual depictions of these killings, whether the protesters in question were an immediate and direct threat to the security forces, plus any other information that could be used to corroborate or refute other forms of evidence or testimony available for their cases.”

jayblog2

Their plan had originally been to manually synchronize more than 65 hours of video footage from 520 videos taken during the morning of February 20, 2014. But after working full-time over several months, they were only able to stitch together about 4 hours of the total video using visual and audio cues in the recording.” So Jay and team used their system to make sense of the footage. They were able to automatically synchronize over 4 hours of the footage. The figure above shows an example of video clips synchronized by the system.

Users can also “select a segment within the video containing the event they are interested in (for example, a series of explosions in a plaza), and search in other videos for a similar segment that shows similar looking buildings or persons, or that contains a similar sounding noise. A user may for example select a shooting scene with a significant series of gunshots, and may search for segments with a similar sounding series of gunshots. This method increases the chances for finding video scenes of an event displaying different angles of the scene or parallel events.”

Jay and team are quick to emphasize that their system “does not  eliminate human involvement in the process because machine learning systems provide probabilistic, not certain, results.” To be sure, “the synchronization of several videos is noisy and will likely include mistakes—this is precisely why human involvement in the process is crucial.”

I’ve been following Jay’s applied research for many years now and continue to be a fan of his approach given the overlap with my own work in the use of machine learning to make sense of the Big Data generated during major natural disasters. I wholeheartedly agree with Jay when he reflected during a recent call that the use of advanced techniques alone is not the answer. Effective cross-disciplinary collaboration between computer scientists and human rights (or humanitarian) practitioners is really hard but absolutely essential. This explains why I wrote this practical handbook on how to create effective collaboration and successful projects between computer scientists and humanitarian organizations.

QED – Goodbye Doha, Hello Adventure!

Quod Erat Demonstrandum (QED) is Latin for “that which had to be proven.” This abbreviation was traditionally used at the end of mathematical proofs to signal the completion of said proofs. I joined the Qatar Computing Research Institute (QCRI) well over 3 years ago with a very specific mission and mandate: to develop and deploy next generation humanitarian technologies. So I built the Institute’s Social Innovation Program from the ground up and recruited the majority of the full-time experts (scientists, engineers, research assistants, interns & project manager) who have become integral to the Program’s success. During these 3+years, my team and I partnered directly with humanitarian and development organizations to empirically prove that methods from advanced computing can be used to make sense of Big (Crisis) Data. The time has thus come to add “QED” to the end of that proof and move on to new adventures. But first a reflection.

Over the past 3.5 years, my team and I at QCRI developed free and open source solutions powered by crowdsourcing and artificial intelligence to make sense of Tweets, text messages, pictures, videos, satellite and aerial imagery for a wide range of humanitarian and development projects. We co-developed and co-deployed these platforms (AIDR and MicroMappers) with the United Nations and the World Bank in response to major disasters such as Typhoons Haiyan and RubyCyclone Pam and both the Nepal & Chile Earthquakes. In addition, we carried out peer-reviewed, scientific research on these deployments to better understand how to meet the information needs of our humanitarian partners. We also tackled the information reliability question, experimenting with crowd-sourcing (Verily) and machine learning (TweetCred) to assess the credibility of information generated during disasters. All of these initiatives were firsts in the humanitarian technology space.

We later developed AIDR-SMS to auto-classify text messages; a platform that UNICEF successfully tested in Zambia and which the World Food Program (WFP) and the International Federation of the Red Cross (IFRC) now plan to pilot. AIDR was also used to monitor a recent election, and our partners are now looking to use AIDR again for upcoming election monitoring efforts. In terms of MicroMappers, we extended the platform (considerably) in order to crowd-source the analysis of oblique aerial imagery captured via small UAVs, which was another first in the humanitarian space. We also teamed up with excellent research partners to crowdsource the analysis of aerial video footage and to develop automated feature-detection algorithms for oblique imagery analysis based on crowdsourced results derived from MicroMappers. We developed these Big Data solutions to support damage assessment efforts, food security projects and even this wildlife protection initiative.

In addition to the above accomplishments, we launched the Internet Response League (IRL) to explore the possibility of leveraging massive multiplayer online games to process Big Crisis Data. Along similar lines, we developed the first ever spam filter to make sense of Big Crisis Data. Furthermore, we got directly engaged in the field of robotics by launching the Humanitarian UAV Network (UAViators), yet another first in the humanitarian space. In the process, we created the largest repository of aerial imagery and videos of disaster damage, which is ripe for cutting-edge computer vision research. We also spearheaded the World Bank’s UAV response to Category 5 Cyclone Pam in Vanuatu and also directed a unique disaster recovery UAV mission in Nepal after the devastating earthquakes. (I took time off from QCRI to carry out both of these missions and also took holiday time to support UN relief efforts in the Philippines following Typhoon Haiyan in 2013). Lastly, on the robotics front, we championed the development of international guidelines to inform the safe, ethical & responsible use of this new technology in both humanitarian and development settings. To be sure, innovation is not just about the technology but also about crafting appropriate processes to leverage this technology. Hence also the rationale behind the Humanitarian UAV Experts Meetings that we’ve held at the United Nations Secretariat, the Rockefeller Foundation and MIT.

All  of the above pioneering-and-experimental projects have resulted in extensive media coverage, which has placed QCRI squarely on the radar of international humanitarian and development groups. This media coverage has included the New York Times, Washington Post, Wall Street Journal, CNN, BBC News, UK Guardian, The Economist, Forbes and Times Magazines, New Yorker, NPR, Wired, Mashable, TechCrunch, Fast Company, Nature, New Scientist, Scientific American and more. In addition, our good work and applied research has been featured in numerous international conference presentations and keynotes. In sum, I know of no other institute for advanced computing research that has contributed this much to the international humanitarian space in terms of thought-leadership, strategic partnerships, applied research and operational expertise through real-world co-deployments during and after major disasters.

There is, of course, a lot more to be done in the humanitarian technology space. But what we have accomplished over the past 3 years clearly demonstrates that techniques from advanced computing can indeed provide part of the solution to the pressing Big Data challenge that humanitarian & development organizations face. At the same time, as I wrote in the concluding chapter of my new book, Digital Humanitarians, solving the Big Data challenge does not alas imply that international aid organizations will actually make use of the resulting filtered data or any other data for that matter—even if they ask for this data in the first place. So until humanitarian organizations truly shift towards both strategic and tactical evidence-based analysis & data-driven decision-making, this disconnect will surely continue unabated for many more years to come.

Reflecting on the past 3.5 years at QCRI, it is crystal clear to me that the number one most important lesson I (re)learned is that you can do anything if you have an outstanding, super-smart and highly dedicated team that continually goes way above and beyond the call of duty. It is one thing for me to have had the vision for AIDR, MicroMappers, IRL, UAViators, etc., but vision alone does not amount to much. Implementing said vision is what delivers results and learning. And I simply couldn’t have asked for a more talented & stellar team to translate these visions into reality over the past 3+years. You each know who you are, partners included; it has truly been a privilege and honor working with you. I can’t wait to see what you do next at/with QCRI. Thank you for trusting me; thank you for sharing my vision; thanks for your sense of humor, and thank you for your dedication and loyalty to science and social innovation.

So what’s next for me? I’ll be lining up independent consulting work with several organizations (likely including QCRI). In short, I’ll be open for business. I’m also planning to work on a new project that I’m very excited about, so stay tuned for updates; I’ll be sure to blog about this new adventure when the time is right. For now, I’m busy wrapping up my work as Director of Social Innovation at QCRI and working with the best team there is. QED.

Using Computer Vision to Analyze Aerial Big Data from UAVs During Disasters

Recent scientific research has shown that aerial imagery captured during a single 20-minute UAV flight can take more than half-a-day to analyze. We flew several dozen flights during the World Bank’s humanitarian UAV mission in response to Cyclone Pam earlier this year. The imagery we captured would’ve taken a single expert analyst a minimum 20 full-time workdays to make sense of. In other words, aerial imagery is already a Big Data problem. So my team and I are using human computing (crowdsourcing), machine computing (artificial intelligence) and computer vision to make sense of this new Big Data source.

For example, we recently teamed up with the University of Southampton and EPFL to analyze aerial imagery of the devastation caused by Cyclone Pam in Vanuatu. The purpose of this research is to generate timely answers. Aid groups want more than high-resolution aerial images of disaster-affected areas, they want answers; answers like the number and location of damaged buildings, the number and location of displaced peoples, and which roads are still useable for the delivery of aid, for example. Simply handing over the imagery is not good enough. As demonstrated in my new book, Digital Humanitarians, both aid and development organizations are already overwhelmed by the vast volume and velocity of Big Data generated during and post-disasters. Adding yet another source, Big Aerial Data, may be pointless since these organizations may simply not have the time or capacity to make sense of this new data let alone integrate the results with their other datasets.

We therefore analyzed the crowdsourced results from the deployment of our MicroMappers platform following Cyclone Pam to determine whether those results could be used to train algorithms to automatically detect disaster damage in future disasters in Vanuatu. During this MicroMappers deployment, digital volunteers analyzed over 3,000 high-resolution oblique aerial images, tracing houses that were fully destroyed, partially damaged and largely intact. My colleague Ferda Ofli and I teamed up with Nicolas Rey (a graduate student from EPFL who interned with us over the summer) to explore whether these traces could be used to train our algorithms. The results below were written with Ferda and Nicolas. Our research is not just an academic exercise. Vanuatu is the most disaster-prone country in the world. What’s more, this year’s El Niño is expected to be one of the strongest in half-a-century.

Screen Shot 2015-10-11 at 6.11.04 PM

According to the crowdsourced results, 1,145 of the high-resolution images did not contain any buildings. Above is a simple histogram depicting the number of buildings per image. The aerial images of Vanuatu are very heterogeneous, and vary not only in diversity of features they exhibit but also in the angle of view and the altitude at which the pictures were taken. While the vast majority of the images are oblique, some are almost nadir images, and some were taken very close to the ground or even before take off.

Screen Shot 2015-10-11 at 6.45.15 PM

The heterogeneity of our dataset of images makes the automated analysis of this imagery a lot more difficult. Furthermore, buildings that are under construction, of which there are many in our dataset, represent a major difficulty because they look very similar to damaged buildings. Our first task thus focused on training our algorithms to determine whether or not any given aerial image shows some kind of building. This is an important task given that more than ~30% of the images in our dataset do not contain buildings. As such, if we can develop an accurate algorithm to automatically filter out these irrelevant images (like the “noise” below), this will allows us focus the crowdsourced analysis of relevant images only.

Vanuatu3

While our results are purely preliminary, we are still pleased with our findings thus far. We’ve been able to train our algorithms to determine whether or not an aerial image includes a building with just over 90% accuracy at the tile level. More specifically, our algorithms were able to recognize and filter out 60% of the images that do not contain any buildings (recall rate), and only 10% of the images that contain buildings were mistakingly discarded (precision rate of 90%). The example below is an example. There are still quite a number of major challenges, however, so we want to be sure not to over-promise anything at this stage. In terms of next steps, we would like to explore whether our computer vision algorithms can distinguish between destroyed an intact buildings.

Screen Shot 2015-10-11 at 6.57.05 PMScreen Shot 2015-10-11 at 6.57.15 PM

The UAVs we were flying in Vanuatu required that we landed them in order to get access to the collected imagery. Increasingly, newer UAVs offer the option of broadcasting the aerial images and videos back to base in real time. DJI’s new Phantom 3 UAV (pictured below), for example, allows you to broadcast your live aerial video feed directly to YouTube (assuming you have connectivity). There’s absolutely no doubt that this is where the UAV industry is headed; towards real-time data collection and analysis. In terms of humanitarian applications, and search and rescue, having the data-analysis carried out in real-time is preferable.

WP27

This explains why my team and I recently teamed up with Elliot Salisbury & Sarvapali Ramchurn from the University of Southampton to crowdsource the analysis of live aerial video footage of disaster zones and to combine this crowdsourcing with (hopefully) near real-time machine learning and automated feature detection. In other words, as digital volunteers are busy tagging disaster damage in video footage, we want our algorithms to learn from these volunteers in real-time. That is, we’d like the algorithms to learn what disaster damage looks like so they can automatically identify any remaining disaster damage in a given aerial video.

So we recently carried out a MicroMappers test-deployment using aerial videos from the humanitarian UAV mission to Vanuatu. Close to 100 digital volunteers participated in this deployment. Their task? To click on any parts of the videos that show disaster damage. And whenever 80% or more of these volunteers clicked on the same areas, we would automatically highlight these areas to provide near-real time feedback to the UAV pilot and humanitarian teams.

At one point during the simulations, we had some 30 digital volunteers clicking on areal videos at the same time, resulting in an average of 12 clicks per second for more than 5 minutes. In fact, we collectively clicked on the videos a total of 49,706 times! This provided more than enough real-time data for MicroMappers to act as a human-intelligence sensor for disaster damage assessments. In terms of accuracy, we had about 87% accuracy with the collective clicks. Here’s how the simulations looked like to the UAV pilots as we were all clicking away:

Thanks to all this clicking, we can export only the most important and relevant parts of the video footage while the UAV is still flying. These snippets, such as this one and this one, can then be pushed to MicroMappers for additional verification. These animations are small and quick, and reduce a long aerial video down to just the most important footage. We’re now analyzing the areas that were tagged in order to determine whether we can use this data to train our algorithms accordingly. Again, this is far more than just an academic curiosity. If we can develop robust algorithms during the next few months, we’ll be ready to use them effectively during the next Typhoon season in the Pacific.

In closing, big thanks to my team at QCRI for translating my vision of Micro-Mappers into reality and for trusting me well over a year ago when I said we needed to extend our work to aerial imagery. All of the above research would simply not have been possible without MicroMappers existing. Big thanks as well to our excellent partners at EPFL and Southampton for sharing our vision and for their hard work on our joint projects. Last but certainly not least, sincerest thanks to digital volunteers from SBTF and beyond for participating in these digital humanitarian deployments.

Social Media for Disaster Response – Done Right!

To say that Indonesia’s capital is prone to flooding would be an understatement. Well over 40% of Jakarta is at or below sea level. Add to this a rapidly growing population of over 10 million and you have a recipe for recurring disasters. Increasing the resilience of the city’s residents to flooding is thus imperative. Resilience is the capacity of affected individuals to self-organize effectively, which requires timely decision-making based on accurate, actionable and real-time information. But Jakarta is also flooded with information during disasters. Indeed, the Indonesian capital is the world’s most active Twitter city.

JK1

So even if relevant, actionable information on rising flood levels could somehow be gleaned from millions of tweets in real-time, these reports could be inaccurate or completely false. Besides, only 3% of tweets on average are geo-located, which means any reliable evidence of flooding reported via Twitter is typically not actionable—that is, unless local residents and responders know where waters are rising, they can’t take tactical action in a timely manner. These major challenges explain why most discount the value of social media for disaster response.

But Digital Humanitarians in Jakarta aren’t your average Digital Humanitarians. These Digital Jedis recently launched one of the most promising humanitarian technology initiatives I’ve seen in years. Code named Peta Jakarta, the project takes social media and digital humanitarian action to the next level. Whenever someone posts a tweet with the word banjir (flood), they receive an automated tweet reply from @PetaJkt inviting them to confirm whether they see signs of flooding in their area: “Flooding? Enable geo-location, tweet @petajkt #banjir and check petajakarta.org.” The user can confirm their report by turning geo-location on and simply replying with the keyword banjir or flood. The result gets added to a live, public crisis map, like the one below.

Credit: Peta Jakarta

Over the course of the 2014/2015 monsoon season, Peta Jakarta automatically sent 89,000 tweets to citizens in Jakarta as a call to action to confirm flood conditions. These automated invitation tweets served to inform the user about the project and linked to the video below (via Twitter Cards) to provide simple instructions on how to submit a confirmed report with approximate flood levels. If a Twitter user forgets to turn on the geo-location feature of their smartphone, they receive an automated tweet reminding them to enable geo-location and resubmit their tweet. Finally, the platform “generates a thank you message confirming the receipt of the user’s report and directing them to PetaJakarta.org to see their contribution to the map.” Note that the “overall aim of sending programmatic messages is not to simply solicit a high volume of replies, but to reach active, committed citizen-users willing to participate in civic co-management by sharing nontrivial data that can benefit other users and government agencies in decision-making during disaster scenarios.”

A report is considered verified when a confirmed geo-tagged tweet includes a picture of the flooding, like in the tweet below. These confirmed and verified tweets get automatically mapped and also shared with Jakarta’s Emergency Management Agency (BPBD DKI Jakarta). The latter are directly involved in this initiative since they’re “regularly faced with the difficult challenge of anticipating & responding to floods hazards and related extreme weather events in Jakarta.” This direct partnership also serves to limit the “Data Rot Syndrome” where data is gathered but not utilized. Note that Peta Jakarta is able to carry out additional verification measures by manually assessing the validity of tweets and pictures by cross-checking other Twitter reports from the same district and also by monitoring “television and internet news sites, to follow coverage of flooded areas and cross-check reports.”

Screen Shot 2015-06-29 at 2.38.54 PM

During the latest monsoon season, Peta Jakarta “received and mapped 1,119 confirmed reports of flooding. These reports were formed by 877 users, indicating an average tweet to user ratio of 1.27 tweets per user. A further 2,091 confirmed reports were received without the required geolocation metadata to be mapped, highlighting the value of the programmatic geo-location ‘reminders’ […]. With regard to unconfirmed reports, Peta Jakarta recorded and mapped a total of 25,584 over the course of the monsoon.”

The Live Crisis Maps could be viewed via two different interfaces depending on the end user. For local residents, the maps could be accessed via smartphone with the visual display designed specifically for more tactical decision-making, showing flood reports at the neighborhood level and only for the past hour.

PJ2

For institutional partners, the data is visualized in more aggregate terms for strategic decision-making based trends-analysis and data integration. “When viewed on a desktop computer, the web-application scaled the map to show a situational overview of the city.”

Credit: Peta Jakarta

Peta Jakarta has “proven the value and utility of social media as a mega-city methodology for crowdsourcing relevant situational information to aid in decision-making and response coordination during extreme weather events.” The initiative enables “autonomous users to make independent decisions on safety and navigation in response to the flood in real-time, thereby helping increase the resilience of the city’s residents to flooding and its attendant difficulties.” In addition, by “providing decision support at the various spatial and temporal scales required by the different actors within city, Peta Jakarta offers an innovative and inexpensive method for the crowdsourcing of time-critical situational information in disaster scenarios.” The resulting confirmed and verified tweets were used by BPBD DKI Jakarta to “cross-validate formal reports of flooding from traditional data sources, supporting the creation of information for flood assessment, response, and management in real-time.”


My blog post is based several conversations I had with Peta Jakarta team and on this white paper, which was just published a week ago. The report runs close to 100 pages and should absolutely be considered required reading for all Digital Humanitarians and CrisisMappers. The paper includes several dozen insights which a short blog post simply cannot do justice to. If you can’t find the time to read the report, then please see the key excerpts below. In a future blog post, I’ll describe how the Peta Jakarta team plans to leverage UAVs to complement social media reporting.

  • Extracting knowledge from the “noise” of social media requires designed engagement and filtering processes to eliminate unwanted information, reward valuable reports, and display useful data in a manner that further enables users, governments, or other agencies to make non-trivial, actionable decisions in a time-critical manner.
  • While the utility of passively-mined social media data can offer insights for offline analytics and derivative studies for future planning scenarios, the critical issue for frontline emergency responders is the organization and coordination of actionable, real-time data related to disaster situations.
  • User anonymity in the reporting process was embedded within the Peta Jakarta project. Whilst the data produced by Twitter reports of flooding is in the public domain, the objective was not to create an archive of users who submitted potentially sensitive reports about flooding events, outside of the Twitter platform. Peta Jakarta was thus designed to anonymize reports collected by separating reports from their respective users. Furthermore, the text content of tweets is only stored when the report is confirmed, that is, when the user has opted to send a message to the @petajkt account to describe their situation. Similarly, when usernames are stored, they are encrypted using a one-way hash function.
  • In developing the Peta Jakarta brand as the public face of the project, it was important to ensure that the interface and map were presented as community-owned, rather than as a government product or academic research tool. Aiming to appeal to first adopters—the young, tech-savvy Twitter-public of Jakarta—the language used in all the outreach materials (Twitter replies, the outreach video, graphics, and print advertisements) was intentionally casual and concise. Because of the repeated recurrence of flood events during the monsoon, and the continuation of daily activities around and through these flood events, the messages were intentionally designed to be more like normal twitter chatter and less like public service announcements.
  • It was important to design the user interaction with PetaJakarta.org to create a user experience that highlighted the community resource element of the project (similar to the Waze traffic app), rather than an emergency or information service. With this aim in mind, the graphics and language are casual and light in tone. In the video, auto-replies, and print advertisements, PetaJakarta.org never used alarmist or moralizing language; instead, the graphic identity is one of casual, opt-in, community participation.
  • The most frequent question directed to @petajkt on Twitter was about how to activate the geo-location function for tweets. So far, this question has been addressed manually by sending a reply tweet with a graphic instruction describing how to activate geo-location functionality.
  • Critical to the success of the project was its official public launch with, and promotion by, the Governor. This endorsement gave the platform very high visibility and increased legitimacy among other government agencies and public users; it also produced a very successful media event, which led substantial media coverage and subsequent public attention.

  • The aggregation of the tweets (designed to match the spatio-temporal structure of flood reporting in the system of the Jakarta Disaster Management Agency) was still inadequate when looking at social media because it could result in their overlooking reports that occurred in areas of especially low Twitter activity. Instead, the Agency used the @petajkt Twitter stream to direct their use of the map and to verify and cross-check information about flood-affected areas in real-time. While this use of social media was productive overall, the findings from the Joint Pilot Study have led to the proposal for the development of a more robust Risk Evaluation Matrix (REM) that would enable Peta Jakarta to serve a wider community of users & optimize the data collection process through an open API.
  • Developing a more robust integration of social media data also means leveraging other potential data sets to increase the intelligence produced by the system through hybridity; these other sources could include, but are not limited to, government, private sector, and NGO applications (‘apps’) for on- the-ground data collection, LIDAR or UAV-sourced elevation data, and fixed ground control points with various types of sensor data. The “citizen-as- sensor” paradigm for urban data collection will advance most effectively if other types of sensors and their attendant data sources are developed in concert with social media sourced information.

A Force for Good: How Digital Jedis are Responding to the Nepal Earthquake (Updated)

Digital Humanitarians are responding in full force to the devastating earthquake that struck Nepal. Information sharing and coordination is taking place online via CrisisMappers and on multiple dedicated Skype chats. The Standby Task Force (SBTF), Humanitarian OpenStreetMap (HOT) and others from the Digital Humanitarian Network (DHN) have also deployed in response to the tragedy. This blog post provides a quick summary of some of these digital humanitarian efforts along with what’s coming in terms of new deployments.

Update: A list of Crisis Maps for Nepal is available below.

Credit: http://www.thestar.com/content/dam/thestar/uploads/2015/4/26/nepal2.jpg

At the request of the UN Office for the Coordination of Humanitarian Affairs (OCHA), the SBTF is using QCRI’s MicroMappers platform to crowdsource the analysis of tweets and mainstream media (the latter via GDELT) to rapidly 1) assess disaster damage & needs; and 2) Identify where humanitarian groups are deploying (3W’s). The MicroMappers CrisisMaps are already live and publicly available below (simply click on the maps to open live version). Both Crisis Maps are being updated hourly (at times every 15 minutes). Note that MicroMappers also uses both crowdsourcing and Artificial Intelligence (AIDR).

Update: More than 1,200 Digital Jedis have used MicroMappers to sift through a staggering 35,000 images and 7,000 tweets! This has so far resulted in 300+ relevant pictures of disaster damage displayed on the Image Crisis Map and over 100 relevant disaster tweets on the Tweet Crisis Map.

Live CrisisMap of pictures from both Twitter and Mainstream Media showing disaster damage:

MM Nepal Earthquake ImageMap

Live CrisisMap of Urgent Needs, Damage and Response Efforts posted on Twitter:

MM Nepal Earthquake TweetMap

Note: the outstanding Kathmandu Living Labs (KLL) team have also launched an Ushahidi Crisis Map in collaboration with the Nepal Red Cross. We’ve already invited invited KLL to take all of the MicroMappers data and add it to their crisis map. Supporting local efforts is absolutely key.

WP_aerial_image_nepal

The Humanitarian UAV Network (UAViators) has also been activated to identify, mobilize and coordinate UAV assets & teams. Several professional UAV teams are already on their way to Kathmandu. The UAV pilots will be producing high resolution nadir imagery, oblique imagery and 3D point clouds. UAViators will be pushing this imagery to both HOT and MicroMappers for rapid crowdsourced analysis (just like was done with the aerial imagery from Vanuatu post Cyclone Pam, more on that here). A leading UAV manufacturer is also donating several UAVs to UAViators for use in Nepal. These UAVs will be sent to KLL to support their efforts. In the meantime, DigitalGlobePlanet Labs and SkyBox are each sharing their satellite imagery with CrisisMappers, HOT and others in the Digital Humanitarian Network.

There are several other efforts going on, so the above is certainly not a complete list but simply reflect those digital humanitarian efforts that I am involved in or most familiar with. If you know of other major efforts, then please feel free to post them in the comments section. Thank you. More on the state of the art in digital humanitarian action in my new book, Digital Humanitarians.


List of Nepal Crisis Maps

Please add to the list below by posting new links in this Google Spreadsheet. Also, someone should really create 1 map that pulls from each of the listed maps.

Code for Nepal Casualty Crisis Map:
http://bit.ly/1IpUi1f 

DigitalGlobe Crowdsourced Damage Assessment Map:
http://goo.gl/bGyHTC

Disaster OpenRouteService Map for Nepal:
http://www.openrouteservice.org/disaster-nepal

ESRI Damage Assessment Map:
http://arcg.is/1HVNNEm

Harvard WorldMap Tweets of Nepal:
http://worldmap.harvard.edu/maps/nepalquake 

Humanitarian OpenStreetMap Nepal:
http://www.openstreetmap.org/relation/184633

Kathmandu Living Labs Crowdsourced Crisis Map: http://www.kathmandulivinglabs.org/earthquake

MicroMappers Disaster Image Map of Damage:
http://maps.micromappers.org/2015/nepal/images/#close

MicroMappers Disaster Damage Tweet Map of Needs:
http://maps.micromappers.org/2015/nepal/tweets

NepalQuake Status Map:
http://www.nepalquake.org/status-map

UAViators Crisis Map of Damage from Aerial Pics/Vids:
http://uaviators.org/map (takes a while to load)

Visions SDSU Tweet Crisis Map of Nepal:
http://vision.sdsu.edu/ec2/geoviewer/nepal-kathmandu#

Can Massively Multiplayer Online Games also be Next Generation Humanitarian Technologies?

IRL

My colleague Peter Mosur and I launched the Internet Response League (IRL) at QCRI a while back to actively explore the intersection of massively multiplayer online games & humanitarian response. IRL is also featured in my new book, Digital Humanitarians, along with many other innovative ideas & technologies. Shortly after the book came out, Peter and I had the pleasure of exploring a collaboration with the team at Massive Multiplayer Online Science (MMOS) and CCP Games—makers of the popular game EVE Online.

MMOS is an awesome group that aims to enable online gamers to contribute to scientific research while playing video games. Our colleagues at MMOS kindly reached out to us earlier this year as they’re really interested in supporting humanitarian efforts as well. They are thus kindly bringing IRL on board to help them explore the use of online games for humanitarian projects.

CCP Games has already been mentioned on the IRL blog here. Their gamers managed to raise an impressive $190,890 for the Icelandic Red Cross in response to Typhoon Haiyan/Yolanda with their PLEX for Good initiative. This is on top of the $100,000 that the company has raised with the program for various disasters in Japan, Haiti, Pakistan, and the United States.

CCP Game’s flagship title EVE Online passed 500,000 subscribers in 2013. The game is extremely unique when it comes to MMORPGs. Rather than having a player base spanning across many different servers, EVE Online keeps keeps all players on one large server. Entitled “Tranquility”, this one server currently averages 25,000 players at any given time, with peaks of over 38,000 [1]. This equates to an average of 600,000 hours of human time spent playing EVE Online every day! The potential good to come out of a humanitarian partnership would be immensely valuable to the world!

So we’re currently exploring with the team at MMOS possible ways to process humanitarian data within EVE’s gaming environment. We’ll write another post soon detailing the unique challenges we’re facing in terms of seamlessly process-ing digital humanitarian tasks within EVE Online. This will require a lot of creativity to pull off and success is by no means guaranteed (just like life and online games). In sum, our humanitarian tasks must in no way disrupt the EVE Online experience; they basically need to be “invisible” to the gamer (besides an initial opt-in).

See the video below for an in-depth overview of the type of work that MMOS and CCP Games envision incorporated into EVE Online. The video was screened at the recent EVE Online Fanfest last month and also features a message from the Internet Response League at the 40:36 minute mark!

This blog post was co-authored with Peter Mosur.

Artificial Intelligence for Monitoring Elections (AIME)

AIME logo

I published a blog post with the same title a good while back. Here’s what I wrote at the time:

Citizen-based, crowdsourced election observation initiatives are on the rise. Leading election monitoring organizations are also looking to leverage citizen-based reporting to complement their own professional election monitoring efforts. Meanwhile, the information revolution continues apace, with the number of new mobile phone subscriptions up by over 1 billion in just the past 36 months alone. The volume of election-related reports generated by “the crowd” is thus expected to grow significantly in the coming years. But international, national and local election monitoring organizations are completely unprepared to deal with the rise of Big (Election) Data.

I thus introduced a new project to “develop a free and open source platform to automatically filter relevant election reports from the crowd.” I’m pleased to report that my team and I at QCRI have just tested AIME during an actual election for the very first time—the 2015 Nigerian Elections. My QCRI Research Assistant Peter Mosur (co-author of this blog post) collaborated directly with Oludotun Babayemi from Clonehouse Nigeria and Chuks Ojidoh from the Community Life Project & Reclaim Naija to deploy and test the AIME platform.

AIME is a free and open source (experimental) solution that combines crowd-sourcing with Artificial Intelligence to automatically identify tweets of interest during major elections. As organizations engaged in election monitoring well know, there can be a lot chatter on social media as people rally behind their chosen candidates, announce this to the world, ask their friends and family who they will be voting for, and updating others when they have voted while posting about election related incidents they may have witnessed. This can make it rather challenging to find reports relevant to election monitoring groups.

WP1

Election monitors typically monitor instances of violence, election rigging, and voter issues. These incidents are monitored because they reveal problems that arise with the elections. Election monitoring initiatives such as Reclaim Naija & Uzabe also monitor several other type of incidents but for the purposes of testing the AIME platform, we selected three types of events mentioned above. In order to automatically identify tweets related to these events, one must first provide AIME with example tweets. (Of course, if there is no Twitter traffic to begin with, then there won’t be much need for AIME, which is precisely why we developed an SMS extension that can be used with AIME).

So where does the crowdsourcing comes in? Users of AIME can ask the crowd to tag tweets related to election-violence, rigging and voter issues by simply clicking on tagging tweets posted to the AIME platform with the appropriate event type. (Several quality control mechanisms are built in to ensure data quality. Also, one does not need to use crowdsourcing to tag the tweets; this can be done internally as well or instead). What AIME does next is use a technique from Artificial Intelligence (AI) called statistical machine learning to understand patterns in the human-tagged tweets. In other words, it begins to recognize which tweets belong in which category type—violence, rigging and voter issues. AIME will then auto-classify new tweets that are related to these categories (and can auto-classify around 2 millions tweets or text messages per minute).

Screen Shot 2015-04-10 at 8.33.08 AM

Before creating our automatic classifier for the Nigerian Elections, we first needed to collect examples of tweets related to election violence, rigging and voter issues in order to teach AIME. Oludotun Babayemi and Chuks Ojidoh kindly provided the expert local knowledge needed to identify the keywords we should be following on Twitter (using AIME). They graciously gave us many different keywords to use as well as a list of trusted Twitter accounts to follow for election-related messages. (Due to difficulties with AIME, we were not able to use the trusted accounts. In addition, many of the suggested keywords were unusable since words like “aggressive”, “detonate”, and “security” would have resulted in large amount of false positives).

Here is the full list of keywords used by AIME:

Nigeria elections, nigeriadecides, Nigeria decides, INEC, GEJ, Change Nigeria, Nigeria Transformation, President Jonathan, Goodluck Jonathan, Sai Buhari, saibuhari, All progressives congress, Osibanjo, Sambo, Peoples Democratic Party, boko haram, boko, area boys, nigeria2015, votenotfight, GEJwinsit, iwillvoteapc, gmb2015, revoda, thingsmustchange,  and march4buhari   

Out of this list, “NigeriaDecides” was by far the most popular keyword used in the elections. It accounted for over 28,000 Tweets of a batch of 100,000. During the week leading up to the elections, AIME collected roughly 800,000 Tweets. Over the course of the elections and the few days following, the total number of collected Tweets jumped to well over 4 million.

We sampled just a handful of these tweets and manually tagged those related to violence, rigging and other voting issues using AIME. “Violence” was described as “threats, riots, arming, attacks, rumors, lack of security, vandalism, etc.” while “Election Rigging” was described as “Ballot stuffing, issuing invalid ballot papers, voter impersonation, multiple voting, ballot boxes destroyed after counting, bribery, lack of transparency, tampered ballots etc.” Lastly, “Voting Issues” was defined as “Polling station logistics issues, technical issues, people unable to vote, media unable to enter, insufficient staff, lack of voter assistance, inadequate voting materials, underage voters, etc.”

Any tweet that did not fall into these three categories was tagged as “Other” or “Not Related”. Our Election Classifiers were trained with a total of 571 human-tagged tweets which enabled AIME to automatically classify well over 1 million tweets (1,263,654 to be precise). The results in the screenshot below show accurate AIME was at auto-classifying tweets based on the different event types define earlier. AUC is what captures the “overall accuracy” of AIME’s classifiers.

AIME_Nigeria

AIME was rather good at correctly tagging tweets related to “Voting Issues” (98% accuracy) but drastically poor at tagging related to “Election Rigging” (0%). This is not AIME’s fault : ) since it only had 8 examples to learn from. As for “Violence”, the accuracy score was 47%, which is actually surprising given that AIME only had 14 human-tagged examples to learn from. Lastly, AIME did fairly well at auto-classifying unrelated tweets (accuracy of 86%).

Conclusion: this was the first time we tested AIME during an actual election and we’ve learned a lot in the process. The results are not perfect but enough to press on and experiment further with the AIME platform. If you’d like to test AIME yourself (and if you fully recognize that the tool is experimental and still under development, hence not perfect), then feel free to get in touch with me here. We have 2 slots open for testing. In the meantime, big thanks to my RA Peter for spearheading both this deployment and the subsequent research.

Crowdsourcing Point Clouds for Disaster Response

Point Clouds, or 3D models derived from high resolution aerial imagery, are in fact nothing new. Several software platforms already exist to reconstruct a series of 2D aerial images into fully fledged 3D-fly-through models. Check out these very neat examples from my colleagues at Pix4D and SenseFly:

What does a castle, Jesus and a mountain have to do with humanitarian action? As noted in my previous blog post, there’s only so much disaster damage one can glean from nadir (that is, vertical) imagery and oblique imagery. Lets suppose that the nadir image below was taken by an orbiting satellite or flying UAV right after an earthquake, for example. How can you possibly assess disaster damage from this one picture alone? Even if you had nadir imagery for these houses before the earthquake, your ability to assess structural damage would be limited.

Screen Shot 2015-04-09 at 5.48.23 AM

This explains why we also captured oblique imagery for the World Bank’s UAV response to Cyclone Pam in Vanuatu (more here on that humanitarian mission). But even with oblique photographs, you’re stuck with one fixed perspective. Who knows what these houses below look like from the other side; your UAV may have simply captured this side only. And even if you had pictures for all possible angles, you’d literally have 100’s of pictures to leaf through and make sense of.

Screen Shot 2015-04-09 at 5.54.34 AM

What’s that famous quote by Henry Ford again? “If I had asked people what they wanted, they would have said faster horses.” We don’t need faster UAVs, we simply need to turn what we already have into Point Clouds, which I’m indeed hoping to do with the aerial imagery from Vanuatu, by the way. The Point Cloud below was made only from single 2D aerial images.

It isn’t perfect, but we don’t need perfection in disaster response, we need good enough. So when we as humanitarian UAV teams go into the next post-disaster deployment and ask what humanitarians they need, they may say “faster horses” because they’re not (yet) familiar with what’s really possible with the imagery processing solutions available today. That obviously doesn’t mean that we should ignore their information needs. It simply means we should seek to expand their imaginations vis-a-vis the art of the possible with UAVs and aerial imagery. Here is a 3D model of a village in Vanuatu constructed using 2D aerial imagery:

Now, the title of my blog post does lead with the word crowdsourcing. Why? For several reasons. First, it takes some decent computing power (and time) to create these Point Clouds. But if the underlying 2D imagery is made available to hundreds of Digital Humanitarians, we could use this distributed computing power to rapidly crowdsource the creation of 3D models. Second, each model can then be pushed to MicroMappers for crowdsourced analysis. Why? Because having a dozen eyes scrutinizing one Point Cloud is better than 2. Note that for quality control purposes, each Point Cloud would be shown to 5 different Digital Humanitarian volunteers; we already do this with MicroMappers for tweets, pictures, videos, satellite images and of course aerial images as well. Each digital volunteer would then trace areas in the Point Cloud where they spot damage. If the traces from the different volunteers match, then bingo, there’s likely damage at those x, y and z coordinate. Here’s the idea:

We could easily use iPads to turn the process into a Virtual Reality experience for digital volunteers. In other words, you’d be able to move around and above the actual Point Cloud by simply changing the position of your iPad accordingly. This technology already exists and has for several years now. Tracing features in the 3D models that appear to be damaged would be as simple as using your finger to outline the damage on your iPad.

What about the inevitable challenge of Big Data? What if thousands of Point Clouds are generated during a disaster? Sure, we could try to scale our crowd-sourcing efforts by recruiting more Digital Humanitarian volunteers, but wouldn’t that just be asking for a “faster horse”? Just like we’ve already done with MicroMappers for tweets and text messages, we would seek to combine crowdsourcing and Artificial Intelligence to automatically detect features of interest in 3D models. This sounds to me like an excellent research project for a research institute engaged in advanced computing R&D.

I would love to see the results of this applied research integrated directly within MicroMappers. This would allow us to integrate the results of social media analysis via MicroMappers (e.g, tweets, Instagram pictures, YouTube videos) directly with the results of satellite imagery analysis as well as 2D and 3D aerial imagery analysis generated via MicroMappers.

Anyone interested in working on this?