
My team at QCRI just published their latest findings on our ongoing crisis computing and humanitarian technology research. They focused on UN/OCHA, the international aid agency responsible for coordinating humanitarian efforts across the UN system. “When disasters occur, OCHA must quickly make decisions based on the most complete picture of the situation they can obtain,” but “given that complete knowledge of any disaster event is not possible, they gather information from myriad available sources, including social media.” QCRI’s latest research, which also drew on multiple interviews, shows how “state-of-the-art social media processing methods can be used to produce information in a format that takes into account what large international humanitarian organizations require to meet their constantly evolving needs.”
QCRI’s new study (PDF) focuses specifically on the relief efforts in response to Typhoon Yolanda (known locally as Haiyan). “When Typhoon Yolanda struck the Philippines, the combination of widespread network access, high Twitter use, and English proficiency led to many located in the Philippines to tweet about the typhoon in English. In addition, outsiders located elsewhere tweeted about the situation, leading to millions of English-language tweets that were broadcast about the typhoon and its aftermath.”
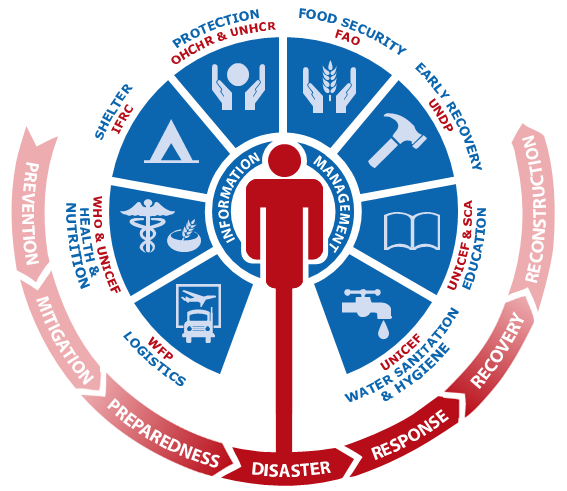
When disasters like Yolanda occur, the UN uses the Multi Cluster/Sector Initial Rapid Assessment (MIRA) survey to assess the needs of affected populations. “The first step in the MIRA process is to produce a ‘Situation Analysis’ report,” which is produced within the first 48 hours of a disaster. Since the Situation Analysis needs to be carried out very quickly, “OCHA is open to using new sources—including social media communications—to augment the information that they and partner organizations so desperately need in the first days of the immediate post-impact period. As these organizations work to assess needs and distribute aid, social media data can potentially provide evidence in greater numbers than what individuals and small teams are able to collect on their own.”
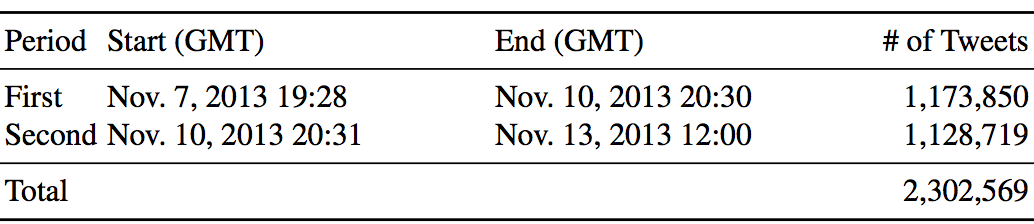
My QCRI colleagues therefore analyzed the 2 million+ Yolanda-related tweets published between November 7-13, 2013 to assess whether any of these could have augmented OCHA’s situational awareness at the time. (OCHA interviewees stated that this “six-day period would be of most interest to them”). QCRI subsequently divided the tweets into two periods:
Next, colleagues geo-located the tweets by administrative region and compared the frequency of tweets in each region with the number of people who were later found to have been affected in the respective region. The result of this analysis is displayed below (click to enlarge).

While the “activity on Twitter was in general more significant in regions heavily affected by the typhoon, the correlation is not perfect.” This should not come as a surprise. This analysis is nevertheless a “worthwhile exercise, as it can prove useful in some circumstances.” In addition, knowing exactly what kinds of biases exist on Twitter, and which are “likely to continue is critical for OCHA to take into account as they work to incorporate social media data into future response efforts.”
QCRI researchers also analyzed the 2 million+ tweets to determine which contained useful information. An informative tweet is defined as containing “information that helps you understand the situation.” They found that 42%-48% of the 2 million tweets fit this category, which is particularly high. Next, they classified those one million informative tweets using the Humanitarian Cluster System. The Up/Down arrows below indicate a 50%+ increase/decrease of tweets in that category during period 2.

“In the first time period (roughly the first 48 hours), we observe concerns focused on early recovery and education and child welfare. In the second time period, these concerns extend to topics related to shelter, food, nutrition, and water, sanitation and hygiene (WASH). At the same time, there are proportionally fewer tweets regarding telecommunications, and safety and security issues.” The table above shows a “significant increase of useful messages for many clusters between period 1 and period 2. It is also clear that the number of potentially useful tweets in each cluster is likely on the order of a few thousand, which are swimming in the midst of millions of tweets. This point is illustrated by the majority of tweets falling into the ‘None of the above’ category, which is expected and has been shown in previous research.”
My colleagues also examined how “information relevant to each cluster can be further categorized into useful themes.” They used topic modeling to “quickly group thousands of tweets [and] understand the information they contain. In the future, this method can help OCHA staff gain a high- level picture of what type of information to expect from Twitter, and to decide which clusters or topics merit further examination and/or inclusion in the Situation Analysis.” The results of this topic modeling is displayed in the table below (click to enlarge).

When UN/OCHA interviewees were presented with these results, their “feedback was positive and favorable.” One OCHA interviewee noted that this information “could potentially give us an indicator as to what people are talking most about— and, by proxy, apply that to the most urgent needs.” Another interviewee stated that “There are two places in the early hours that I would want this: 1) To add to our internal “one-pager” that will be released in 24-36 hours of an emergency, and 2) the Situation Analysis: [it] would be used as a proxy for need.” Another UN staffer remarked that “Generally yes this [information] is very useful, particularly for building situational awareness in the first 48 hours.” While some of the analysis may at times be too general, an OCHA interviewee “went on to say the table [above] gives a general picture of severity, which is an advantage during those first hours of response.”
As my QCRI team rightly notes, “This validation from UN staff supports our continued work on collecting, labeling, organizing, and presenting Twitter data to aid humanitarian agencies with a focus on their specific needs as they perform quick response procedures.” We are thus on the right track with both our AIDR and MicroMappers platforms. Our task moving forward is to use these platforms to produce the analysis discussed above, and to do so in near real-time. We also need to (radically) diversify our data sources and thus include information from text messages (SMS), mainstream media, Facebook, satellite imagery and aerial imagery (as noted here).
But as I’ve noted before, we also need enlightened policy making to make the most of these next generation humanitarian technologies. This OCHA proposal on establishing specific social media standards for disaster response, and the official social media strategy implemented by the government of the Philippines during disasters serve as excellent examples in this respect.

Lots more on humanitarian technology, innovation, computing as well as policy making in my new book Digital Humanitarians: How Big Data is Changing the Face of Humanitarian Action.

Pingback: OCHA podría incluir redes sociales para mejorar respuesta a desastres | iRescate
Pingback: Social Media, Security, & International Organizations | The Social Politics