Tag Archives: UN

UN Crisis Map of Fiji Uses Aerial Imagery (Updated)

Update 1: The Crisis Map below was produced pro bono by Tonkin + Taylor so they should be credited accordingly.

Update 2: On my analysis of Ovalau below, I’ve been in touch with the excellent team at Tonkin & Taylor. It would seem that the few images I randomly sampled were outliers since the majority of the images taken around Ovalau reportedly show damage, hence the reason for Tonkin & Taylor color-coding the island red. Per the team’s explanation: “[We] have gone through 40 or so photographs of Ovalau. The area is marked red because the majority of photographs meet the definition of severe, i.e.,: 1) More than 50% of all buildings sustaining partial loss of amenity/roof; and 2) More than 20% of damaged buildings with substantial loss of amenity/roof.” Big thanks to the team for their generous time and for their good work on this crisis map.


Fiji Crisis Map

Fiji recently experienced the strongest tropical cyclone in its history. Named Cyclone Winston, the Category 5 Cyclone unleashed 285km/h (180 mph) winds. Total damage is estimated at close to half-a-billion US dollars. Approximately 80% of the country’s population lost power; 40,000 people required immediate assistance; some 24,000 homes were damaged or destroyed leaving around 120,000 people in need of shelter assistance; 43 people tragically lost their lives.

As a World Bank’s consultant on UAVs (aerial robotics), I was asked to start making preparations for the possible deployment of a UAV team to Fiji should an official request be made. I’ve therefore been in close contact with the Civil Aviation Authority of Fiji; and several professional and certified UAV teams as well. The purpose of this humanitarian robotics mission—if requested and authorized by relevant authorities—would be to assess disaster damage in support of the Post Disaster Needs Assessment (PDNA) process. I supported a similar effort last year in neighboring Vanuatu after Cyclone Pam.

World Bank colleagues are currently looking into selecting priority sites for the possible aerial surveys using a sampling method that would make said sites representative of the disaster’s overall impact. This is an approach that we were unable to take in Vanuatu following Cyclone Pam due to the lack of information. As part of this survey sampling effort, I came across the United Nations Office for the Coordination of Humanitarian Affairs (UN/OCHA) crisis map below, which depicts areas of disaster damage.

Fiji Crisis Map 2

I was immediately struck by the fact that the main dataset used to assess the damage depicted on this map comes from (declassified) aerial imagery provided by the Royal New Zealand Air Force (RNZAF). Several hundred high-resolution oblique aerial images populate the crisis map along with dozens of ground-based photographs like the ones below. Note that the positional accuracy of the aerial images is +/- 500m (meaning not particularly accurate).

Fiji_2

Fiji_!

I reached out to OCHA colleagues in Fiji who confirmed that they were using the crisis map as one source of information to get a rough idea about which areas were the most affected.  What makes this data useful, according to OCHA, is that it had good coverage over a large area. In contrast, satellite imagery could only provide small snapshots of random villages which were not as useful for trying to understand the scale and scope of a disasters. The limited value added of satellite imagery was reportedly due to cloud cover, which is typical after atmospheric hazards like Cyclones.

Below is the damage assessment methodology used vis-a-vis the interpret the aerial imagery. Note that this preliminary assessment was not carried out by the UN but rather an independent company.

Fiji Crisis Map 3

  • Severe Building Damage (Red): More than 50% of all buildings sustaining partial loss of amenity/roof or more than 20% of damaged buildings with substantial loss of amenity/roof.
  • Moderate Building Damage (Orange): Damage generally exceeding minor [damage] with up to 50% of all buildings sustaining partial loss of amenity/roof and up to 20% of damaged buildings with substantial loss of amenity/roof.
  • Minor Building Damage (Blue):  Up to 5% of all buildings with partial loss of amenity/roof or up to 1% of damaged buildings with substantial loss of amenity/roof.

The Fiji Crisis Map includes an important note: The primary objective of this preliminary assessment was to communicate rapid high-level building damage trends on a regional scale. This assessment has been undertaken on a regional scale (generally exceeding 100 km2) and thus may not accurately reflect local variation in damage. I wish more crisis maps provided qualifiers like the above. That said, while I haven’t had the time to review the hundreds of aerial images on the crisis map to personally assess the level of damage depicted in each, I was struck by the assessment of Ovalau, which I selected at random.

Fiji Crisis Map 4

As you’ll note, the entire island is color coded as severe damage. But I selected several aerial images at random and none showed severe building damage. The images I reviewed are included below.

Ovalau0 Ovalau1 Ovalau2 Ovalau3

This last one may seem like there is disaster damage but a closer inspection by zooming in reveals that the vast majority of buildings are largely intact.

Ovalau5

I shall investigate this further to better understand the possible discrepancy. In any event, I’m particularly pleased to see the UN (and others) make use of aerial imagery in their disaster damage assessment efforts. I’d also like to see the use of aerial robotics for the collection of very high resolution, orthorectified aerial imagery. But using these robotics solutions to their full potential for damage assessment purposes requires regulatory approval and robust coordination mechanisms. Both are absolutely possible as we demonstrated in neighboring Vanuatu last year.

This is How Social Media Can Inform UN Needs Assessments During Disasters

My team at QCRI just published their latest findings on our ongoing crisis computing and humanitarian technology research. They focused on UN/OCHA, the international aid agency responsible for coordinating humanitarian efforts across the UN system. “When disasters occur, OCHA must quickly make decisions based on the most complete picture of the situation they can obtain,” but “given that complete knowledge of any disaster event is not possible, they gather information from myriad available sources, including social media.” QCRI’s latest research, which also drew on multiple interviews, shows how “state-of-the-art social media processing methods can be used to produce information in a format that takes into account what large international humanitarian organizations require to meet their constantly evolving needs.”

ClusterPic

QCRI’s new study (PDF) focuses specifically on the relief efforts in response to Typhoon Yolanda (known locally as Haiyan). “When Typhoon Yolanda struck the Philippines, the combination of widespread network access, high Twitter use, and English proficiency led to many located in the Philippines to tweet about the typhoon in English. In addition, outsiders located elsewhere tweeted about the situation, leading to millions of English-language tweets that were broadcast about the typhoon and its aftermath.”

When disasters like Yolanda occur, the UN uses the Multi Cluster/Sector Initial Rapid Assessment (MIRA) survey to assess the needs of affected populations. “The first step in the MIRA process is to produce a ‘Situation Analysis’ report,” which is produced within the first 48 hours of a disaster. Since the Situation Analysis needs to be carried out very quickly, “OCHA is open to using new sources—including social media communications—to augment the information that they and partner organizations so desperately need in the first days of the immediate post-impact period. As these organizations work to assess needs and distribute aid, social media data can potentially provide evidence in greater numbers than what individuals and small teams are able to collect on their own.”

My QCRI colleagues therefore analyzed the 2 million+ Yolanda-related tweets published between November 7-13, 2013 to assess whether any of these could have augmented OCHA’s situational awareness at the time. (OCHA interviewees stated that this “six-day period would be of most interest to them”). QCRI subsequently divided the tweets into two periods:

Screen Shot 2015-02-14 at 8.31.58 AM

Next, colleagues geo-located the tweets by administrative region and compared the frequency of tweets in each region with the number of people who were later found to have been affected in the respective region. The result of this analysis is displayed below (click to enlarge).

Screen Shot 2015-02-14 at 8.33.21 AM

While the “activity on Twitter was in general more significant in regions heavily affected by the typhoon, the correlation is not perfect.” This should not come as a surprise. This analysis is nevertheless a “worthwhile exercise, as it can prove useful in some circumstances.” In addition, knowing exactly what kinds of biases exist on Twitter, and which are “likely to continue is critical for OCHA to take into account as they work to incorporate social media data into future response efforts.”

QCRI researchers also analyzed the 2 million+ tweets to determine which  contained useful information. An informative tweet is defined as containing “information that helps you understand the situation.” They found that 42%-48% of the 2 million tweets fit this category, which is particularly high. Next, they classified those one million informative tweets using the Humanitarian Cluster System. The Up/Down arrows below indicate a 50%+ increase/decrease of tweets in that category during period 2.

Screen Shot 2015-02-14 at 8.35.53 AM

“In the first time period (roughly the first 48 hours), we observe concerns focused on early recovery and education and child welfare. In the second time period, these concerns extend to topics related to shelter, food, nutrition, and water, sanitation and hygiene (WASH). At the same time, there are proportionally fewer tweets regarding telecommunications, and safety and security issues.” The table above shows a “significant increase of useful messages for many clusters between period 1 and period 2. It is also clear that the number of potentially useful tweets in each cluster is likely on the order of a few thousand, which are swimming in the midst of millions of tweets. This point is illustrated by the majority of tweets falling into the ‘None of the above’ category, which is expected and has been shown in previous research.”

My colleagues also examined how “information relevant to each cluster can be further categorized into useful themes.” They used topic modeling to “quickly group thousands of tweets [and] understand the information they contain. In the future, this method can help OCHA staff gain a high- level picture of what type of information to expect from Twitter, and to decide which clusters or topics merit further examination and/or inclusion in the Situation Analysis.” The results of this topic modeling is displayed in the table below (click to enlarge).

Screen Shot 2015-02-14 at 8.34.37 AM

When UN/OCHA interviewees were presented with these results, their “feedback was positive and favorable.” One OCHA interviewee noted that this information “could potentially give us an indicator as to what people are talking most about— and, by proxy, apply that to the most urgent needs.” Another interviewee stated that “There are two places in the early hours that I would want this: 1) To add to our internal “one-pager” that will be released in 24-36 hours of an emergency, and 2) the Situation Analysis: [it] would be used as a proxy for need.” Another UN staffer remarked that “Generally yes this [information] is very useful, particularly for building situational awareness in the first 48 hours.” While some of the analysis may at times be too general, an OCHA interviewee “went on to say the table [above] gives a general picture of severity, which is an advantage during those first hours of response.”

As my QCRI team rightly notes, “This validation from UN staff supports our continued work on collecting, labeling, organizing, and presenting Twitter data to aid humanitarian agencies with a focus on their specific needs as they perform quick response procedures.” We are thus on the right track with both our AIDR and MicroMappers platforms. Our task moving forward is to use these platforms to produce the analysis discussed above, and to do so in near real-time. We also need to (radically) diversify our data sources and thus include information from text messages (SMS), mainstream media, Facebook, satellite imagery and aerial imagery (as noted here).

But as I’ve noted before, we also need enlightened policy making to make the most of these next generation humanitarian technologies. This OCHA proposal  on establishing specific social media standards for disaster response, and the official social media strategy implemented by the government of the Philippines during disasters serve as excellent examples in this respect.

bookcover

Lots more on humanitarian technology, innovation, computing as well as policy making in my new book Digital Humanitarians: How Big Data is Changing the Face of Humanitarian Action.

Digital Jedis Complete Response to Typhoon Ruby

Thank you, Digital Jedis!

Every Click you made on MicroMappers was a gift. Typhoon Ruby (Hagupit) disrupted the lives of many and caused damage in regions already affected by previous disasters. As MicroMappers, you gave your time, clicks and skills to make a difference. Catherine, the Head of the UN’s Information Management Unit in the Philippines had this to say: “I would like to thank all the volunteers […] for their invaluable contribution over the past few days. We are lucky that Hagupit [Ruby] made less damages than expected and that the emergency quickly scaled down.”

MM Ruby Tweet Map

MicroMappers and our partners at the Standby Task Force (SBTF) were activated by the United Nations Office for the Coordination of Humanitarian Affairs (OCHA). The Mission?

To augment the situational awareness of humanitarian actors on the ground by making sense of social media generated following the Typhoon.

Over the course of 72 hours, these Digital Jedis united to MicroMap one Click at a time. By reviewing tweets and image, each MicroMapper built collective intelligence and insights that were used to build a comprehensive situational awareness reports and maps for the UN. Many hands, and in this case, Clicks, make light work.

As Catherine rightly notes, there was thankfully less damage than many feared. This explains why our MicroMaps (above and below) are thankfully not riddled with hundreds of markers. In addition, we prioritize quality over quantity at MicroMappers. Our UN partners had specifically asked for tweets related to:

(1) Requests for Help / Needs
(2) Infrastructure Damage
(3) Humanitarian Aid Provided

Together, these tweets—which are mapped above—represented less than 5% of the Ruby-related tweets that were collected during the first 72 hours of the Typhoon making landfall. This doesn’t mean that only 5% of the information on Twitter was relevant for emergency response, however. Indeed, we also tagged tweets that were not related to the above 3 categories but that were still informative. These constituted more than 20% of all tweets collected (which are not included in the map above). In the analysis provided to UN partners, we did include a review of those other relevant tweets.

MM Ruby Tweet Clicker

Some 700 Digital Jedis joined the response online, a new record for MicroMappers! An astounding 50,394 Clicks were made using the Text Clicker pictured above (each tweet was reviewed by at least 3 digital volunteers for quality assurance purposes). And a further 3,555 Clicks were carefully made by the SBTF to geo-locate (map) relevant tweets. In other words, close to 55,000 Clicks went into making the high quality map displayed above! That’s over 12 Clicks per minute non-stop for more than 4,300 consecutive minutes!

MM Ruby Image Map

The United Nations also asked Digital Jedis to identify pictures posted on Twitter that showed disaster damage. Over 30,000 Clicks went into this operation with a further 7,413 Clicks made by the SBTF to map images that showed severe and mild damage. In sum, over 40,000 Clicks went into the MicroMap above. Overall, the entire MicroMappers response was powered by close to 100,000 Clicks!

Screen Shot 2014-12-10 at 8.36.04 AMMM Infographic 2MM Infographic 3

Digital Jedis have yet again shown that together, we can help people get positively involved in their world, even when half-a-globe and many timezones away. Yes, we can and should donate $$ to support relief efforts and good causes around the world but we can also get directly involved by donating our time, or what we call M&M’s, Minutes and Mouse clicks. This year MicroMappers have mobilized to support wildlife protection in Namibia, food security efforts in the Philippines and of course this most recent response to Typhoon Ruby. On that note, thanks again to all volunteers who supported the MicroMappers response to the Typhoon in partnership with the United Nations. You truly are Digital Jedis! And the UK Guardian certainly agrees, check out their article on our digital response.

So what’s next? We will continue to solicit your feedback on how to improve the Clickers and will get started right away. (Add your MicroMappers feedback here). In the meantime, we will leave the Clickers online for newcomers who wish to practice. We are also in touch with the UN and UAV partners in the Philippines as they may soon fly their small, remote-control planes to take aerial photographs over disaster affected areas. If they do, they will send us the photographs for analysis via MicroMappers, so stay tuned.

In closing, MicroMappers was developed by QCRI in partnership SBTF/OCHA. So a million thanks to the QCRI team and SBTF for deploying MicroMappers in support of these digital humanitarian efforts. Special thanks go to Ji Lucas, Jus Mackinnon, ChaTo Castillo, Muhammad Imran, Heather Leson, Sarah Vieweg and last but certainly not least Peter Mosur.

(Ed. note: Blog post was cross-posted from MicroMappers.org. Infrographic uses Infogr.am software)

Calling All Digital Jedis: Support UN Response to Super Typhoon Ruby!

The United Nations has officially activated the Digital Humanitarian Network (DHN) in response to Typhoon Ruby. The DHN serves as the official interface between formal humanitarian organizations and digital volunteer groups from all around the world. These digital volunteers—also known as Digital Jedis— provide humanitarian organizations like the UN and the Red Cross with the “surge” capacity they need to make sense of the “Big Data” that gets generated during disasters. This “Big Data” includes large volumes of social media reports and satellite imagery, for example. And there is a lot of this data being generated right now as a result of Super Typhoon Ruby.

Typhoon Ruby

To make sense of this flash flood of information, Digital Jedis use crowdsourcing platforms like MicroMappers, which was developed in partnership with the UN Office for the Coordination of Humanitarian Affairs (OCHA). In their activation of the Digital Humanitarian Network, the UN has requested that Digital Jedis look for Ruby-related tweets that refer to needs, damage & response efforts. They have also asked digital volunteers to identify pictures of damage caused by the Typhoon. These tweets and pictures will then to be added to a live crisis map to augment the UN’s own disaster damage and needs assessment efforts.

You too can be a Digital Jedi. Trust me, MicroMappers is far easier to use than a lightsaber. All it takes is a single Click of the mouse. Yes, it really is that simple. So, if a Digital Jedi you want to be, let your first Click be this one! Following that click will set you on the path to help the United Nation’s important relief efforts in the Philippines. So if you’ve got a bit of time on your hands—even 2 minutes goes a long way—then help us make a meaningful difference in the world, join the Force! And may the Crowd be with Us!

bio

See also: Digital Humanitarians – The Path of the Digtal Jedis

UN Experts Meeting on Humanitarian UAVs

Updated: The Experts Meeting Summary Report is now available here (PDF) and also here as an open, editable Google Doc for comments/questions.

The Humanitarian UAV Network (UAViators) and the United Nations Office for the Coordination of Humanitarian Affairs (OCHA) are co-organizing the first ever “Experts Meeting on Humanitarian UAVs” on November 6th at UN Head-quarters in New York. This full-day strategy meeting, which is co-sponsored by the ICT for Peace Foundation (ICT4Peace) and QCRI, will bring together leading UAV experts (including several members of the UAV Network’s Advisory Board, such as DJI) with seasoned humanitarian professionals from OCHA, WFP, UNICEF, UNHCR, UNDAC, IOM, American Red Cross, European Commission and several other groups that are also starting to use civilian UAVs or have a strong interest in leveraging this technology.

The strategy session, which I’ll be running with my colleague Dan Gilman from OCHA (who authored this Policy Brief on Humanitarian UAVs), will provide an important opportunity for information sharing between UAV experts and humanitarian professionals with the explicit goal of catalyzing direct collabo-ration on the operational use of UAVs in humanitarian settings. UAV experts seek to better understand humanitarian information needs (e.g. UNDAC needs) while humanitarians seek to better understand the challenges and opportunities regarding the rapid deployment of UAVs. In sum, this workshop will bring together 30 experts from different disciplines to pave the way forward for the safe and effective use of humanitarian UAVs.

Screen Shot 2014-06-24 at 2.22.05 PM

The Experts Meeting will include presentations from select participants such as Gene Robinson (leading expert in the use of UAVs for Search & Rescue), Kate Chapman (director of Humanitarian OpenStreetMap), Peter Spruyt (European Commission’s Joint Research Center), Jacob Petersen (Anthea Technologies), Charles Devaney (University of Hawaii), Adam Klaptocz (Drone Adventures & senseFly) and several others. Both Matternet and Google’s Project Wing have been formally invited to present on the latest in UAV payload transportation. (Representatives from the Small UAV Coalition have also been invited to attend).

In addition to the above, the strategy meeting will include dedicated sessions on Ethics, Legislation and Regulation facilitated by Brendan Schulman (leading UAV lawyer) and Kristin Sandvik (Norwegian Center for Humanitarian Studies). Other sessions are expected to focus on Community Engagement, Imagery Analysis as well as Training and Certification. The final session of the day will be dedicated to identifying potential joint pilot projects between UAV pro’s and humanitarian organizations as well as the Humanitarian UAV Network.

UAViators Logo

We will be writing up a summary of the Experts Meeting and making this report publicly available via the Humanitarian UAV Network website. In addition, we plan to post videos of select talks given during the strategy meeting along with accompanying slides. This first meeting at UN Headquarters serves as a spring board for 2 future strategy meetings scheduled for 2015. One of these will be a 3-day high-level & policy-focused international workshop on Humanitarian UAVs, which will be held at the Rockefeller Foundation’s Center in Bellagio, Italy (pictured below in an UAV/aerial image I took earlier this year). This workshop will be run by myself, Dan Gilman and Kristin Sandvik (both of whom are on the Advisory Board of the Humanitarian UAV Network).

ProPic35

Kristin and I are also looking to co-organize another workshop in 2015 to focus specifically on the use of non-lethal UAVs in conflict zones. We are currently talking to prospective donors to make this happen. So stay tuned for more information on all three Humanitarian UAV meetings as one of our key goals at the Humanitarian UAV Network is to raise awareness about humanitarian UAVs by publicly disseminating results & findings from key policy discussions and UAV missions. In the meantime, big thanks to UN/OCHA, ICT4Peace and the Rockefeller Foundation for their crucial and most timely support.

Bio

See also:

  • Humanitarians in the Sky: Using UAVs for Disaster Response [link]
  • Low-Cost UAV Applications for Post-Disaster Damage Assessments: A Streamlined Workflow [Link]
  • Humanitarian UAVs Fly in China After Earthquake [link]
  • Humanitarian UAV Missions During Balkan Floods [link]
  • Humanitarian UAVs in the Solomon Islands [link]
  • UAVs, Community Mapping & Disaster Risk Reduction in Haiti [link]

Humanitarians in the Sky: Using UAVs for Disaster Response

The following is a presentation that I recently gave at the 2014 Remotely Piloted Aircraft Systems Conference (RPAS 2014) held in Brussels, Belgium. The case studies on the Philippines and Haiti are also featured in my upcoming book on “Digital Humanitarians: How Big Data is Changing the Face of Humanitarian Response.” The book is slated to be published in January/February 2015.

Screen Shot 2014-06-24 at 2.20.54 PM

Good afternoon and many thanks to Peter van Blyenburgh for the kind invitation to speak on the role of UAVs in humanitarian contexts beyond the European region. I’m speaking today on behalf of the Humanitarian UAV Network, which brings together seasoned humanitarian professionals with UAV experts to facilitate the use of UAVs in humanitarian settings. I’ll be saying more about the Humanitarian UAV Network (UAViators, pronounced “way-viators”) at the end of my talk.
Screen Shot 2014-06-24 at 2.21.19 PM

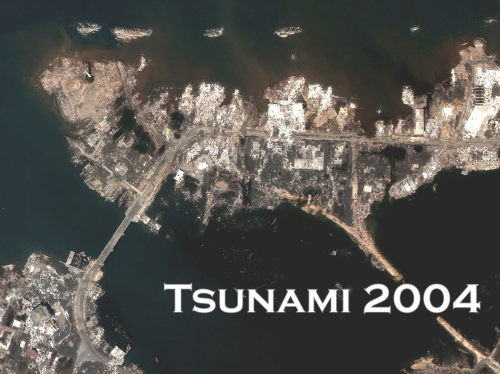
The view from above is key for humanitarian response. Indeed, satellite imagery has played an important role in relief operations since Hurricane Mitch in 1998. And the Indian Ocean Tsunami was the first to be captured from space as the way was still propagating. Some 650 images were produced using data from 15 different sensors. During the immediate aftermath of the Tsunami, satellite images were used at headquarters to assess the extent of the emergency. Later, satellite images were used in the field directly, distributed by the Humanitarian Information Center (HIC) and others to support and coordinate relief efforts. 
Screen Shot 2014-06-24 at 2.21.30 PM

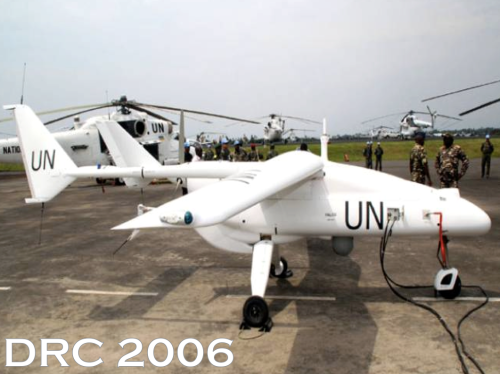
Satellites do present certain limitations, of course. These include cost, the time needed to acquire images, cloud cover, licensing issues and so on. In any event, two years after the Tsunami, an earlier iteration of the UN’s DRC Mission (MONUC) was supported by a European force (EUFOR), which used 4 Belgian UAVs. But I won’t be speaking about this type of UAV. For a variety of reasons, particularly affordability, ease of transport, regulatory concerns, and community engagement, UAVs used in humanitarian response are smaller systems or micro-UAVs that weigh just a few kilograms, such as one fixed-wing displayed below.
Screen Shot 2014-06-24 at 2.21.47 PM

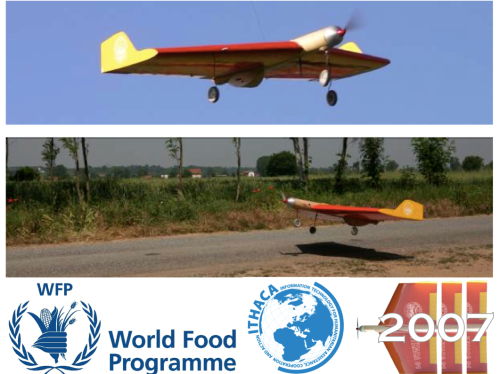
The World Food Program’s UAVs were designed and built at the University of Torino “way back” in 2007. But they’ve been grounded until this year due to lack of legislation in Italy.
Screen Shot 2014-06-24 at 2.22.05 PM

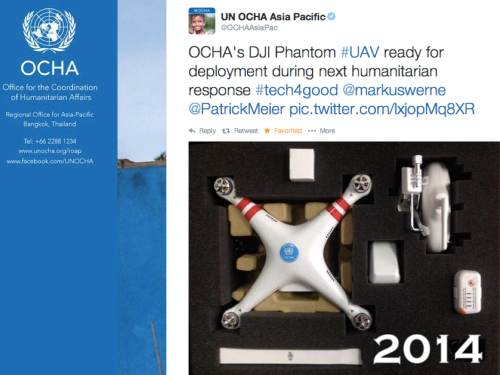
In June 2014, the UN’s Office for the Coordination of Humanitarian Affairs (OCHA) purchased a small quadcopter for use in humanitarian response and advocacy. Incidentally, OCHA is on the Advisory Board of the Humanitarian UAV Network, or UAViators. 
Screen Shot 2014-06-24 at 2.22.41 PM

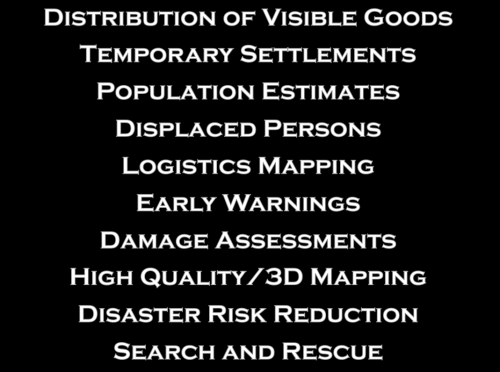
Now, there are many uses cases for the operation of UAVs in humanitarian settings (those listed above are only a subset). All of you here at RPAS 2014 are already very familiar with these applications. So let me jump directly to real world case studies from the Philippines and Haiti.
Screen Shot 2014-06-24 at 2.23.08 PM

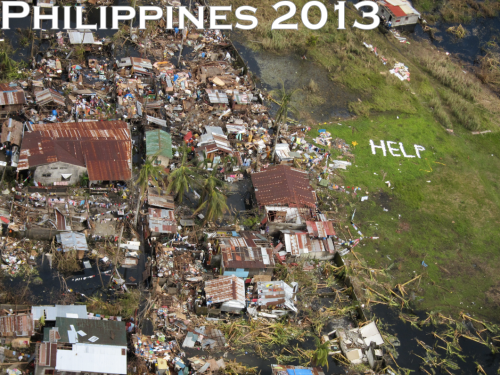
Typhoon Haiyan, or Yolanda as it was known locally, was the most powerful Typhoon in recorded human history to make landfall. The impact was absolutely devastated. I joined UN/OCHA in the Philippines following the Typhoon and was struck by how many UAV projects were being launched. What follows is just a few of said projects.
Screen Shot 2014-06-24 at 2.26.45 PM

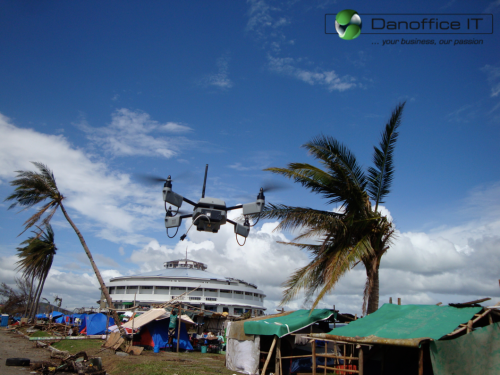
Danoffice IT, a company based in Lausanne, Switzerland, used the Sky-Watch Huginn X1 Quadcopter to support the humanitarian response in Tacloban. The rotary-wing UAV was used to identify where NGOs could set up camp. Later on, the UAV was used to support a range of additional tasks such as identifying which roads were passable for transportation/logistics. The quadcopter was also flown up the coast to assess the damage from the storm surge and flooding and to determine which villages had been most affected. This served to speed up the relief efforts and made the response more targeted vis-a-vis the provision of resources and assistance. Danoffice IT is also on the Board of the Humanitarian UAV Network (UAViators).
Screen Shot 2014-06-24 at 2.27.06 PM

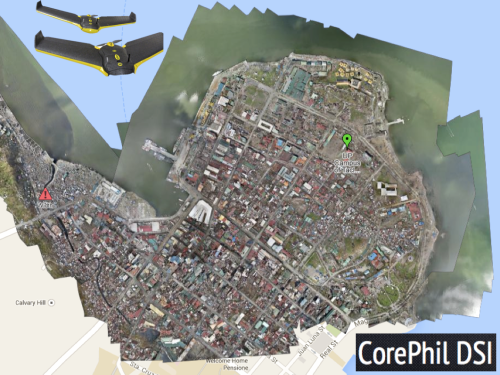
A second UAV project was carried out by local UAV start-up called CorePhil DSI. The team used an eBee to capture aerial imagery of downtown Tacloban, one of the areas hardest-hit by Typhoon Yolanda. They captured 22 Gigabytes of imagery and shared this with the Humanitarian OpenStreetMap Team (HOT) who are also on the Board of UAViators. HOT subsequently crowdsourced the tracing of this imagery (and satellite imagery) to create the most detailed and up-to-date maps of the area. These maps were shared with and used by multiple humanitarian organizations as well as the Filipino Government.
Screen Shot 2014-06-24 at 2.27.28 PM

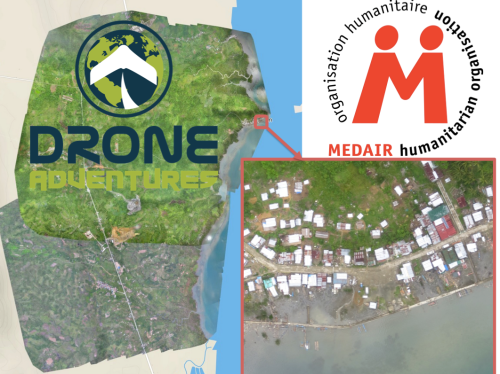
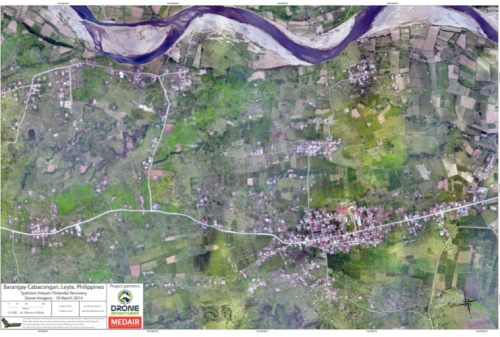
In a third project, the Swiss humanitarian organization Medair partnered with Drone Adventures to create a detailed set of 2D maps and 3D terrain models of the disaster-affected areas in which Medair works. These images were used to inform the humanitarian organization’s recovery and reconstruction programs. To be sure, Medair used the maps and models of Tacloban and Leyte to assist in assessing where the greatest need was and what level of assistance should be given to affected families as they continued to recover. Having these accurate aerial images of the affected areas allowed the Swiss organization to address the needs of individual households and—equally importantly—to advocate on their behalf when necessary.
Screen Shot 2014-06-24 at 3.20.08 PM

Drone Adventures also flew their fixed-wing UAVs (eBee’s) over Dulag, just north of Leyte, where more than 80% of homes and croplands were destroyed during the Typhoon. Medair is providing both materials and expertise to help build new shelters in Dulag. So the aerial imagery is proving invaluable to identify just how much material is needed and where. The captured imagery is also enabling community members themselves to better understand both where the greatest needs are an also what the potential solutions might be.
Screen Shot 2014-06-24 at 2.27.55 PM

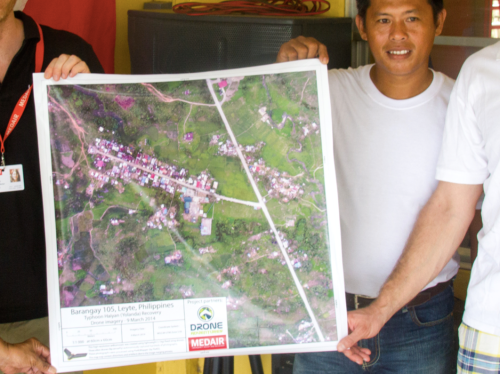
The partners are also committed to Open Data. The imagery captured was made available online and for free, enabling community leaders and humanitarian organizations to use the information to coordinate other reconstruction efforts. In addition, Drone Adventures and Medair presented locally-printed maps to community leaders within 24 hours of flying the UAVs. Some of these maps were printed on rollable, water proof banners, which make them more durable when used in the field.
Screen Shot 2014-06-24 at 2.28.11 PM

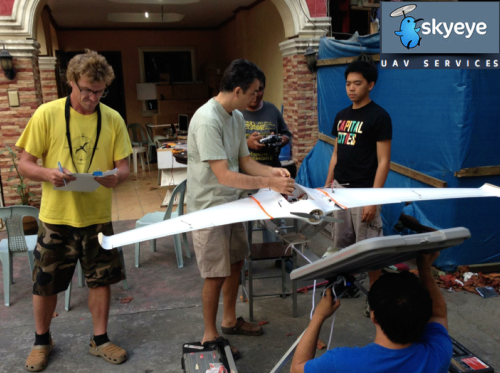
In yet another UAV project, the local Filipino start-up SkyEye Inc partnered with the University of the Philippines in Manila to develop expendable UAVs or xUAVs. The purpose of this initiative is to empower grassroots communities to deploy their own low-cost xUAVs and thus support locally-deployed response efforts. The team has trained 4 out of 5 teams across the Philippines to locally deploy UAVs in preparation for the next Typhoon season. In so doing, they are also transferring math, science and engineering skills to local communities. It is worth noting that community perceptions of UAVs in the Philippines and elsewhere has always been very positive. Indeed, local communities perceive small UAVs as toys more than anything else.
Screen Shot 2014-06-24 at 2.28.37 PM

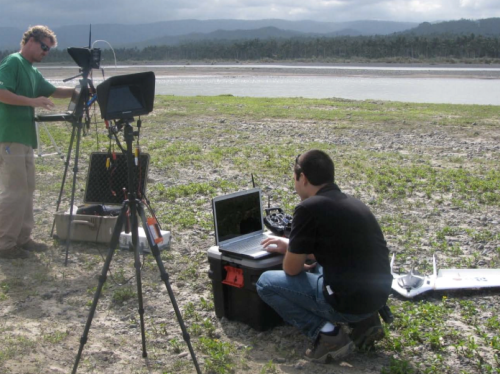
SkyEye worked with this group from the University of Hawaii to create disaster risk reduction models of flood-prone areas.
Screen Shot 2014-06-24 at 2.29.22 PM

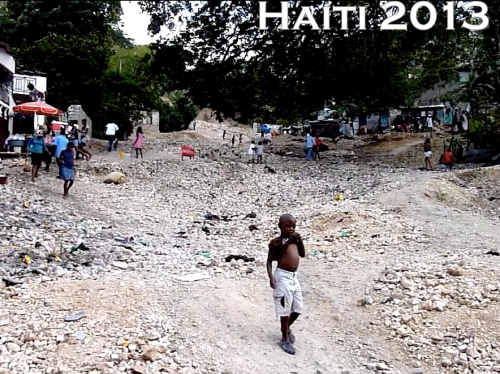
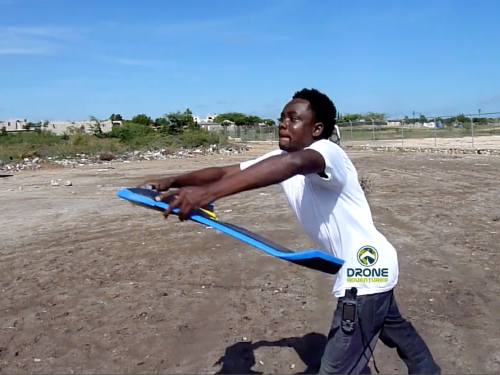
Moving to Haiti, the International Organization for Migration (IOM) has partnered with Drone Adventures and other to produce accurate topographical and 3D maps of disaster prone areas in the Philippines. These aerial images have been used to inform disaster risk reduction and community resilience programs. The UAVs have also enabled IOM to assess destroyed houses and other types of damage caused by floods and droughts. In addition, UAVs have been used to monitor IDP camps, helping aid workers identify when shelters are empty and thus ready to be closed. Furthermore, the high resolution aerial imagery has been used to support a census survey of public building, shelters, hospitals as well as schools.
Screen Shot 2014-06-24 at 2.29.46 PM

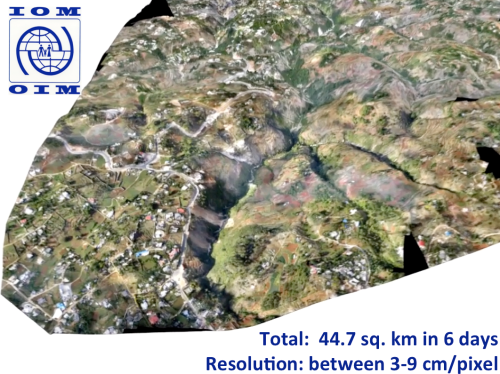
After Hurricane Sandy, for example, aerial imagery enabled IOM to very rapidly assess how many houses had collapsed near Rivière Grise and how many people were affected by the flooding. The aerial imagery was also used to identify areas of standing water where mosquitos and epidemics could easily thrive. Throughout their work with UAVs, IOM has stressed that regular community engagement has been critical for the successful use of UAVs. Indeed, informing local communities of the aerial mapping projects and explaining how the collected information is to be used is imperative. Local capacity building is also paramount, which is why Drone Adventures has trained a local team of Haitians to locally deploy and maintain their own eBee UAV.
Screen Shot 2014-06-24 at 2.30.27 PM

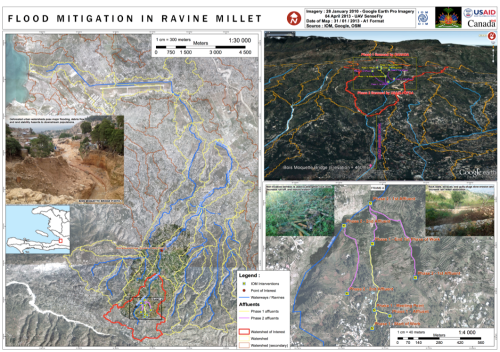
The pictures above and below are some of the information products produced by IOM and Drone Adventures. The 3D model above was used to model flood risk in the area and to inform subsequent disaster risk reduction projects.
Screen Shot 2014-06-24 at 2.30.47 PM

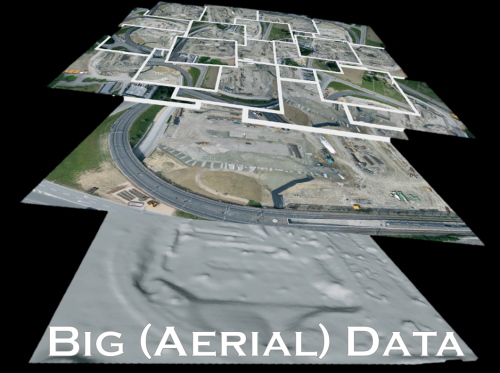
Several colleagues of mine have already noted that aerial imagery presents a Big Data challenge. This means that humanitarian organizations and others will need to use advanced computing (human computing and machine computing) to make sense of Big (Aerial) Data.
Screen Shot 2014-06-24 at 2.31.54 PM

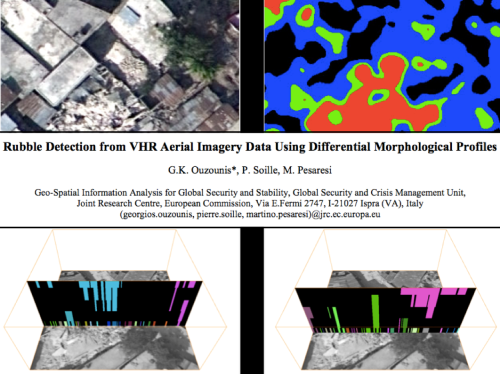
My colleagues at the European Commission’s Joint Research Center (JRC) are already beginning to apply advanced computing to automatically analyze aerial imagery. In the example from Haiti below, the JRC deployed a machine learning classifier to automatically identify rubble left over from the massive earthquake that struck Port-au-Prince in 2010. Their classifier had an impressive accuracy of 92%, “suggesting that the method in its simplest form is sufficiently reliable for rapid damage assessment.”
Screen Shot 2014-06-24 at 2.32.06 PM

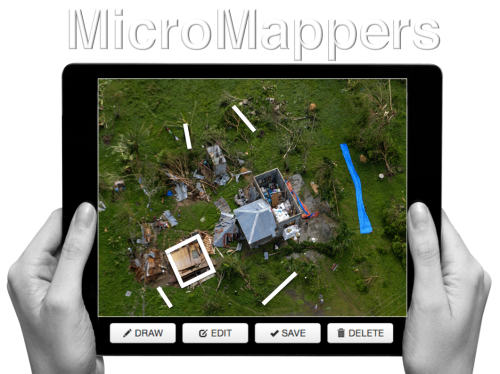
Human computing (or crowdsourcing) can also be used to make sense of Big Data. My team and I at QCRI have partnered with the UN (OCHA) to create the MicroMappers platform, which is a free and open-source tool to make sense of large datasets created during disasters, like aerial data. We have access to thousands of digital volunteers who can rapidly tag and trace aerial imagery; the resulting analysis of this tagging/tracing can be used to increase the situational awareness  of humanitarian organizations in the field.
Screen Shot 2014-06-24 at 2.32.43 PM


Digital volunteers can trace features of interest such as shelters without roofs. Our plan is to subsequently use these traced features as training data to develop machine learning classifiers that can automatically identify these features in future aerial images. We’re also exploring the second use-case depicted below, ie, the rapid transcription of imagery, which can then be automatically geo-tagged and added to a crisis map.
Screen Shot 2014-06-24 at 2.32.55 PM


The increasing use of UAVs during humanitarian disasters is why UAViators, the Humanitarian UAV Network, was launched. Recall the relief operations in response to Typhoon Yolanda; an unprecedented number of UAV projects were in operation. But most operators didn’t know about each other, so they were not coordinating flights let alone sharing imagery with local communities. Since the launch of UAViators, we’ve developed the first ever Code of Conduct for the use of UAVs in humanitarian settings, which includes guidelines on data protection and privacy. We have also drafted an Operational Check-List to educate those who are new to humanitarian UAVs. We are now in the process of carrying out a comprehensive evaluation of UAV models along with cameras, sensors, payload mechanism and image processing software. The purpose of this evaluation is to identify which are the best fit for use by humanitarians in the field. Since the UN and others are looking for training and certification programs, we are actively seeking partners to provide these services.
Screen Shot 2014-06-24 at 2.34.04 PM

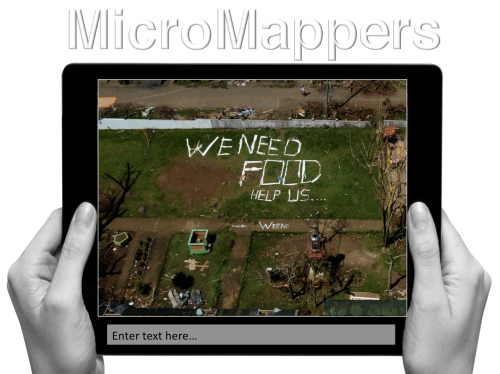
The above goals are all for the medium to long term. More immediately, UAViators is working to educate humanitarian organizations on both the opportunities and challenges of using UAVs in humanitarian settings. UAViators is also working to facilitate the coordinate UAV flights during major disasters, enabling operators to share their flight plans and contact details with each other via the UAViators website. We are also planning to set up an SMS service to enable direct communication between operators and others in the field during UAV flights. Lastly, we are developing an online map for operators to easily share the imagery/videos they are collecting during relief efforts.
Screen Shot 2014-06-24 at 2.34.36 PM

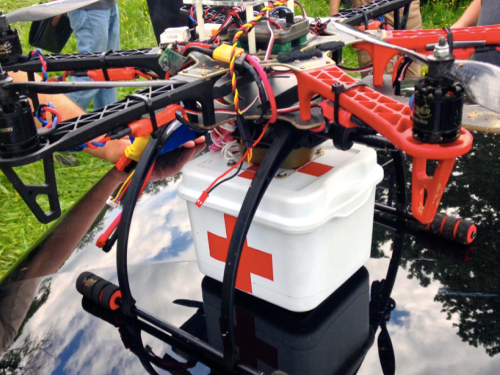
Data collection (imagery capture) is certainly not the only use case for UAVs in humanitarian contexts. The transportation of payloads may play an increasingly important role in the future. To be sure, my colleagues at UNICEF are actively exploring this with a number of partners in Africa.
Screen Shot 2014-06-24 at 2.34.47 PM

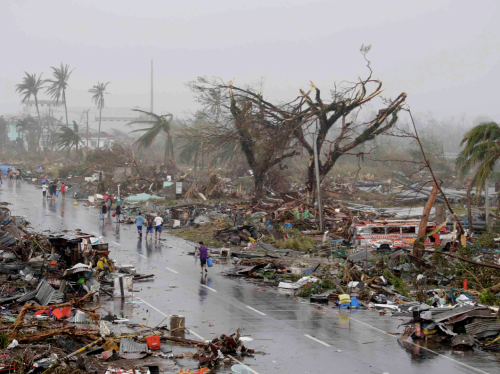
Other sensors also present additional opportunities for the use of UAVs in relief efforts. Sensors can be used to assess the impact of disasters on communication infrastructure, such as cell phone towers, for example. Groups are also looking into the use of UAVs to provide temporary communication infrastructure (“aerial cell phone towers”) following major disasters.
Screen Shot 2014-06-24 at 2.34.59 PM

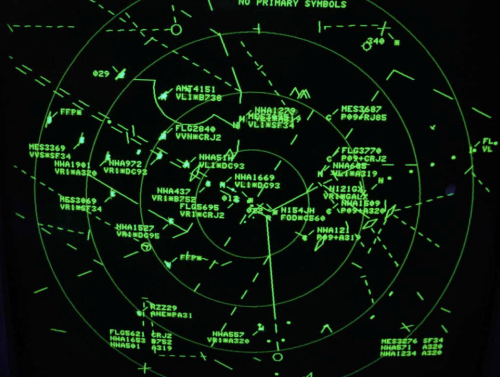
The need for Sense and Avoid systems (a.k.a. Detection & Avoid solutions) has been highlighted in almost every other presentation given at RPAS 2014. We really need this new technology earlier rather than later (and that’s a major  understatement). At the same time, it is important to emphasize that the main added value of UAVs in humanitarian settings is to capture imagery of areas that are overlooked or ignored by mainstream humanitarian relief operations; that is, of areas that are partially or completely disconnected logistically. By definition, disaster-affected communities in these areas are likely to be more vulnerable than others in urban areas. In addition, the airspaces in these disconnected regions are not complex airspaces and thus present fewer challenges around safety and coordination, for example.
Screen Shot 2014-06-24 at 2.35.19 PM

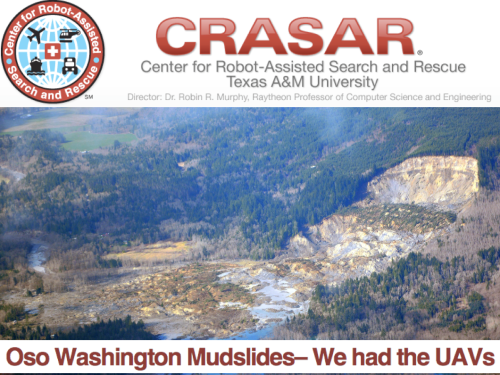
UAVs were ready to go following the mudslides in Oso, Washington back in March of this year. The UAVs were going to be used to look for survivors but the birds were not allowed to fly. The decision to ground UAVs and bar them from supporting relief and rescue efforts will become increasingly untenable when lives are at stake. I genuinely applaud the principle of proportionality applied by the EU and respective RPAS Associations vis-a-vis risks and regulations, but there is one very important variable missing in the proportionality equation: social benefit. Indeed, the cost benefit calculus of UAV risk & regulation in the context of humanitarian use must include the expected benefit of lives saved and suffering alleviated. Let me repeat this to make sure I’m crystal clear: risks must be weighed against potential lives saved.
Screen Shot 2014-06-24 at 2.35.39 PM

At the end of the day, the humanitarian context is different from precision agriculture or other commercial applications of UAVs such as film making. The latter have no relation to the Humanitarian Imperative. Having over-regulation stand in the way of humanitarian principles will simply become untenable. At the same time, the principle of Do No Harm must absolutely be upheld, which is why it features prominently in the Humanitarian UAV Network’s Code of Conduct. In sum, like the Do No Harm principle, the cost benefit analysis of proportionality must include potential or expected benefits as part of the calculus.
Screen Shot 2014-06-24 at 2.35.56 PM

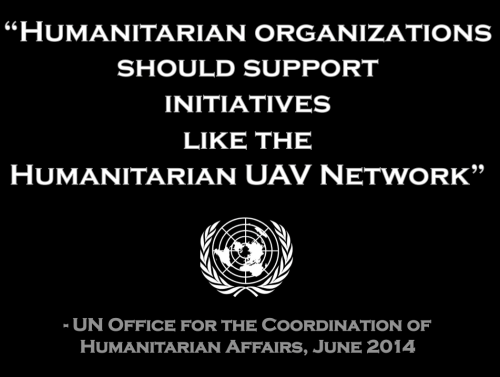
To conclude, a new (forthcoming) policy brief by the UN (OCHA) publicly calls on humanitarian organizations to support initiatives like the Humanitarian UAV Network. This is an important, public endorsement of our work thus far. But we also need support from non-humanitarian organizations like those you represent in this room. For example, we need clarity on existing legislation. Our partners like the UN need to have access to the latest laws by country to inform their use of UAVs following major disasters. We really need your help on this; and we also need your help in identifying which UAVs and related technologies are likely to be a good fit for humanitarians in the field. So if you have some ideas, then please find me during the break, I’d really like to speak with you, thank you!

bio

See Also:

  • Crisis Map of UAV/Aerial Videos for Disaster Response [link]
  • How UAVs are Making a Difference in Disaster Response [link]
  • Humanitarians Using UAVs for Post Disaster Recovery [link]
  • Grassroots UAVs for Disaster Response [link]
  • Using UAVs for Search & Rescue [link]
  • Debrief: UAV/Drone Search & Rescue Challenge [link]
  • Crowdsourcing Analysis of UAV Imagery for Search/Rescue [link]
  • Check-List for Flying UAVs in Humanitarian Settings [link]

Picture Credits:

  • Danoffice IT; Drone Adventures, SkyEye, JRC


MicroMappers Launched for Pakistan Earthquake Response (Updated)

Update 1: MicroMappers is now public! Anyone can join to help the efforts!
Update 2: Results of MicroMappers Response to Pakistan Earthquake [Link]

MicroMappers was not due to launch until next month but my team and I at QCRI received a time-sensitive request by colleagues at the UN to carry out an early test of the platform given yesterday’s 7.7 magnitude earthquake, which killed well over 300 and injured hundreds more in south-western Pakistan.

pakistan_quake_2013

Shortly after this request, the UN Office for the Coordination of Humanitarian Affairs (OCHA) in Pakistan officially activated the Digital Humanitarian Network (DHN) to rapidly assess the damage and needs resulting from the earthquake. The award-winning Standby Volunteer Task Force (SBTF), a founding member of the DHN. teamed up with QCRI to use MicroMappers in response to the request by OCHA-Pakistan. This exercise, however, is purely for testing purposes only. We made this clear to our UN partners since the results may be far from optimal.

MicroMappers is simply a collection of microtasking apps (we call them Clickers) that we have customized for disaster response purposes. We just launched both the Tweet and Image Clickers to support the earthquake relief and may also launch the Tweet and Image GeoClickers as well in the next 24 hours. The TweetClicker is pictured below (click to enlarge).

MicroMappers_Pakistan1

Thanks to our partnership with GNIP, QCRI automatically collected over 35,000 tweets related to Pakistan and the Earthquake (we’re continuing to collect more in real-time). We’ve uploaded these tweets to the TweetClicker and are also filtering links to images for upload to the ImageClicker. Depending on how the initial testing goes, we may be able to invite help from the global digital village. Indeed, “crowdsourcing” is simply another way of saying “It takes a village…” In fact, that’s precisely why MicroMappers was developed, to enable anyone with an Internet connection to become a digital humanitarian volunteer. The Clicker for images is displayed below (click to enlarge).

MicroMappers_Pakistan2

Now, whether this very first test of the Clickers goes well remains to be seen. As mentioned, we weren’t planning to launch until next month. But we’ve already learned heaps from the past few hours alone. For example, while the Clickers are indeed ready and operational, our automatic pre-processing filters are not yet optimized for rapid response. The purpose of these filters is to automatically identify tweets that link to images and videos so that they can be uploaded to the Clickers directly. In addition, while our ImageClicker is operational, our VideoClicker is still under development—as is our TranslateClicker, both of which would have been useful in this response. I’m sure will encounter other issues over the next 24-36 hours. We’re keeping track of these in a shared Google Spreadsheet so we can review them next week and make sure to integrate as much of the feedback as possible before the next disaster strikes.

Incidentally, we (QCRI) also teamed up with the SBTF to test the very first version of the Artificial Intelligence for Disaster Response (AIDR) platform for about six hours. As far as we know, this test represents the first time that machine learning classifiers for disaster resposne were created on the fly using crowdsourcing. We expect to launch AIDR publicly at the 2013 CrisisMappers conference this November (ICCM 2013). We’ll be sure to share what worked and didn’t work during this first AIDR pilot test. So stay tuned for future updates via iRevolution. In the meantime, a big, big thanks to the SBTF Team for rallying so quickly and for agreeing to test the platforms! If you’re interested in becoming a digital humanitarian volunteer, simply join us here.

Bio

Using Big Data to Inform Poverty Reduction Strategies

My colleagues and I at QCRI are spearheading a new experimental Research and Development (R&D) project with the United Nations Development Program (UNDP) team in Cairo, Egypt. Colleagues at Harvard University, MIT and UC Berkeley have also joined the R&D efforts as full-fledged partners. The research question: can an analysis of Twitter traffic in Egypt tell us anything about changes in unemployment and poverty levels? This question was formulated with UNDP’s Cairo-based Team during several conversations I had with them in early 2013.

Egyptian Tweets

As is well known, a major challenge in the development space is the lack of access to timely socio-economic data. So the question here is whether alternative, non-traditional sources of information (such as social media) can provide a timely and “good enough” indication of changing trends. Thanks to our academic partners, we have access to hundreds of millions of Egyptian tweets (both historical and current) along with census and demographic data for ground-truth purposes. If the research yields robust results, then our UNDP colleagues could draw on more real-time data to complement their existing datasets, which may better inform some of their local poverty reduction and development strategies. This more rapid feedback loop could lead to faster economic empowerment for local communities in Egypt. Of course, there are many challenges to working with social data vis-a-vis representation and sample bias. But that is precisely why this kind of experimental research is important—to determine whether any of our results are robust to biases in phone ownership, twitter-use, etc.

bio

Zooniverse: The Answer to Big (Crisis) Data?

Both humanitarian and development organizations are completely unprepared to deal with the rise of “Big Crisis Data” & “Big Development Data.” But many still hope that Big Data is but an illusion. Not so, as I’ve already blogged here, here and here. This explains why I’m on a quest to tame the Big Data Beast. Enter Zooniverse. I’ve been a huge fan of Zooniverse for as long as I can remember, and certainly long before I first mentioned them in this post from two years ago. Zooniverse is a citizen science platform that evolved from GalaxyZoo in 2007. Today, Zooniverse “hosts more than a dozen projects which allow volunteers to participate in scientific research” (1). So, why do I have a major “techie crush” on Zooniverse?

Oh let me count the ways. Zooniverse interfaces are absolutely gorgeous, making them a real pleasure to spend time with; they really understand user-centered design and motivations. The fact that Zooniverse is conversent in multiple disciplines is incredibly attractive. Indeed, the platform has been used to produce rich scientific data across multiple fields such as astronomy, ecology and climate science. Furthermore, this citizen science beauty has a user-base of some 800,000 registered volunteers—with an average of 500 to 1,000 new volunteers joining every day! To place this into context, the Standby Volunteer Task Force (SBTF), a digital humanitarian group has about 1,000 volunteers in total. The open source Zooniverse platform also scales like there’s no tomorrow, enabling hundreds of thousands to participate on a single deployment at any given time. In short, the software supporting these pioneering citizen science projects is well tested and rapidly customizable.

At the heart of the Zooniverse magic is microtasking. If you’re new to microtasking, which I often refer to as “smart crowdsourcing,” this blog post provides a quick introduction. In brief, Microtasking takes a large task and breaks it down into smaller microtasks. Say you were a major (like really major) astro-nomy buff and wanted to tag a million galaxies based on whether they are spiral or elliptical galaxies. The good news? The kind folks at the Sloan Digital Sky Survey have already sent you a hard disk packed full of telescope images. The not-so-good news? A quick back-of-the-envelope calculation reveals it would take 3-5 years, working 24 hours/day and 7 days/week to tag a million galaxies. Ugh!

Screen Shot 2013-03-25 at 4.11.14 PM

But you’re a smart cookie and decide to give this microtasking thing a go. So you upload the pictures to a microtasking website. You then get on Facebook, Twitter, etc., and invite (nay beg) your friends (and as many strangers as you can find on the suddenly-deserted digital streets), to help you tag a million galaxies. Naturally, you provide your friends, and the surprisingly large number good digital Samaritans who’ve just show up, with a quick 2-minute video intro on what spiral and elliptical galaxies look like. You explain that each participant will be asked to tag one galaxy image at a time by simply by clicking the “Spiral” or “Elliptical” button as needed. Inevitably, someone raises their hands to ask the obvious: “Why?! Why in the world would anyone want to tag a zillion galaxies?!”

Well, only cause analyzing the resulting data could yield significant insights that may force a major rethink of cosmology and our place in the Universe. “Good enough for us,” they say. You breathe a sigh of relief and see them off, cruising towards deep space to bolding go where no one has gone before. But before you know it, they’re back on planet Earth. To your utter astonishment, you learn that they’re done with all the tagging! So you run over and check the data to see if they’re pulling your leg; but no, not only are 1 million galaxies tagged, but the tags are highly accurate as well. If you liked this little story, you’ll be glad to know that it happened in real life. GalaxyZoo, as the project was called, was the flash of brilliance that ultimately launched the entire Zooniverse series.

Screen Shot 2013-03-25 at 3.23.53 PM

No, the second Zooniverse project was not an attempt to pull an Oceans 11 in Las Vegas. One of the most attractive features of many microtasking platforms such as Zooniverse is quality control. Think of slot machines. The only way to win big is by having three matching figures such as the three yellow bells in the picture above (righthand side). Hit the jackpot and the coins will flow. Get two out three matching figures (lefthand side), and some slot machines may toss you a few coins for your efforts. Microtasking uses the same approach. Only if three participants tag the same picture of a galaxy as being a spiral galaxy does that data point count. (Of course, you could decide to change the requirement from 3 volunteers to 5 or even 20 volunteers). This important feature allows micro-tasking initiatives to ensure a high standard of data quality, which may explain why many Zooniverse projects have resulted in major scientific break-throughs over the years.

The Zooniverse team is currently running 15 projects, with several more in the works. One of the most recent Zooniverse deployments, Planet Four, received some 15,000 visitors within the first 60 seconds of being announced on BBC TV. Guess how many weeks it took for volunteers to tag over 2,000,0000 satellite images of Mars? A total of 0.286 weeks, i.e., forty-eight hours! Since then, close to 70,000 volunteers have tagged and traced well over 6 million Martian “dunes.” For their Andromeda Project, digital volunteers classified over 7,500 star clusters per hour, even though there was no media or press announce-ment—just one newsletter sent to volunteers. Zooniverse de-ployments also involve tagging earth-based pictures (in contrast to telescope imagery). Take this Serengeti Snapshot deployment, which invited volunteers to classify animals using photographs taken by 225 motion-sensor cameras in Tanzania’s Serengeti National Park. Volunteers swarmed this project to the point that there are no longer any pictures left to tag! So Zooniverse is eagerly waiting for new images to be taken in Serengeti and sent over.

Screen Shot 2013-03-23 at 7.49.56 PM

One of my favorite Zooniverse features is Talk, an online discussion tool used for all projects to provide a real-time interface for volunteers and coordinators, which also facilitates the rapid discovery of important features. This also allows for socializing, which I’ve found to be particularly important with digital humanitarian deployments (such as these). One other major advantage of citizen science platforms like Zooniverse is that they are very easy to use and therefore do not require extensive prior-training (think slot machines). Plus, participants get to learn about new fields of science in the process. So all in all, Zooniverse makes for a great date, which is why I recently reached out to the team behind this citizen science wizardry. Would they be interested in going out (on a limb) to explore some humanitarian (and development) use cases? “Why yes!” they said.

Microtasking platforms have already been used in disaster response, such as MapMill during Hurricane SandyTomnod during the Somali Crisis and CrowdCrafting during Typhoon Pablo. So teaming up with Zooniverse makes a whole lot of sense. Their microtasking software is the most scalable one I’ve come across yet, it is open source and their 800,000 volunteer user-base is simply unparalleled. If Zooniverse volunteers can classify 2 million satellite images of Mars in 48 hours, then surely they can do the same for satellite images of disaster-affected areas on Earth. Volunteers responding to Sandy created some 80,000 assessments of infrastructure damage during the first 48 hours alone. It would have taken Zooniverse just over an hour. Of course, the fact that the hurricane affected New York City and the East Coast meant that many US-based volunteers rallied to the cause, which may explain why it only took 20 minutes to tag the first batch of 400 pictures. What if the hurricane had hit a Caribbean instead? Would the surge of volunteers may have been as high? Might Zooniverse’s 800,000+ standby volunteers also be an asset in this respect?

Screen Shot 2013-03-23 at 7.42.22 PM

Clearly, there is huge potential here, and not only vis-a-vis humanitarian use-cases but development one as well. This is precisely why I’ve already organized and coordinated a number of calls with Zooniverse and various humanitarian and development organizations. As I’ve been telling my colleagues at the United Nations, World Bank and Humanitarian OpenStreetMap, Zooniverse is the Ferrari of Microtasking, so it would be such a big shame if we didn’t take it out for a spin… you know, just a quick test-drive through the rugged terrains of humanitarian response, disaster preparedness and international development. 

bio

Postscript: As some iRevolution readers may know, I am also collaborating with the outstanding team at  CrowdCrafting, who have also developed a free & open-source microtasking platform for citizen science projects (also for disaster response here). I see Zooniverse and CrowCrafting as highly syner-gistic and complementary. Because CrowdCrafting is still in early stages, they fill a very important gap found at the long tail. In contrast, Zooniverse has been already been around for half-a-decade and can caters to very high volume and high profile citizen science projects. This explains why we’ll all be getting on a call in the very near future. 

A Research Framework for Next Generation Humanitarian Technology and Innovation

Humanitarian donors and organizations are increasingly championing innovation and the use of new technologies for humanitarian response. DfID, for example, is committed to using “innovative techniques and technologies more routinely in humanitarian response” (2011). In a more recent strategy paper, DfID confirmed that it would “continue to invest in new technologies” (2012). ALNAP’s important report on “The State of the Humanitarian System” documents the shift towards greater innovation, “with new funds and mechanisms designed to study and support innovation in humanitarian programming” (2012). A forthcoming land-mark study by OCHA makes the strongest case yet for the use and early adoption of new technologies for humanitarian response (2013).

picme8

These strategic policy documents are game-changers and pivotal to ushering in the next wave of humanitarian technology and innovation. That said, the reports are limited by the very fact that the authors are humanitarian professionals and thus not necessarily familiar with the field of advanced computing. The purpose of this post is therefore to set out a more detailed research framework for next generation humanitarian technology and innovation—one with a strong focus on information systems for crisis response and management.

In 2010, I wrote this piece on “The Humanitarian-Technology Divide and What To Do About It.” This divide became increasingly clear to me when I co-founded and co-directed the Harvard Humanitarian Initiative’s (HHI) Program on Crisis Mapping & Early Warning (2007-2009). So I co-founded the annual Inter-national CrisisMappers Conference series in 2009 and have continued to co-organize this unique, cross-disciplinary forum on humanitarian technology. The CrisisMappers Network also plays an important role in bridging the humanitarian and technology divide. My decision to join Ushahidi as Director of Crisis Mapping (2009-2012) was a strategic move to continue bridging the divide—and to do so from the technology side this time.

The same is true of my move to the Qatar Computing Research Institute (QCRI) at the Qatar Foundation. My experience at Ushahidi made me realize that serious expertise in Data Science is required to tackle the major challenges appearing on the horizon of humanitarian technology. Indeed, the key words missing from the DfID, ALNAP and OCHA innovation reports include: Data Science, Big Data Analytics, Artificial Intelligence, Machine Learning, Machine Translation and Human Computing. This current divide between the humanitarian and data science space needs to be bridged, which is precisely why I joined the Qatar Com-puting Research Institute as Director of Innovation; to develop and prototype the next generation of humanitarian technologies by working directly with experts in Data Science and Advanced Computing.

bridgetech

My efforts to bridge these communities also explains why I am co-organizing this year’s Workshop on “Social Web for Disaster Management” at the 2013 World Wide Web conference (WWW13). The WWW event series is one of the most prestigious conferences in the field of Advanced Computing. I have found that experts in this field are very interested and highly motivated to work on humanitarian technology challenges and crisis computing problems. As one of them recently told me: “We simply don’t know what projects or questions to prioritize or work on. We want questions, preferably hard questions, please!”

Yet the humanitarian innovation and technology reports cited above overlook the field of advanced computing. Their policy recommendations vis-a-vis future information systems for crisis response and management are vague at best. Yet one of the major challenges that the humanitarian sector faces is the rise of Big (Crisis) Data. I have already discussed this here, here and here, for example. The humanitarian community is woefully unprepared to deal with this tidal wave of user-generated crisis information. There are already more mobile phone sub-scriptions than people in 100+ countries. And fully 50% of the world’s population in developing countries will be using the Internet within the next 20 months—the current figure is 24%. Meanwhile, close to 250 million people were affected by disasters in 2010 alone. Since then, the number of new mobile phone subscrip-tions has increased by well over one billion, which means that disaster-affected communities today are increasingly likely to be digital communities as well.

In the Philippines, a country highly prone to “natural” disasters, 92% of Filipinos who access the web use Facebook. In early 2012, Filipinos sent an average of 2 billion text messages every day. When disaster strikes, some of these messages will contain information critical for situational awareness & rapid needs assess-ment. The innovation reports by DfID, ALNAP and OCHA emphasize time and time again that listening to local communities is a humanitarian imperative. As DfID notes, “there is a strong need to systematically involve beneficiaries in the collection and use of data to inform decision making. Currently the people directly affected by crises do not routinely have a voice, which makes it difficult for their needs be effectively addressed” (2012). But how exactly should we listen to millions of voices at once, let alone manage, verify and respond to these voices with potentially life-saving information? Over 20 million tweets were posted during Hurricane Sandy. In Japan, over half-a-million new users joined Twitter the day after the 2011 Earthquake. More than 177 million tweets about the disaster were posted that same day, i.e., 2,000 tweets per second on average.

Screen Shot 2013-03-20 at 1.42.25 PM

Of course, the volume and velocity of crisis information will vary from country to country and disaster to disaster. But the majority of humanitarian organizations do not have the technologies in place to handle smaller tidal waves either. Take the case of the recent Typhoon in the Philippines, for example. OCHA activated the Digital Humanitarian Network (DHN) to ask them to carry out a rapid damage assessment by analyzing the 20,000 tweets posted during the first 48 hours of Typhoon Pablo. In fact, one of the main reasons digital volunteer networks like the DHN and the Standby Volunteer Task Force (SBTF) exist is to provide humanitarian organizations with this kind of skilled surge capacity. But analyzing 20,000 tweets in 12 hours (mostly manually) is one thing, analyzing 20 million requires more than a few hundred dedicated volunteers. What’s more, we do not have the luxury of having months to carry out this analysis. Access to information is as important as access to food; and like food, information has a sell-by date.

We clearly need a research agenda to guide the development of next generation humanitarian technology. One such framework is proposed her. The Big (Crisis) Data challenge is composed of (at least) two major problems: (1) finding the needle in the haystack; (2) assessing the accuracy of that needle. In other words, identifying the signal in the noise and determining whether that signal is accurate. Both of these challenges are exacerbated by serious time con-straints. There are (at least) two ways too manage the Big Data challenge in real or near real-time: Human Computing and Artificial Intelligence. We know about these solutions because they have already been developed and used by other sectors and disciplines for several years now. In other words, our information problems are hardly as unique as we might think. Hence the importance of bridging the humanitarian and data science communities.

In sum, the Big Crisis Data challenge can be addressed using Human Computing (HC) and/or Artificial Intelligence (AI). Human Computing includes crowd-sourcing and microtasking. AI includes natural language processing and machine learning. A framework for next generation humanitarian technology and inno-vation must thus promote Research and Development (R&D) that apply these methodologies for humanitarian response. For example, Verily is a project that leverages HC for the verification of crowdsourced social media content generated during crises. In contrast, this here is an example of an AI approach to verification. The Standby Volunteer Task Force (SBTF) has used HC (micro-tasking) to analyze satellite imagery (Big Data) for humanitarian response. An-other novel HC approach to managing Big Data is the use of gaming, something called Playsourcing. AI for Disaster Response (AIDR) is an example of AI applied to humanitarian response. In many ways, though, AIDR combines AI with Human Computing, as does MatchApp. Such hybrid solutions should also be promoted   as part of the R&D framework on next generation humanitarian technology. 

There is of course more to humanitarian technology than information manage-ment alone. Related is the topic of Data Visualization, for example. There are also exciting innovations and developments in the use of drones or Unmanned Aerial Vehicles (UAVs), meshed mobile communication networks, hyper low-cost satellites, etc.. I am particularly interested in each of these areas will continue to blog about them. In the meantime, I very much welcome feedback on this post’s proposed research framework for humanitarian technology and innovation.

 bio