Tag Archives: Twitter

New Findings: Rapid Assessment of Disaster Damage Using Social Media

The latest peer-reviewed, scientific research on social media & crisis computing has just been published in the prestigious journal, Science. The authors pose a question that many of us in the international humanitarian space have been asking, debating and answering since 2009: Can social media data aid in disaster response and damage assessment?

hurricane-sandy-social-media
To answer this question, the authors of the new study carry out “a multiscale analysis of Twitter activity before, during, and after Hurricane Sandy” and “examine the online response of 50 metropolitan areas of the US.” They find a “strong relationship between proximity to Sandy’s path and hurricane-related social media activity.” In addition, they “show that real and perceived threats, together with physical disaster effects, are directly observable through the intensity and composition of Twitter’s message stream.”

Screen Shot 2016-03-17 at 12.18.11 PM

What’s more, they actually “demonstrate that per-capita Twitter activity strongly correlates with the per-capita economic damage inflicted by the hurricane.” The authors found these results to hold true for a “wide range of [US-based] disasters and suggest that massive online social networks can be used for rapid assessment of damage caused by a large-scale disaster.”

Screen Shot 2016-03-17 at 12.26.51 PM

Unlike the vast majority of crisis computing studies in the scientific literature, this is one of the few (perhaps the only?) study of its kind that uses actual post-disaster damage data, i.e. actual ground-truthing, to demonstrate that “the per-capita number of Twitter messages corresponds directly to disaster-inflicted monetary damage.” What’s more, “The correlation is especially pronounced for persistent post-disaster activity and is weakest at the peak of the disaster.”

Screen Shot 2016-03-17 at 1.16.11 PM

The authors thus conclude that social media is a “viable platform for preliminary rapid damage assessment in the chaotic time immediately after a disaster.” As such, their results suggest that “officials should pay attention to normalized activity levels, rates of original content creation, and rates of content rebroadcast to identify the hardest hit areas in real time. Immediately after a disaster, they should focus on persistence in activity levels to assess which areas are likely to need the most assistance.”

Screen Shot 2016-03-17 at 12.37.02 PM

In sum, the authors found that “Twitter activity during a large-scale natural disaster—in this instance Hurricane Sandy—is related to the proximity of the region to the path of the hurricane. Activity drops as the distance from the hurricane increases; after a distance of approximately 1200 to 1500 km, the influence of proximity disappears. High-level analysis of the composition of the message stream reveals additional findings. Geo-enriched data (with location of tweets inferred from users’ profiles) show that the areas close to the disaster generate more original content […].”

Five years ago, professional humanitarians were still largely dismissive of social media’s added value in disasters. Three years ago, it was the turn of ivory tower academics in the social sciences to dismiss the value added of social media for disaster response. The criticisms focused on the notion that reports posted on social media were simply untrustworthy and hardly representative. The above peer-reviewed scientific study dismisses these limitations as inconsequential.

Screen Shot 2016-03-17 at 1.11.17 PM

Social Media for Disaster Response – Done Right!

To say that Indonesia’s capital is prone to flooding would be an understatement. Well over 40% of Jakarta is at or below sea level. Add to this a rapidly growing population of over 10 million and you have a recipe for recurring disasters. Increasing the resilience of the city’s residents to flooding is thus imperative. Resilience is the capacity of affected individuals to self-organize effectively, which requires timely decision-making based on accurate, actionable and real-time information. But Jakarta is also flooded with information during disasters. Indeed, the Indonesian capital is the world’s most active Twitter city.

JK1

So even if relevant, actionable information on rising flood levels could somehow be gleaned from millions of tweets in real-time, these reports could be inaccurate or completely false. Besides, only 3% of tweets on average are geo-located, which means any reliable evidence of flooding reported via Twitter is typically not actionable—that is, unless local residents and responders know where waters are rising, they can’t take tactical action in a timely manner. These major challenges explain why most discount the value of social media for disaster response.

But Digital Humanitarians in Jakarta aren’t your average Digital Humanitarians. These Digital Jedis recently launched one of the most promising humanitarian technology initiatives I’ve seen in years. Code named Peta Jakarta, the project takes social media and digital humanitarian action to the next level. Whenever someone posts a tweet with the word banjir (flood), they receive an automated tweet reply from @PetaJkt inviting them to confirm whether they see signs of flooding in their area: “Flooding? Enable geo-location, tweet @petajkt #banjir and check petajakarta.org.” The user can confirm their report by turning geo-location on and simply replying with the keyword banjir or flood. The result gets added to a live, public crisis map, like the one below.

Credit: Peta Jakarta

Over the course of the 2014/2015 monsoon season, Peta Jakarta automatically sent 89,000 tweets to citizens in Jakarta as a call to action to confirm flood conditions. These automated invitation tweets served to inform the user about the project and linked to the video below (via Twitter Cards) to provide simple instructions on how to submit a confirmed report with approximate flood levels. If a Twitter user forgets to turn on the geo-location feature of their smartphone, they receive an automated tweet reminding them to enable geo-location and resubmit their tweet. Finally, the platform “generates a thank you message confirming the receipt of the user’s report and directing them to PetaJakarta.org to see their contribution to the map.” Note that the “overall aim of sending programmatic messages is not to simply solicit a high volume of replies, but to reach active, committed citizen-users willing to participate in civic co-management by sharing nontrivial data that can benefit other users and government agencies in decision-making during disaster scenarios.”

A report is considered verified when a confirmed geo-tagged tweet includes a picture of the flooding, like in the tweet below. These confirmed and verified tweets get automatically mapped and also shared with Jakarta’s Emergency Management Agency (BPBD DKI Jakarta). The latter are directly involved in this initiative since they’re “regularly faced with the difficult challenge of anticipating & responding to floods hazards and related extreme weather events in Jakarta.” This direct partnership also serves to limit the “Data Rot Syndrome” where data is gathered but not utilized. Note that Peta Jakarta is able to carry out additional verification measures by manually assessing the validity of tweets and pictures by cross-checking other Twitter reports from the same district and also by monitoring “television and internet news sites, to follow coverage of flooded areas and cross-check reports.”

Screen Shot 2015-06-29 at 2.38.54 PM

During the latest monsoon season, Peta Jakarta “received and mapped 1,119 confirmed reports of flooding. These reports were formed by 877 users, indicating an average tweet to user ratio of 1.27 tweets per user. A further 2,091 confirmed reports were received without the required geolocation metadata to be mapped, highlighting the value of the programmatic geo-location ‘reminders’ […]. With regard to unconfirmed reports, Peta Jakarta recorded and mapped a total of 25,584 over the course of the monsoon.”

The Live Crisis Maps could be viewed via two different interfaces depending on the end user. For local residents, the maps could be accessed via smartphone with the visual display designed specifically for more tactical decision-making, showing flood reports at the neighborhood level and only for the past hour.

PJ2

For institutional partners, the data is visualized in more aggregate terms for strategic decision-making based trends-analysis and data integration. “When viewed on a desktop computer, the web-application scaled the map to show a situational overview of the city.”

Credit: Peta Jakarta

Peta Jakarta has “proven the value and utility of social media as a mega-city methodology for crowdsourcing relevant situational information to aid in decision-making and response coordination during extreme weather events.” The initiative enables “autonomous users to make independent decisions on safety and navigation in response to the flood in real-time, thereby helping increase the resilience of the city’s residents to flooding and its attendant difficulties.” In addition, by “providing decision support at the various spatial and temporal scales required by the different actors within city, Peta Jakarta offers an innovative and inexpensive method for the crowdsourcing of time-critical situational information in disaster scenarios.” The resulting confirmed and verified tweets were used by BPBD DKI Jakarta to “cross-validate formal reports of flooding from traditional data sources, supporting the creation of information for flood assessment, response, and management in real-time.”


My blog post is based several conversations I had with Peta Jakarta team and on this white paper, which was just published a week ago. The report runs close to 100 pages and should absolutely be considered required reading for all Digital Humanitarians and CrisisMappers. The paper includes several dozen insights which a short blog post simply cannot do justice to. If you can’t find the time to read the report, then please see the key excerpts below. In a future blog post, I’ll describe how the Peta Jakarta team plans to leverage UAVs to complement social media reporting.

  • Extracting knowledge from the “noise” of social media requires designed engagement and filtering processes to eliminate unwanted information, reward valuable reports, and display useful data in a manner that further enables users, governments, or other agencies to make non-trivial, actionable decisions in a time-critical manner.
  • While the utility of passively-mined social media data can offer insights for offline analytics and derivative studies for future planning scenarios, the critical issue for frontline emergency responders is the organization and coordination of actionable, real-time data related to disaster situations.
  • User anonymity in the reporting process was embedded within the Peta Jakarta project. Whilst the data produced by Twitter reports of flooding is in the public domain, the objective was not to create an archive of users who submitted potentially sensitive reports about flooding events, outside of the Twitter platform. Peta Jakarta was thus designed to anonymize reports collected by separating reports from their respective users. Furthermore, the text content of tweets is only stored when the report is confirmed, that is, when the user has opted to send a message to the @petajkt account to describe their situation. Similarly, when usernames are stored, they are encrypted using a one-way hash function.
  • In developing the Peta Jakarta brand as the public face of the project, it was important to ensure that the interface and map were presented as community-owned, rather than as a government product or academic research tool. Aiming to appeal to first adopters—the young, tech-savvy Twitter-public of Jakarta—the language used in all the outreach materials (Twitter replies, the outreach video, graphics, and print advertisements) was intentionally casual and concise. Because of the repeated recurrence of flood events during the monsoon, and the continuation of daily activities around and through these flood events, the messages were intentionally designed to be more like normal twitter chatter and less like public service announcements.
  • It was important to design the user interaction with PetaJakarta.org to create a user experience that highlighted the community resource element of the project (similar to the Waze traffic app), rather than an emergency or information service. With this aim in mind, the graphics and language are casual and light in tone. In the video, auto-replies, and print advertisements, PetaJakarta.org never used alarmist or moralizing language; instead, the graphic identity is one of casual, opt-in, community participation.
  • The most frequent question directed to @petajkt on Twitter was about how to activate the geo-location function for tweets. So far, this question has been addressed manually by sending a reply tweet with a graphic instruction describing how to activate geo-location functionality.
  • Critical to the success of the project was its official public launch with, and promotion by, the Governor. This endorsement gave the platform very high visibility and increased legitimacy among other government agencies and public users; it also produced a very successful media event, which led substantial media coverage and subsequent public attention.

  • The aggregation of the tweets (designed to match the spatio-temporal structure of flood reporting in the system of the Jakarta Disaster Management Agency) was still inadequate when looking at social media because it could result in their overlooking reports that occurred in areas of especially low Twitter activity. Instead, the Agency used the @petajkt Twitter stream to direct their use of the map and to verify and cross-check information about flood-affected areas in real-time. While this use of social media was productive overall, the findings from the Joint Pilot Study have led to the proposal for the development of a more robust Risk Evaluation Matrix (REM) that would enable Peta Jakarta to serve a wider community of users & optimize the data collection process through an open API.
  • Developing a more robust integration of social media data also means leveraging other potential data sets to increase the intelligence produced by the system through hybridity; these other sources could include, but are not limited to, government, private sector, and NGO applications (‘apps’) for on- the-ground data collection, LIDAR or UAV-sourced elevation data, and fixed ground control points with various types of sensor data. The “citizen-as- sensor” paradigm for urban data collection will advance most effectively if other types of sensors and their attendant data sources are developed in concert with social media sourced information.

This is How Social Media Can Inform UN Needs Assessments During Disasters

My team at QCRI just published their latest findings on our ongoing crisis computing and humanitarian technology research. They focused on UN/OCHA, the international aid agency responsible for coordinating humanitarian efforts across the UN system. “When disasters occur, OCHA must quickly make decisions based on the most complete picture of the situation they can obtain,” but “given that complete knowledge of any disaster event is not possible, they gather information from myriad available sources, including social media.” QCRI’s latest research, which also drew on multiple interviews, shows how “state-of-the-art social media processing methods can be used to produce information in a format that takes into account what large international humanitarian organizations require to meet their constantly evolving needs.”

ClusterPic

QCRI’s new study (PDF) focuses specifically on the relief efforts in response to Typhoon Yolanda (known locally as Haiyan). “When Typhoon Yolanda struck the Philippines, the combination of widespread network access, high Twitter use, and English proficiency led to many located in the Philippines to tweet about the typhoon in English. In addition, outsiders located elsewhere tweeted about the situation, leading to millions of English-language tweets that were broadcast about the typhoon and its aftermath.”

When disasters like Yolanda occur, the UN uses the Multi Cluster/Sector Initial Rapid Assessment (MIRA) survey to assess the needs of affected populations. “The first step in the MIRA process is to produce a ‘Situation Analysis’ report,” which is produced within the first 48 hours of a disaster. Since the Situation Analysis needs to be carried out very quickly, “OCHA is open to using new sources—including social media communications—to augment the information that they and partner organizations so desperately need in the first days of the immediate post-impact period. As these organizations work to assess needs and distribute aid, social media data can potentially provide evidence in greater numbers than what individuals and small teams are able to collect on their own.”

My QCRI colleagues therefore analyzed the 2 million+ Yolanda-related tweets published between November 7-13, 2013 to assess whether any of these could have augmented OCHA’s situational awareness at the time. (OCHA interviewees stated that this “six-day period would be of most interest to them”). QCRI subsequently divided the tweets into two periods:

Screen Shot 2015-02-14 at 8.31.58 AM

Next, colleagues geo-located the tweets by administrative region and compared the frequency of tweets in each region with the number of people who were later found to have been affected in the respective region. The result of this analysis is displayed below (click to enlarge).

Screen Shot 2015-02-14 at 8.33.21 AM

While the “activity on Twitter was in general more significant in regions heavily affected by the typhoon, the correlation is not perfect.” This should not come as a surprise. This analysis is nevertheless a “worthwhile exercise, as it can prove useful in some circumstances.” In addition, knowing exactly what kinds of biases exist on Twitter, and which are “likely to continue is critical for OCHA to take into account as they work to incorporate social media data into future response efforts.”

QCRI researchers also analyzed the 2 million+ tweets to determine which  contained useful information. An informative tweet is defined as containing “information that helps you understand the situation.” They found that 42%-48% of the 2 million tweets fit this category, which is particularly high. Next, they classified those one million informative tweets using the Humanitarian Cluster System. The Up/Down arrows below indicate a 50%+ increase/decrease of tweets in that category during period 2.

Screen Shot 2015-02-14 at 8.35.53 AM

“In the first time period (roughly the first 48 hours), we observe concerns focused on early recovery and education and child welfare. In the second time period, these concerns extend to topics related to shelter, food, nutrition, and water, sanitation and hygiene (WASH). At the same time, there are proportionally fewer tweets regarding telecommunications, and safety and security issues.” The table above shows a “significant increase of useful messages for many clusters between period 1 and period 2. It is also clear that the number of potentially useful tweets in each cluster is likely on the order of a few thousand, which are swimming in the midst of millions of tweets. This point is illustrated by the majority of tweets falling into the ‘None of the above’ category, which is expected and has been shown in previous research.”

My colleagues also examined how “information relevant to each cluster can be further categorized into useful themes.” They used topic modeling to “quickly group thousands of tweets [and] understand the information they contain. In the future, this method can help OCHA staff gain a high- level picture of what type of information to expect from Twitter, and to decide which clusters or topics merit further examination and/or inclusion in the Situation Analysis.” The results of this topic modeling is displayed in the table below (click to enlarge).

Screen Shot 2015-02-14 at 8.34.37 AM

When UN/OCHA interviewees were presented with these results, their “feedback was positive and favorable.” One OCHA interviewee noted that this information “could potentially give us an indicator as to what people are talking most about— and, by proxy, apply that to the most urgent needs.” Another interviewee stated that “There are two places in the early hours that I would want this: 1) To add to our internal “one-pager” that will be released in 24-36 hours of an emergency, and 2) the Situation Analysis: [it] would be used as a proxy for need.” Another UN staffer remarked that “Generally yes this [information] is very useful, particularly for building situational awareness in the first 48 hours.” While some of the analysis may at times be too general, an OCHA interviewee “went on to say the table [above] gives a general picture of severity, which is an advantage during those first hours of response.”

As my QCRI team rightly notes, “This validation from UN staff supports our continued work on collecting, labeling, organizing, and presenting Twitter data to aid humanitarian agencies with a focus on their specific needs as they perform quick response procedures.” We are thus on the right track with both our AIDR and MicroMappers platforms. Our task moving forward is to use these platforms to produce the analysis discussed above, and to do so in near real-time. We also need to (radically) diversify our data sources and thus include information from text messages (SMS), mainstream media, Facebook, satellite imagery and aerial imagery (as noted here).

But as I’ve noted before, we also need enlightened policy making to make the most of these next generation humanitarian technologies. This OCHA proposal  on establishing specific social media standards for disaster response, and the official social media strategy implemented by the government of the Philippines during disasters serve as excellent examples in this respect.

bookcover

Lots more on humanitarian technology, innovation, computing as well as policy making in my new book Digital Humanitarians: How Big Data is Changing the Face of Humanitarian Action.

Could This Be The Most Comprehensive Study of Crisis Tweets Yet?

I’ve been looking forward to blogging about my team’s latest research on crisis computing for months; the delay being due to the laborious process of academic publishing, but I digress. I’m now able to make their  findings public. The goal of their latest research was to “understand what affected populations, response agencies and other stakeholders can expect—and not expect—from [crisis tweets] in various types of disaster situations.”

Screen Shot 2015-02-15 at 12.08.54 PM

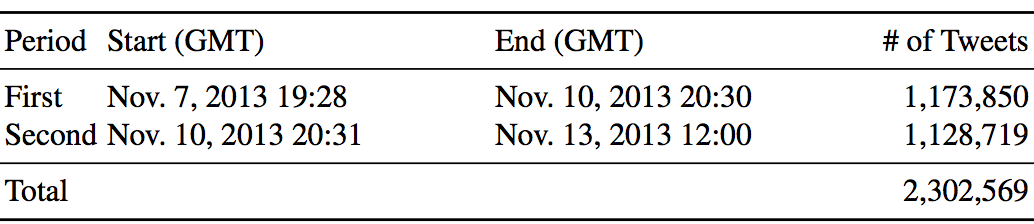
As my colleagues rightly note, “Anecdotal evidence suggests that different types of crises elicit different reactions from Twitter users, but we have yet to see whether this is in fact the case.” So they meticulously studied 26 crisis-related events between 2012-2013 that generated significant activity on twitter. The lead researcher on this project, my colleague & friend Alexandra Olteanu from EPFL, also appears in my new book.

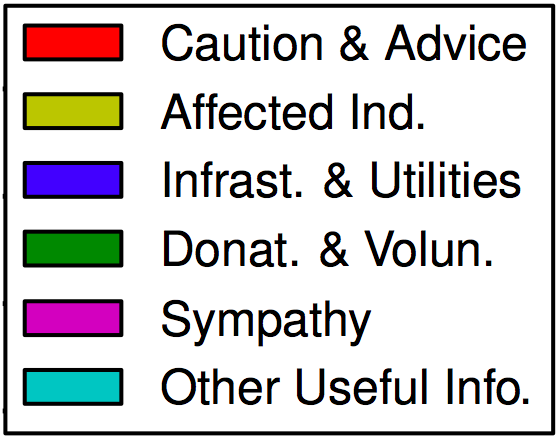
Alexandra and team first classified crisis related tweets based on the following categories (each selected based on previous research & peer-reviewed studies):

Screen Shot 2015-02-15 at 11.01.48 AM

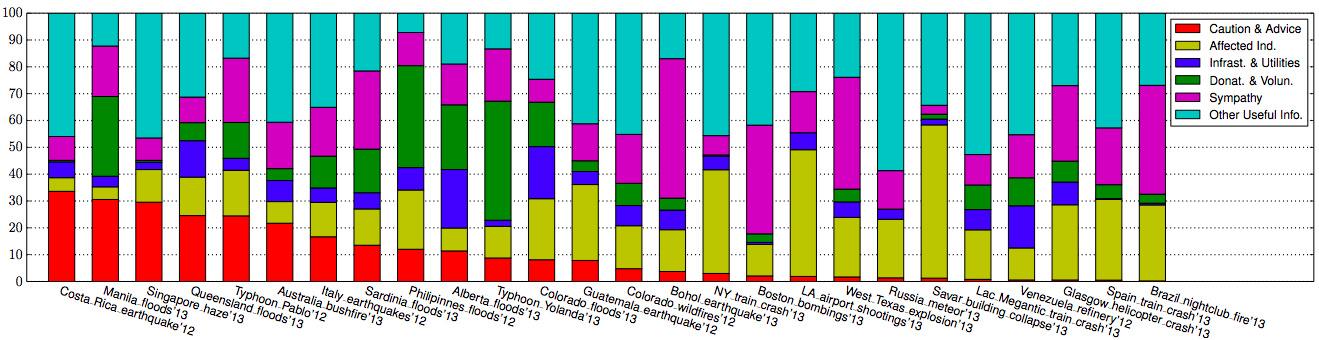
Written in long form: Caution & Advice; Affected Individuals; Infrastructure & Utilities; Donations & Volunteering; Sympathy & Emotional Support, and Other Useful Information. Below are the results of this analysis sorted by descending proportion of Caution & Advice related tweets (click to enlarge).

Screen Shot 2015-02-15 at 10.59.55 AM

The category with the largest number of tweets is “Other Useful Info.” On average 32% of tweets fall into this category (minimum 7%, maximum 59%). Interestingly, it appears that most crisis events that are spread over a relatively large geographical area (i.e., they are diffuse), tend to be associated with the lowest number of “Other” tweets. As my QCRI rightly colleagues note, “it is potentially useful to know that this type of tweet is not prevalent in the diffused events we studied.”

Tweets relating to Sympathy and Emotional Support are present in each of the 26 crises. On average, these account for 20% of all tweets. “The 4 crises in which the messages in this category were more prevalent (above 40%) were all instantaneous disasters.” This finding may imply that “people are more likely to offer sympathy when events […] take people by surprise.”

On average, 20% of tweets in the 26 crises relate to Affected Individuals. “The 5 crises with the largest proportion of this type of information (28%–57%) were human-induced, focalized, and instantaneous. These 5 events can also be viewed as particularly emotionally shocking.”

Tweets related to Donations & Volunteering accounted for 10% of tweets on average. “The number of tweets describing needs or offers of goods and services in each event varies greatly; some events have no mention of them, while for others, this is one of the largest information categories. “

Caution and Advice tweets constituted on average 10% of all tweets in a given crisis. The results show a “clear separation between human-induced hazards and natural: all human induced events have less caution and advice tweets (0%–3%) than all the events due to natural hazards (4%–31%).”

Finally, tweets related to Infrastructure and Utilities represented on average 7% of all tweets posted in a given crisis. The disasters with the highest number of such tweets tended to be flood situations.

In addition to the above analysis, Alexandra et al. also categorized tweets by their source:

Screen Shot 2015-02-15 at 11.23.19 AM

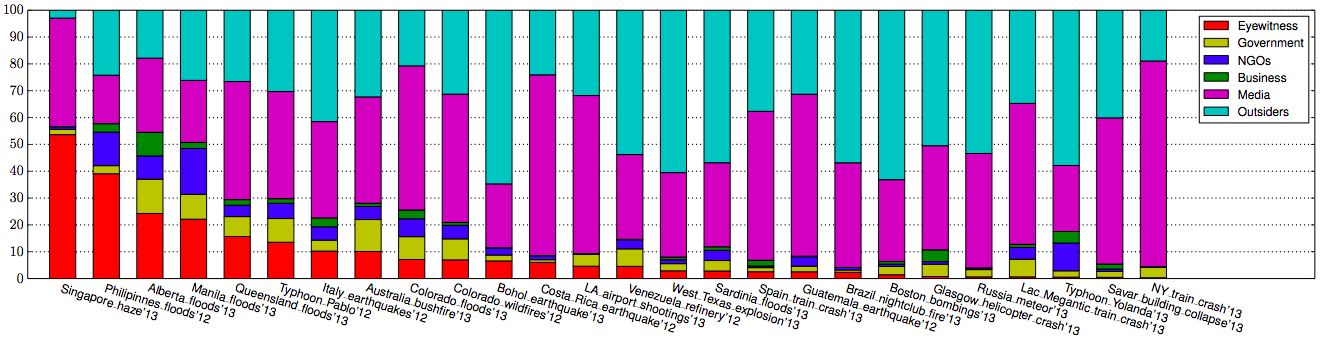
The results depicted below (click to enlarge) are sorted by descending order of eyewitness tweets.

Screen Shot 2015-02-15 at 11.27.57 AM

On average, about 9% of tweets generated during a given crises were written by Eyewitnesses; a figure that increased to 54% for the haze crisis in Singapore. “In general, we find a larger proportion of eyewitness accounts during diffused disasters caused by natural hazards.”

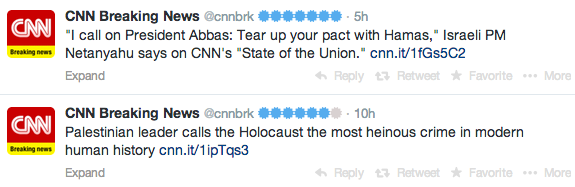
Traditional and/or Internet Media were responsible for 42% of tweets on average. ” The 6 crises with the highest fraction of tweets coming from a media source (54%–76%) are instantaneous, which make “breaking news” in the media.

On average, Outsiders posted 38% of the tweets in a given crisis while NGOs were responsible for about 4% of tweets and Governments 5%. My colleagues surmise that these low figures are due to the fact that both NGOs and governments seek to verify information before they release it. The highest levels of NGO and government tweets occur in response to natural disasters.

Finally, Businesses account for 2% of tweets on average. The Alberta floods of 2013 saw the highest proportion (9%) of tweets posted by businesses.

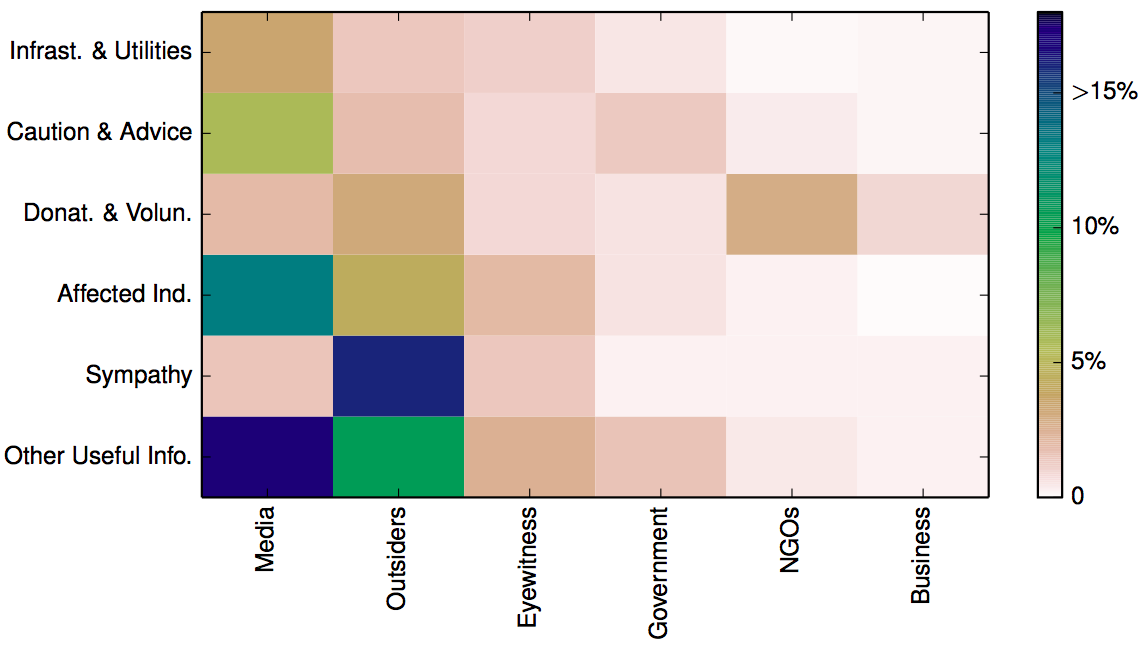
All the above findings are combined and displayed below (click to enlarge). The figure depicts the “average distribution of tweets across crises into combinations of information types (rows) and sources (columns). Rows and columns are sorted by total frequency, starting on the bottom-left corner. The cells in this figure add up to 100%.”

Screen Shot 2015-02-15 at 11.42.39 AM

The above analysis suggests that “when the geographical spread [of a crisis] is diffused, the proportion of Caution and Advice tweets is above the median, and when it is focalized, the proportion of Caution and Advice tweets is below the median. For sources, […] human-induced accidental events tend to have a number of eyewitness tweets below the median, in comparison with intentional and natural hazards.” Additional analysis carried out by my colleagues indicate that “human-induced crises are more similar to each other in terms of the types of information disseminated through Twitter than to natural hazards.” In addition, crisis events that develop instantaneously also look the same when studied through the lens of tweets.

In conclusion, the analysis above demonstrates that “in some cases the most common tweet in one crisis (e.g. eyewitness accounts in the Singapore haze crisis in 2013) was absent in another (e.g. eyewitness accounts in the Savar building collapse in 2013). Furthermore, even two events of the same type in the same country (e.g. Typhoon Yolanda in 2013 and Typhoon Pablo in 2012, both in the Philippines), may look quite different vis-à-vis the information on which people tend to focus.” This suggests the uniqueness of each event.

“Yet, when we look at the Twitter data at a meta-level, our analysis reveals commonalities among the types of information people tend to be concerned with, given the particular dimensions of the situations such as hazard category (e.g. natural, human-induced, geophysical, accidental), hazard type (e.g. earth-quake, explosion), whether it is instantaneous or progressive, and whether it is focalized or diffused. For instance, caution and advice tweets from government sources are more common in progressive disasters than in instantaneous ones. The similarities do not end there. When grouping crises automatically based on similarities in the distributions of different classes of tweets, we also realize that despite the variability, human-induced crises tend to be more similar to each other than to natural hazards.”

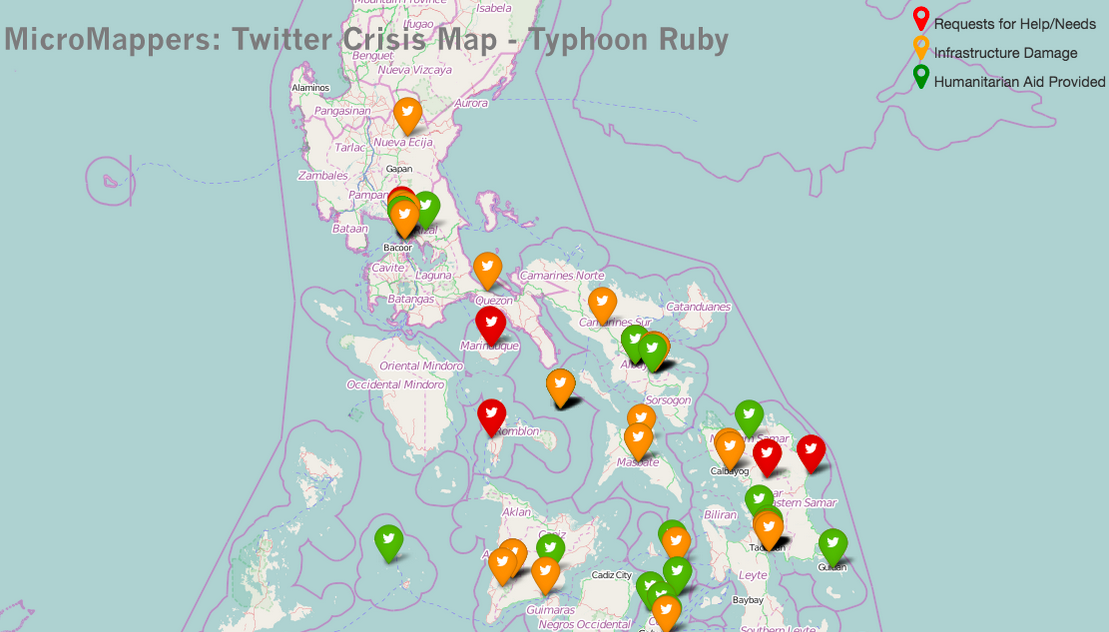
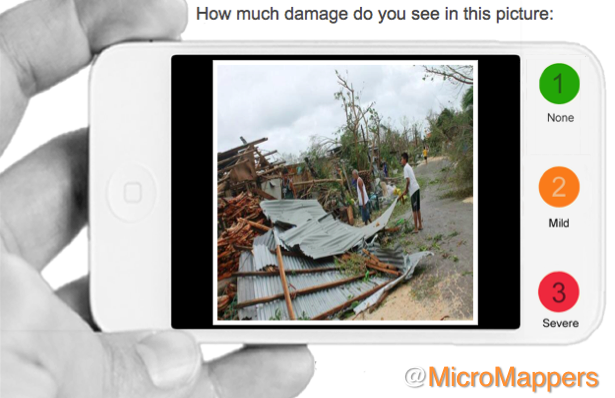
Needless to say, these are exactly the kind of findings that can improve the way we use MicroMappers & other humanitarian technologies for disaster response. So if want to learn more, the full study is available here (PDF). In addition, all the Twitter datasets used for the analysis are available at CrisisLex. If you have questions on the research, simply post them in the comments section below and I’ll ask my colleagues to reply there.

bookcover

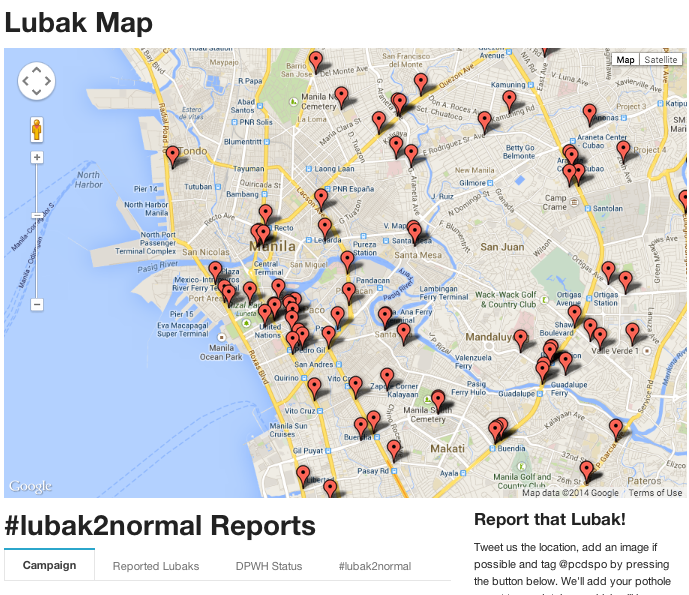
In the meantime, there is a lot more on humanitarian technology and computing in my new book Digital Humanitarians. As I note in said book, we also need enlightened policy making to tap the full potential of social media for disaster response. Technology alone can only take us so far. If we don’t actually create demand for relevant tweets in the first place, then why should social media users supply a high volume of relevant and actionable tweets to support relief efforts? This OCHA proposal on establishing specific social media standards for disaster response, and this official social media strategy developed and implemented by the Filipino government are examples of what enlightened leadership looks like.

Social Media Generates Social Capital: Implications for City Resilience and Disaster Response

A new empirical and peer-reviewed study provides “the first evidence that online networks are able to produce social capital. In the case of bonding social capital, online ties are more effective in forming close networks than theory predicts.” Entitled, “Tweeting Alone? An Analysis of Bridging and Bonding Social Capital in Online Networks,” the study analyzes Twitter data generated during three large events: “the Occupy movement in 2011, the IF Campaign in 2013, and the Chilean Presidential Election of the same year.”

cityres

What is the relationship between social media and social capital formation? More specifically, how do connections established via social media—in this case Twitter—lead to the formation of two specific forms of social capital, bridging and bonding capital? Does the interplay between bridging and bonding capital online differ to what we see in face-to-face world interactions?

“Bonding social capital exists in the strong ties occurring within, often homogeneous, groups—families, friendship circles, work teams, choirs, criminal gangs, and bowling clubs, for example. Bonding social capital acts as a social glue, building trust and norms within groups, but also potentially increasing intolerance and distrust of out-group members. Bridging social capital exists in the ties that link otherwise separate, often heterogeneous, groups—so for example, individuals with ties to other groups, messengers, or more generically the notion of brokers. Bridging social capital allows different groups to share and exchange information, resources, and help coordinate action across diverse interests.” The authors emphasize that “these are not either/or categories, but that in well-functioning societies the two types or dimensions develop together.”

The study uses social network analysis to measure bonding and bridging social capital. More specifically, they use two associated metrics as indicators of social capital: closure and brokerage. “Closure refers to the level of connectedness between particular groups of members within a broader network and encourages the formation of trust and collaboration. Brokerage refers to the existence of structural holes within a network that are ’bridged’ by a particular member of the network. Brokerage permits the transmission of information across the entire network. Social capital, then, is comprised of the combination of these two elements, which interact over time.”

The authors thus analyze the “observed values for closure and brokerage over time and compare them with different simulations based on theoretical network models to show how they compare to what we would expect offline. From this, [they provide an evaluation of the existence and formation of social capital in online networks.”

The results demonstrate that “online networks show evidence of social capital and these networks exhibit higher levels of closure than what would be expected based on theoretical models. However, the presence of organizations and professional brokers is key to the formation of bridging social capital. Similar to traditional (offline) conditions, bridging social capital in online networks does not exist organically and requires the purposive efforts of network members to connect across different groups. Finally, the data show interaction between closure and brokerage goes in the right direction, moving and growing together.”

These conclusions suggest that the same metrics—closure and brokerage—can be used to monitor “City Resilience” before, during and after major disasters. This is of particular interest to me since my team and I at QCRI are collaborating with the Rockefeller Foundation’s 100 Resilient Cities initiative to determine whether social media can indeed help monitor (proxy indicators of) resilience. Recent studies have shown that changes in employment, economic activity and mobility—each of which is are drivers of resilience—can be gleamed from social media.

While more research is needed, the above findings are compelling enough for us to move forward with Rockefeller on our joint project. So we’ll be launching AIRS in early 2015. AIRS, which stands for “Artificial Intelligence for Resilient Societies” is a free and open source platform specifically designed to enable Rockefeller’s partners cities to monitor proxy indicators of resilience on Twitter.

Bio

See also:

  • Using Social Media to Predict Disaster Resilience [link]
  • Social Media = Social Capital = Disaster Resilience? [link]
  • Does Social Capital Drive Disaster Resilience? [link]
  • Digital Social Capital Matters for Resilience & Response [link]

Using Social Media to Anticipate Human Mobility and Resilience During Disasters

The analysis of cell phone data can already be used to predict mobility patterns after major natural disasters. Now, a new peer-reviewed scientific study suggests that travel patterns may also be predictable using tweets generated following large disasters. In “Quantifying Human Mobility Perturbation and Resilience in Hurricane Sandy,” co-authors Qi Wang and John Taylor analyze some 700,000 geo-tagged tweets posted by ~53,000 individuals as they moved around over the course of 12 days. Results of the analysis confirm that “Sandy did impact the mobility patterns of individuals in New York City,” but this “perturbation was surprisingly brief and the mobility patterns encouragingly resilient. This resilience occurred even in the large-scale absence of mobility infrastructure.”

Twitter Mobility

In sum, this new study suggests that “Human mobility appears to possess an inherent resilience—even in perturbed states—such that movement deviations, in aggregate, follow predictable patterns in hurricanes. Therefore, it may be possible to use human mobility data collected in steady states to predict perturbation states during extreme events and, as a result, develop strategies to improve evacuation effectiveness & speed critical disaster response to minimize loss of life and human suffering.”

Authors Wang and Taylor are now turning their attention to “10 other storms and typhoons that they’ve collected data on.” They hope to further demonstrate that quantifying mobility patterns before and after disasters will eventually help cities “predict mobility in the face of a future disaster, and thereby protect and serve residents better.” They also want to “understand where the ‘upper limit’ of resilience lies. ‘After Haiyan,’—the deadliest-ever Philippine Typhoon that struck last November—’there was a total breakdown in mobility patterns,’ says Taylor.”

Of course, Twitter data comes with well-known limitations such as demographic bias, for example. This explains why said data must be interpreted carefully and why the results simply augment rather than replace the analysis of traditional data sources used for damage after needs assessments after disasters.

bio

See also:

  • Social Media & Emergency Management: Supply and Demand [link]
  • Using AIDR to Automatically Classify Disaster Tweets [link]
  • Visualization of Photos Posted to Instagram During Sandy [link]
  • Using Twitter to Map Blackouts During Hurricane Sandy [link]
  • Analyzing Foursquare Check-Ins During Hurricane Sandy [link]

Using Flash Crowds to Automatically Detect Earthquakes & Impact Before Anyone Else

It is said that our planet has a new nervous system; a digital nervous system comprised of digital veins and intertwined sensors that capture the pulse of our planet in near real-time. Next generation humanitarian technologies seek to leverage this new nervous system to detect and diagnose the impact of disasters within minutes rather than hours. To this end, LastQuake may be one of the most impressive humanitarian technologies that I have recently come across. Spearheaded by the European-Mediterranean Seismological Center (EMSC), the technology combines “Flashsourcing” with social media monitoring to auto-detect earthquakes before they’re picked up by seismometers or anyone else.

Screen Shot 2014-10-23 at 5.08.30 PM

Scientists typically draw on ground-motion prediction algorithms and data on building infrastructure to rapidly assess an earthquake’s potential impact. Alas, ground-motion predictions vary significantly and infrastructure data are rarely available at sufficient resolutions to accurately assess the impact of earthquakes. Moreover, a minimum of three seismometers are needed to calibrate a quake and said seismic data take several minutes to generate. This explains why the EMSC uses human sensors to rapidly collect relevant data on earthquakes as these reduce the uncertainties that come with traditional rapid impact assess-ment methodologies. Indeed, the Center’s important work clearly demonstrates how the Internet coupled with social media are “creating new potential for rapid and massive public involvement by both active and passive means” vis-a-vis earthquake detection and impact assessments. Indeed, the EMSC can automatically detect new quakes within 80-90 seconds of their occurrence while simultaneously publishing tweets with preliminary information on said quakes, like this one:

Screen Shot 2014-10-23 at 5.44.27 PM

In reality, the first human sensors (increases in web traffic) can be detected within 15 seconds (!) of a quake. The EMSC’s system continues to auto-matically tweet relevant information (including documents, photos, videos, etc.), for the first 90 minutes after it first detects an earthquake and is also able to automatically create a customized and relevant hashtag for individual quakes.

Screen Shot 2014-10-23 at 5.51.05 PM

How do they do this? Well, the team draw on two real-time crowdsourcing methods that “indirectly collect information from eyewitnesses on earthquakes’ effects.” The first is TED, which stands for Twitter Earthquake Detection–a system developed by the US Geological Survey (USGS). TED filters tweets by key word, location and time to “rapidly detect sharing events through increases in the number of tweets” related to an earthquake. The second method, called “flashsourcing” was developed by the European-Mediterranean to analyze traffic patterns on its own website, “a popular rapid earthquake information website.” The site gets an average of 1.5 to 2 million visits a month. Flashsourcing allows the Center to detect surges in web traffic that often occur after earthquakes—a detection method named Internet Earthquake Detection (IED). These traffic surges (“flash crowds”) are caused by “eyewitnesses converging on its website to find out the cause of their shaking experience” and can be detected by analyzing the IP locations of website visitors.

It is worth emphasizing that both TED and IED work independently from traditional seismic monitoring systems. Instead, they are “based on real-time statistical analysis of Internet-based information generated by the reaction of the public to the shaking.” As EMSC rightly notes in a forthcoming peer-reviewed scientific study, “Detections of felt earthquakes are typically within 2 minutes for both methods, i.e., considerably faster than seismographic detections in poorly instrumented regions of the world.” TED and IED are highly complementary methods since they are based on two entirely “different types of Internet use that might occur after an earthquake.” TED depends on the popularity of Twitter while IED’s effectiveness depends on how well known the EMSC website is in the area affected by an earthquake. LastQuake automatically publishes real-time information on earthquakes by automatically merging real-time data feeds from both TED and IED as well as non-crowdsourcing feeds.

infographie-CSEM-LastQuake2

Lets looks into the methodology that powers IED. Flashsourcing can be used to detect felt earthquakes and provide “rapid information (within 5 minutes) on the local effects of earthquakes. More precisely, it can automatically map the area where shaking was felt by plotting the geographical locations of statistically significant increases in traffic […].” In addition, flashsourcing can also “discriminate localities affected by alarming shaking levels […], and in some cases it can detect and map areas affected by severe damage or network disruption through the concomitant loss of Internet sessions originating from the impacted region.” As such, this “negative space” (where there are no signals) is itself an important signal for damage assessment, as I’ve argued before.

remypicIn the future, EMSC’s flashsourcing system may also be able discriminate power cuts between indoor and outdoor Internet connections at the city level since the system’s analysis of web traffic session will soon be based on web sockets rather than webserver log files. This automatic detection of power failures “is the first step towards a new system capable of detecting Internet interruptions or localized infrastructure damage.” Of course, flashsourcing alone does not “provide a full description of earthquake impact, but within a few minutes, independently of any seismic data, and, at little cost, it can exclude a number of possible damage scenarios, identify localities where no significant damage has occurred and others where damage cannot be excluded.”

Screen Shot 2014-10-23 at 5.59.20 PM

EMSC is complementing their flashsourching methodology with a novel mobile app that quickly enables smartphone users to report about felt earthquakes. Instead of requiring any data entry and written surveys, users simply click on cartoonish-type pictures that best describe the level of intensity they felt when the earthquake (or aftershocks) struck. In addition, EMSC analyzes and manually validates geo-located photos and videos of earthquake effects uploaded to their website (not from social media). The Center’s new app will also make it easier for users to post more pictures more quickly.

CSEM-tweets2

What about typical criticisms (by now broken records) that social media is biased and unreliable (and thus useless)? What about the usual theatrics about the digital divide invalidating any kind of crowdsourcing effort given that these will be heavily biased and hardly representative of the overall population? Despite these already well known short-comings and despite the fact that our inchoate digital networks are still evolving into a new nervous system for our planet, the existing nervous system—however imperfect and immature—still adds value. TED and LastQuake demonstrate this empirically beyond any shadow of a doubt. What’s more, the EMSC have found that crowdsourced, user-generated information is highly reliable: “there are very few examples of intentional misuses, errors […].”

My team and I at QCRI are honored to be collaborating with EMSC on integra-ting our AIDR platform to support their good work. AIDR enables uses to automatically detect tweets of interest by using machine learning (artificial intelligence) which is far more effective searching for keywords. I recently spoke with Rémy Bossu, one masterminds behind the EMSC’s LastQuake project about his team’s plans for AIDR:

“For us AIDR could be a way to detect indirect effects of earthquakes, and notably triggered landslides and fires. Landslides can be the main cause of earthquake losses, like during the 2001 Salvador earthquake. But they are very difficult to anticipate, depending among other parameters on the recent rainfalls. One can prepare a susceptibility map but whether there are or nor landslides, where they have struck and their extend is something we cannot detect using geophysical methods. For us AIDR is a tool which could potentially make a difference on this issue of rapid detection of indirect earthquake effects for better situation awareness.”

In other words, as soon as the EMSC system detects an earthquake, the plan is for that detection to automatically launch an AIDR deployment to automatically identify tweets related to landslides. This integration is already completed and being piloted. In sum, EMSC is connecting an impressive ecosystem of smart, digital technologies powered by a variety of methodologies. This explains why their system is one of the most impressive & proven examples of next generation humanitarian technologies that I’ve come across in recent months.

bio

Acknowledgements: Many thanks to Rémy Bossu for providing me with all the material and graphics I needed to write up this blog post.

See also:

  • Social Media: Pulse of the Planet? [link]
  • Taking Pulse of Boston Bombings [link]
  • The World at Night Through the Eyes of the Crowd [link]
  • The Geography of Twitter: Mapping the Global Heartbeat [link]

Integrating Geo-Data with Social Media Improves Situational Awareness During Disasters

A new data-driven study on the flooding of River Elbe in 2013 (one of the most severe floods ever recorded in Germany) shows that geo-data can enhance the process of extracting relevant information from social media during disasters. The authors use “specific geographical features like hydrological data and digital elevation models to prioritize crisis-relevant twitter messages.” The results demonstrate that an “approach based on geographical relations can enhance information extraction from volunteered geographic information,” which is “valuable for both crisis response and preventive flood monitoring.” These conclusions thus support a number of earlier studies that show the added value of data integration. This analysis also confirms several other key assumptions, which are important for crisis computing and disaster response.

floods elbe

The authors apply a “geographical approach to prioritize [the collection of] crisis-relevant information from social media.” More specifically, they combine information from “tweets, water level measurements & digital elevation models” to answer the following three research questions:

  • Does the spatial and temporal distribution of flood-related tweets actually match the spatial and temporal distribution of the flood phenomenon (despite Twitter bias, potentially false info, etc)?

  • Does the spatial distribution of flood-related tweets differ depending on their content?
  • Is geographical proximity to flooding a useful parameter to prioritize social media messages in order to improve situation awareness?

The authors analyzed just over 60,000 disaster-related tweets generated in Germany during the flooding of River Elbe in June 2013. Only 398 of these tweets (0.7%) contained keywords related to the flooding. The geographical distribution of flood-related tweets versus non-flood related tweets is depicted below (click to enlarge).

Screen Shot 2014-10-04 at 7.04.59 AM

As the authors note, “a considerable amount” of flood-related tweets are geo-located in areas of major flooding. So they tested the statistical correlation between the location of flood-related tweets and the actual flooding, which they found to be “statistically significantly lower compared to non-related Twitter messages.” This finding “implies that the locations of flood-related twitter messages and flood-affected catchments match to a certain extent. In particular this means that mostly people in regions affected by the flooding or people close to these regions posted twitter messages referring to the flood.” To this end, major urban areas like Munich and Hamburg were not the source of most flood-related tweets. Instead, “The majority of tweet referring to the flooding were posted by locals” closer to the flooding.

Given that “most flood-related tweets were posted by locals it seems probable that these messages contain local knowledge only available to people on site.” To this end, the authors analyzed the “spatial distribution of flood-related tweets depending on their content.” The results, depicted below (click to enlarge), show that the geographical distribution of tweets do indeed differ based on their content. This is especially true of tweets containing information about “volunteer actions” and “flood level”. The authors confirm these results are statistically significant when compared with tweets related to “media” and “other” issues.

Screen Shot 2014-10-04 at 7.22.05 AM

These findings also reveal that the content of Twitter messages can be combined into three groups given their distance to actual flooding:

Group A: flood level & volunteer related tweets are closest to the floods.
Group B: tweets on traffic conditions have a medium distance to the floods.
Group C: other and media related tweets a furthest to the flooding.

Tweets belonging to “Group A” yield greater situational awareness. “Indeed, information about current flood levels is crucial for situation awareness and can complement existing water level measurements, which are only available for determined geographical points where gauging stations are located. Since volunteer actions are increasingly organized via social media, this is a type of information which is very valuable and completely missing from other sources.”

Screen Shot 2014-10-04 at 6.55.49 AM

In sum, these results show that “twitter messages that are closest to the flood- affected areas (Group A) are also the most useful ones.” The authors thus conclude that “the distance to flood phenomena is indeed a useful parameter to prioritize twitter messages towards improving situation awareness.” To be sure, the spatial distribution of flood-related tweets is “significantly different from the spatial distribution of off-topic messages.” Whether this is also true of other social media platforms like Instagram and Flickr remains to be seen. This is an important area for future research given the increasing use of pictures posted on social media for rapid damage assessments in the aftermath of disasters.

ImageClicker

“The integration of other official datasets, e.g. precipitation data or satellite images, is another avenue for future work towards better understanding the relations between social media and crisis phenomena from a geographical perspective.” I would add both aerial imagery (captured by UAVs) and data from mainstream news (captured by GDELT) to this data fusion exercise. Of course, the geographical approach described above is not limited to the study of flooding only but could be extended to other natural hazards.

This explains why my colleagues at GeoFeedia may be on the right track with their crisis mapping platform. That said, the main limitation with GeoFeedia and the study above is the fact that only 3% of all tweets are actually geo-referenced. But this need not be a deal breaker. Instead, platforms like GeoFeedia can be complemented by other crisis computing solutions that prioritize the analysis of social media content over geography.

Take the free and open-source “Artificial Intelligence for Disaster Response” (AIDR) platform that my team and I at QCRI are developing. Humanitarian organizations can use AIDR to automatically identify tweets related to flood levels and volunteer actions (deemed to provide the most situational awareness) without requiring that tweets be geo-referenced. In addition, AIDR can also be used to identify eyewitness tweets regardless of whether they refer to flood levels, volunteering or other issues. Indeed, we already demonstrated that eyewitness tweets can be automatically identified with an accuracy of 80-90% using AIDR. And note that AIDR can also be used on geo-tagged tweets only.

The authors of the above study recently go in touch to explore ways that their insights can be used to further improve AIDR. So stay tuned for future updates on how we may integrate geo-data more directly within AIDR to improve situational awareness during disasters.

bio

See also:

  • Debating the Value of Tweets For Disaster Response (Intelligently) [link]
  • Social Media for Emergency Management: Question of Supply and Demand [link]
  • Become a (Social Media) Data Donor and Save a Life [link]

The Filipino Government’s Official Strategy on Crisis Hashtags

As noted here, the Filipino Government has had an official strategy on promoting the use of crisis hashtags since 2012. Recently, the Presidential Communications Development and Strategic Planning Office (PCDSPO) and the Office of the Presidential Spokesperson (PCDSPO-OPS) have kindly shared their their 7-page strategy (PDF), which I’ve summarized below.

Gov Twitter

The Filipino government first endorsed the use of the #rescuePH and #reliefPH in August 2012, when the country was experiencing storm-enhanced monsoon rains. These were initiatives from the private sector. Enough people were using the hashtags to make them trend for days. Eventually, we adopted the hashtags in our tweets for disseminating government advisories, and for collecting reports from the ground. We also ventured into creating new hashtags, and into convincing media outlets to use unified hashtags.” For new hashtags, “The convention is the local name of the storm + PH (e.g., #PabloPH, #YolandaPH). In the case of the heavy monsoon, the local name of the monsoon was used, plus the year (i.e., #Habagat2013).” After agreeing on the hashtags, ” the OPS issued an official statement to the media and the public to carry these hashtags when tweeting about weather-related reports.”

The Office of the Presidential Spokesperson (OPS) would then monitor the hashtags and “made databases and lists which would be used in aid of deployed government frontline personnel, or published as public information.” For example, the OPS  “created databases from reports from #rescuePH, containing the details of those in need of rescue, which we endorsed to the National Disaster Risk Reduction & Management Council, the Coast Guard, and the Department of Transportation and Communications. Needless to say, we assumed that the databases we created using these hashtags would be contaminated by invalid reports, such as spam & other inappropriate messages. We try to filter out these erroneous or malicious reports, before we make our official endorsements to the concerned agencies. In coordination with officers from the Department of Social Welfare and Development, we also monitored the hashtag #reliefPH in order to identify disaster survivors who need food and non-food supplies.”

During Typhoon Haiyan (Yolanda), “the unified hashtag #RescuePH was used to convey lists of people needing help.” This information was then sent to to the National Disaster Risk Reduction & Management Council so that these names could be “included in their lists of people/communities to attend to.” This rescue hashtag was also “useful in solving surplus and deficits of goods between relief operations centers.” So the government encouraged social media users to coordinate their #ReliefPH efforts with the Department of Social Welfare and Development’s on-the-ground relief-coordination efforts. The Government also “created an infographic explaining how to use the hashtag #RescuePH.”

Screen Shot 2014-06-30 at 10.10.51 AM

Earlier, during the 2012 monsoon rains, the government “retweeted various updates on the rescue and relief operations using the hashtag #SafeNow. The hashtag is used when the user has been rescued or knows someone who has been rescued. This helps those working on rescue to check the list of pending affected persons or families, and update it.”

The government’s strategy document also includes an assessment on their use of unified hashtags during disasters. On the positive side, “These hashtags were successful at the user level in Metro Manila, where Internet use penetration is high. For disasters in the regions, where internet penetration is lower, Twitter was nevertheless useful for inter-sector (media – government – NGOs) coordination and information dissemination.” Another positive was the use of a unified hashtag following the heavy monsoon rains of 2012, “which had damaged national roads, inconvenienced motorists, and posing difficulty for rescue operations. After the floods subsided, the government called on the public to identify and report potholes and cracks on the national highways of Metro Manila by tweeting pictures and details of these to the official Twitter account […] , and by using the hashtag #lubak2normal. The information submitted was entered into a database maintained by the Department of Public Works and Highways for immediate action.”

Screen Shot 2014-06-30 at 10.32.57 AM

The hashtag was used “1,007 times within 2 hours after it was launched. The reports were published and locations mapped out, viewable through a page hosted on the PCDSPO website. Considering the feedback, we considered the hashtag a success. We attribute this to two things: one, we used a platform that was convenient for the public to report directly to the government; and two, the hashtag appealed to humor (lubak means potholes or rubble in the vernacular). Furthermore, due to the novelty of it, the media had no qualms helping us spread the word. All the reports we gathered were immediately endorsed […] for roadwork and repair.” This example points to the potential expanded use of social media and crowdsourcing for rapid damage assessments.

On the negative side, the use of #SafeNow resulted mostly in “tweets promoting #safenow, and very few actually indicating that they have been successfully rescued and/or are safe.” The most pressing challenge, however, was filtering. “In succeeding typhoons/instances of flooding, we began to have a filtering problem, especially when high-profile Twitter users (i.e., pop-culture celebrities) began to promote the hashtags through Twitter. The actual tweets that were calls for rescue were being drowned by retweets from fans, resulting in many nonrescue-related tweets […].” This explains the need for Twitter monitoring platforms like AIDR, which is free and open source.

Bio

Got TweetCred? Use it To Automatically Identify Credible Tweets (Updated)

Update: Users have created an astounding one million+ tags over the past few weeks, which will help increase the accuracy of TweetCred in coming months as we use these tags to further train our machine learning classifiers. We will be releasing our Firefox plugin in the next few days. In the meantime, we have just released our paper on TweetCred which describes our methodology & classifiers in more detail.

What if there were a way to automatically identify credible tweets during major events like disasters? Sounds rather far-fetched, right? Think again.

The new field of Digital Information Forensics is increasingly making use of Big Data analytics and techniques from artificial intelligence like machine learning to automatically verify social media. This is how my QCRI colleague ChaTo et al. already predicted both credible and non-credible tweets generated after the Chile Earthquake (with an accuracy of 86%). Meanwhile, my colleagues Aditi, et al. from IIIT Delhi also used machine learning to automatically rank the credibility of some 35 million tweets generated during a dozen major international events such as the UK Riots and the Libya Crisis. So we teamed up with Aditi et al. to turn those academic findings into TweetCred, a free app that identifies credible tweets automatically.

CNN TweetCred

We’ve just launched the very first version of TweetCred—key word being first. This means that our new app is still experimental. On the plus side, since TweetCred is powered by machine learning, it will become increasingly accurate over time as more users make use of the app and “teach” it the difference between credible and non-credible tweets. Teaching TweetCred is as simple as a click of the mouse. Take the tweet below, for example.

ARC TweetCred Teach

TweetCred scores each tweet based based on a 7-point system, the higher the number of blue dots, the more credible the content of the tweet is likely to be. Note that a TweetCred score also takes into account any pictures or videos included in a tweet along with the reputation and popularity of the Twitter user. Naturally, TweetCred won’t always get it right, which is where the teaching and machine learning come in. The above tweet from the American Red Cross is more credible than three dots would suggest. So you simply hover your mouse over the blue dots and click on the “thumbs down” icon to tell TweetCred it got that tweet wrong. The app will then ask you to tag the correct level of credibility for that tweet is.

ARC TweetCred Teach 3

That’s all there is to it. As noted above, this is just the first version of TweetCred. The more all of us use (and teach) the app, the more accurate it will be. So please try it out and spread the word. You can download the Chrome Extension for TweetCred here. If you don’t use Chrome, you can still use the browser version here although the latter has less functionality. We very much welcome any feedback you may have, so simply post feedback in the comments section below. Keep in mind that TweetCred is specifically designed to rate the credibility of disaster/crisis related tweets rather than any random topic on Twitter.

As I note in my book Digital Humanitarians (forthcoming), empirical studies have shown that we’re less likely to spread rumors on Twitter if false tweets are publicly identified by Twitter users as being non-credible. In fact, these studies show that such public exposure increases the number of Twitter users who then seek to stop the spread of said of rumor-related tweets by 150%. But, it makes a big difference whether one sees the rumors first or the tweets dismissing said rumors first. So my hope is that TweetCred will help accelerate Twitter’s self-correcting behavior by automatically identifying credible tweets while countering rumor-related tweets in real-time.

This project is a joint collaboration between IIIT and QCRI. Big thanks to Aditi and team for their heavy lifting on the coding of TweetCred. If the experiments go well, my QCRI colleagues and I may integrate TweetCred within our AIDR (Artificial Intelligence for Disaster Response) and Verily platforms.

Bio

See also:

  • New Insights on How to Verify Social Media [link]
  • Predicting the Credibility of Disaster Tweets Automatically [link]
  • Auto-Ranking Credibility of Tweets During Major Events [link]
  • Auto-Identifying Fake Images on Twitter During Disasters [link]
  • Truth in the Age of Social Media: A Big Data Challenge [link]
  • Analyzing Fake Content on Twitter During Boston Bombings [link]
  • How to Verify Crowdsourced Information from Social Media [link]
  • Crowdsourcing Critical Thinking to Verify Social Media [link]
  • Tweets, Crises and Behavioral Psychology: On Credibility and Information Sharing [link]