
I coined the term “Crisis Mapping Analytics” to highlight the fact that crisis mapping is more valuable when the data that is visually displayed can be analyzed quantitatively within the same interface. Recent crisis mapping initiatives are certainly breaking new ground, but they would be even more useful if they included a meaningful analytical component (which could be used locally). Since the field of conflict early warning typically lags behind in adopting new technologies, we must look to other fields of study for possible insights on mapping analytics.
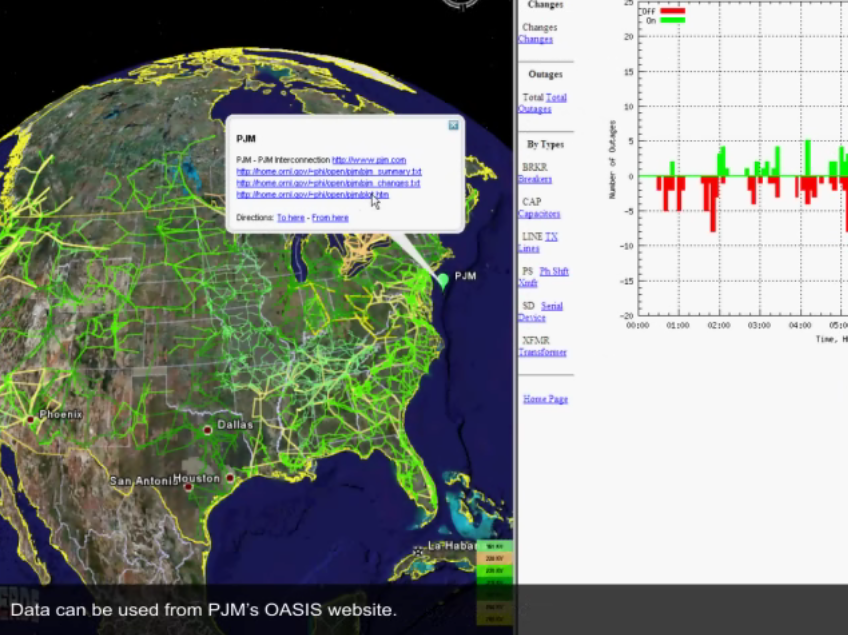
One such field is energy resource management. Researchers at Oak Ridge National Labs have developed a new mapping tool (screenshot above) that combines images from Google Earth and data on electricity consumption to visualize the status of the national electric grid in real-time. According to NetworkWorld, the tool can be used by federal state and local agencies to “coordinate and respond to major problems such as wide-area power outages, natural disasters and other catastrophic events.”
The Visualizing Energy Resources Dynamically on Earth (VERDE) system, announced this week, mashes together images and stats of everything from real-time status of the electric grid and weather information to power grid behavior modeling and simulation. VERDE ultimately enhances situational awareness and speeds recovery times from power outages, ORNL scientists said. The tool also can predict the transmission lines particularly at risk of storm damage as well as the population in specific areas likely to lose power as a result of destructive winds from storms, ORNL said.
“With this tool we are able to monitor individual transmission lines and place the system as a whole in the context of potential impact on population, transportation and critical infrastructures,” said Mallikarjun Shankar of ORNL’s Computational Sciences and Engineering Division in a release.
The team at Oak Ridge just released the video below which demo’s more of VERDE’s functionalities.

Pingback: Crisis Mapping the Conflict in Georgia « iRevolution