
I spent over an hour trying to write this first paragraph last week and still don’t know where to start. I grew up in Nairobi, my parents lived in Kenya for more than 15 years, their house was 5 minutes from Westgate, my brother’s partner is Kenyan and I previously worked for Ushahidi, a Kenyan not-for-profit group. Witnessing the tragedy online as it unfolded in real-time, graphic pictures and all, was traumatic; I did not know the fate of several friends right away. This raw anxiety brought back memories from the devastating Haiti Earthquake of 2010; it took 12 long hours until I got word that my wife and friends had just made it out of a crumbling building.
What to do with this most recent experience and the pain that lingers? Amongst the graphic Westgate horror unfolding via Twitter, I also witnessed the outpouring of love, support and care; the offers of help from Kenyans and Somalis alike; collective grieving, disbelief and deep sadness; the will to remain strong, to overcome, to be united in support of the victims, their families and friends. So I reached out to several friends in Nairobi to ask them if aggregating and surfacing these tweets publicly could serve as a positive testament. They all said yes.
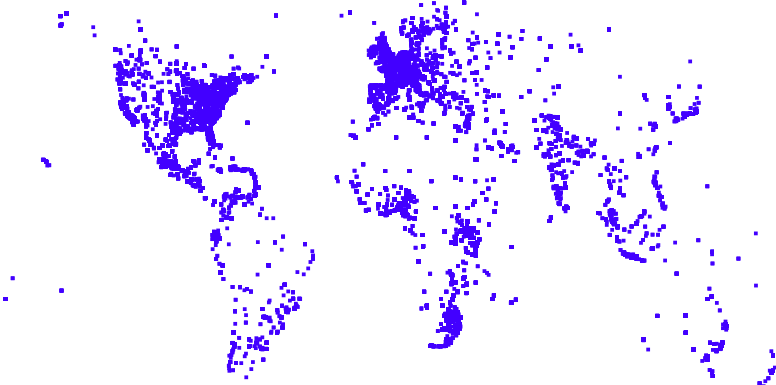
I therefore contacted colleagues at GNIP who kindly let me use their platform to collect more than 740,000 tweets related to the tragedy, starting from several hours before the horror began until the end of the siege. I then reached out to friends Claudia Perlich (data scientist) and Jer Throp (data artist) for their help on this personal project. They both kindly agreed to lend their expertise. Claudia quickly put together the map above based on the location of Twitter users responding to the events in Nairobi (click map to enlarge). The graph below depicts where Twitter users covering the Westgate tragedy were tweeting from during the first 35 hours or so.


We also did some preliminary content analysis of some keywords. The graph below displays the frequency of the terms “We Are One,” “Blood Appeal / Blood Donations,” and “Pray / Prayers” during the four day siege (click to enlarge).

Jer suggested (thankfully) a more compelling and elegant data visualization approach, which we are exploring this week. So we hope to share some initial visuals in the coming days. If you have any specific suggestions on other ways to analyze and visualize the data, please do share them in the comments section below, thank you.

See also: Forensics Analysis of #Westgate Tweets [Link]

Pingback: Forensics Analysis of #Westgate Tweets | iRevolution
Hi Patrick,
Deeply tragic but the outpouring of love and compassion is hopefully helping the healing process we all need.
For visualization ideas, consider:
– a single image made up of all the twitter user pictures in your data-set that could represent a map of Kenya or a image of solidarity or planet-earth in Kenyan colours, etc.
– consider a radial diagram, 6/8/12 zones, each zone representing a single day. for each day, create a tag-cloud that shows the top keywords on day of attack and the days following.
– three column landscape page, each column containing a tag-cloud of:
– tweets by victims of attack
– tweets by Kenyans and the globe on #Westgate
– tweets by attackers
Hope these help.
Best wishes from Cape Town,
Amir
Pingback: Blog posts of the week | marcoRecorder
Hello, how might i find out when the first tweets or reports appeared about terrorists asking hostages to recite passages from Quran? thanks
Hi Margot, thanks for your question, we’re in the process of analyzing the first few hours, so if said passages appear then, will def let you know.