
I was particularly pleased to see this study appear in the top-tier journal, Nature. (Thanks to my colleague Sarah Vieweg for flagging). Earlier studies have shown that “human communications are both temporally & spatially localized following the onset of emergencies, indicating that social propagation is a primary means to propagate situational awareness.” In this new study, the authors analyze crisis events using country-wide mobile phone data. To this end, they also analyze the communication patterns of mobile phone users outside the affected area. So the question driving this study is this: how do the communication patterns of non-affected mobile phone users differ from those affected? Why ask this question? Understanding the communication patterns of mobile phone users outside the affected areas sheds light on how situational awareness spreads during disasters.
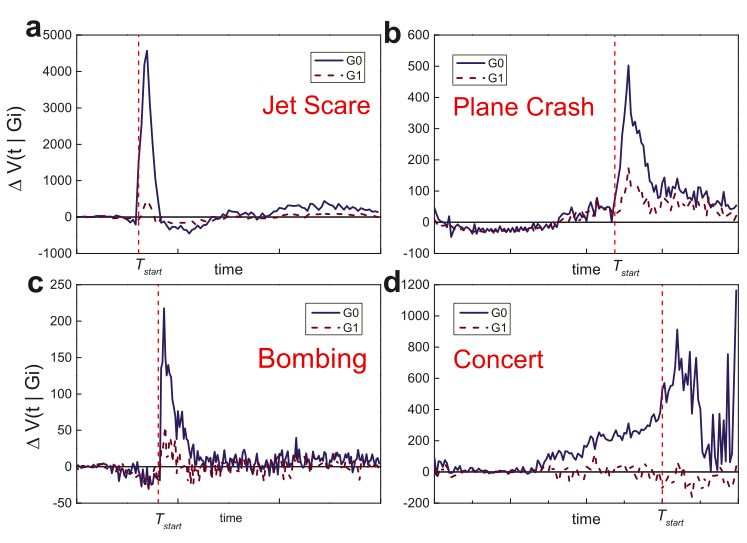
The graphs above (click to enlarge) simply depict the change in call volume for three crisis events and one non-emergency event for the two types of mobile phone users. The set of users directly affected by a crisis is labeled G0 while users they contact during the emergency are labeled G1. Note that G1 users are not affected by the crisis. Since the study seeks to assess how G1 users change their communication patterns following a crisis, one logical question is this: do the call volume of G1 users increase like those of G0 users? The graphs above reveal that G1 and G0 users have instantaneous and corresponding spikes for crisis events. This is not the case for the non-emergency event.
“As the activity spikes for G0 users for emergency events are both temporally and spatially localized, the communication of G1 users becomes the most important means of spreading situational awareness.” To quantify the reach of situational awareness, the authors study the communication patterns of G1 users after they receive a call or SMS from the affected set of G0 users. They find 3 types of communication patterns for G1 users, as depicted below (click to enlarge).
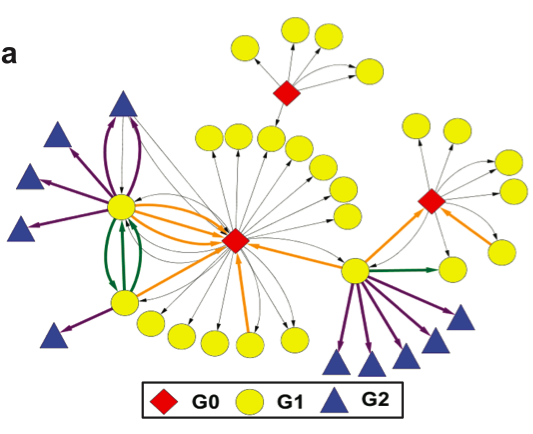
Pattern 1: G1 users call back G0 users (orange edges). Pattern 2: G1 users call forward to G2 users (purple edges). Pattern 3: G1 users call other G1 users (green edges). Which of these 3 patterns is most pronounced during a crisis? Pattern 1, call backs, constitute 25% of all G1 communication responses. Pattern 2, call forwards, constitutes 70% of communications. Pattern 3, calls between G1 users only represents 5% of all communications. This means that the spikes in call volumes shown in the above graphs is overwhelmingly driven by Patterns 1 and 2: call backs and call forwards.
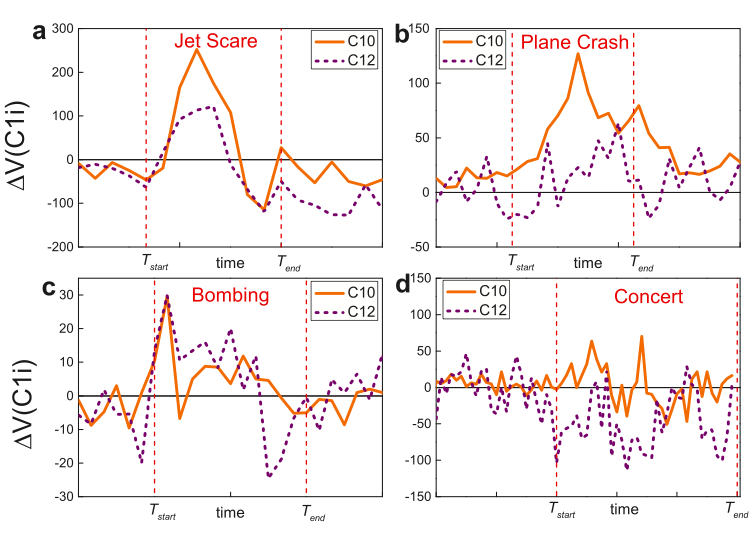
The graphs below (click to enlarge) show call volumes by communication patterns 1 and 2. In these graphs, Pattern 1 is the orange line and Pattern 2 the dashed purple line. In all three crisis events, Pattern 1 (call backs) has clear volume spikes. “That is, G1 users prefer to interact back with G0 users rather than contacting with new users (G2), a phenomenon that limits the spreading of information.” In effect, Pattern 1 is a measure of reciprocal communications and indeed social capital, “representing correspondence and coordination calls between social neighbors.” In contrast, Pattern 2 measures the dissemination of the “dissemination of situational awareness, corresponding to information cascades that penetrate the underlying social network.”
The histogram below shows average levels of reciprocal communication for the 4 events under study. These results clearly show a spike in reciprocal behavior for the three crisis events compared to the baseline. The opposite is true for the non-emergency event.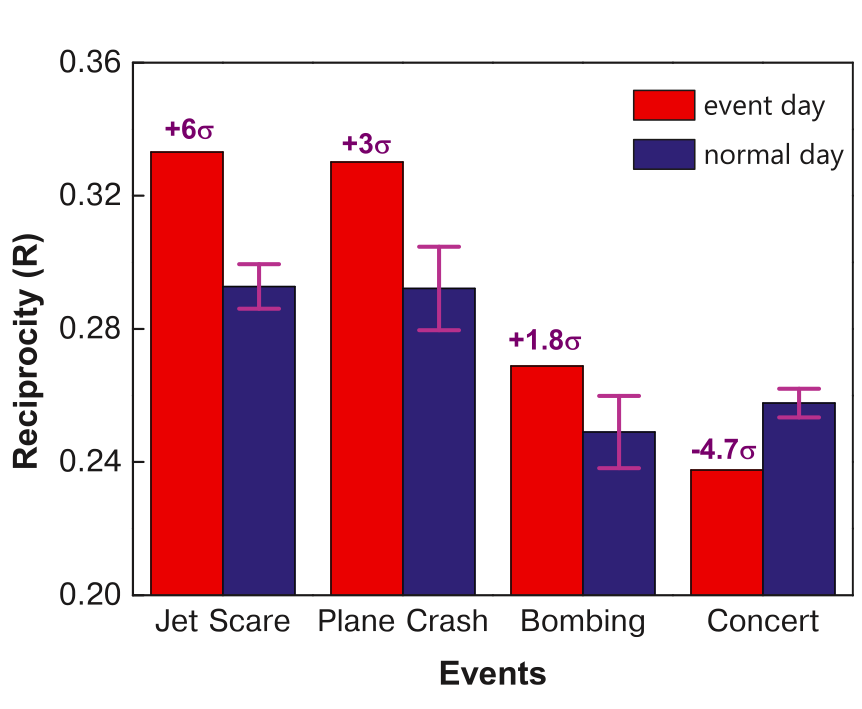
In sum, a crisis early warning system based on communication patterns should seek to monitor changes in the following two indicators: (1) Volume of Call Backs; and (2) Deviation of Call Backs from baseline. Given that access to mobile phone data is near-impossible for the vast majority of academics and humanitarian professionals, one question worth exploring is whether similar communication dynamics can be observed on social networks like Twitter and Facebook.


Patrick, just to make sure I understand your summation, you are interested in tracking pattern 1 communications over pattern 2 communications? Based on your assessment above I would have thought pattern 2 would be more relevant in terms of disseminating information to new participants, which would be useful for an early warning system. What am I missing?
Hi Noel, thanks for reading. For the purpose of an EWS, Pattern 1 is more sensitive to a crisis event than Pattern 2. For the purposes of disseminating situational awareness, finding ways to amplify Pattern 2 would indeed make sense. In sum, one can use Pattern 1 for early detection purposes and then disseminate this early warning through broadcast channels such as radio/TV.