
Update: You can now upload your own tweets to the Crisis Hashtags Analysis Dashboard here.
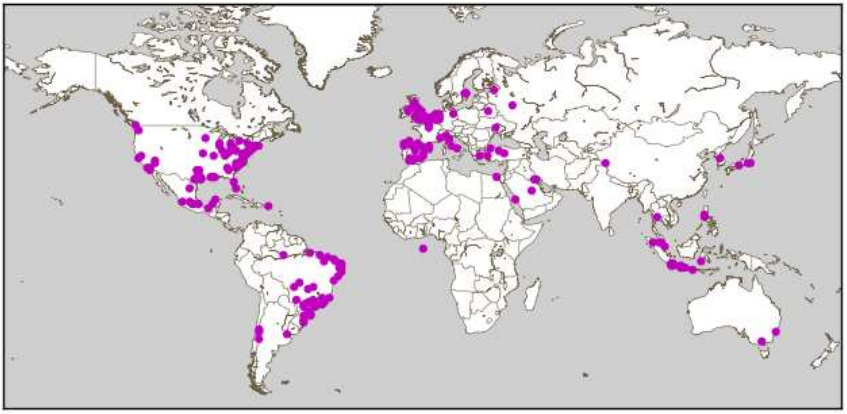
Hashtag footprints can be revealing. The map below, for example, displays the top 200 locations in the world with the most Twitter hashtags. The top 5 are Sao Paolo, London, Jakarta, Los Angeles and New York.
A recent study (PDF) of 2 billion geo-tagged tweets and 27 million unique hashtags found that “hashtags are essentially a local phenomenon with long-tailed life spans.” The analysis also revealed that hashtags triggered by external events like disasters “spread faster than hashtags that originate purely within the Twitter network itself.” Like other metadata, hashtags can be informative in and of themselves. For example, they can provide early warning signals of social tensions in Egypt, as demonstrated in this study. So might they also reveal interesting patterns during and after major disasters?
Tens of thousands of distinct crisis hashtags were posted to Twitter during Hurricane Sandy. While #Sandy and #hurricane featured most, thousands more were also used. For example: #SandyHelp, #rallyrelief, #NJgas, #NJopen, #NJpower, #staysafe, #sandypets, #restoretheshore, #noschool, #fail, etc. NJpower, for example, “helped keep track of the power situation throughout the state. Users and news outlets used this hashtag to inform residents where power outages were reported and gave areas updates as to when they could expect their power to come back” (1).

My colleagues and I at QCRI are studying crisis hashtags to better understand the variety of tags used during and in the immediate aftermath of major crises. Popular hashtags used during disasters often overshadow more hyperlocal ones making these less discoverable. Other challenges include the: “proliferation of hashtags that do not cross-pollinate and a lack of usability in the tools necessary for managing massive amounts of streaming information for participants who needed it” (2). To address these challenges and analyze crisis hashtags, we’ve just launched a Crisis Hashtags Analytics Dashboard. As displayed below, our first case study is Hurricane Sandy. We’ve uploaded about half-a-million tweets posted between October 27th to November 7th, 2012 to the dashboard.
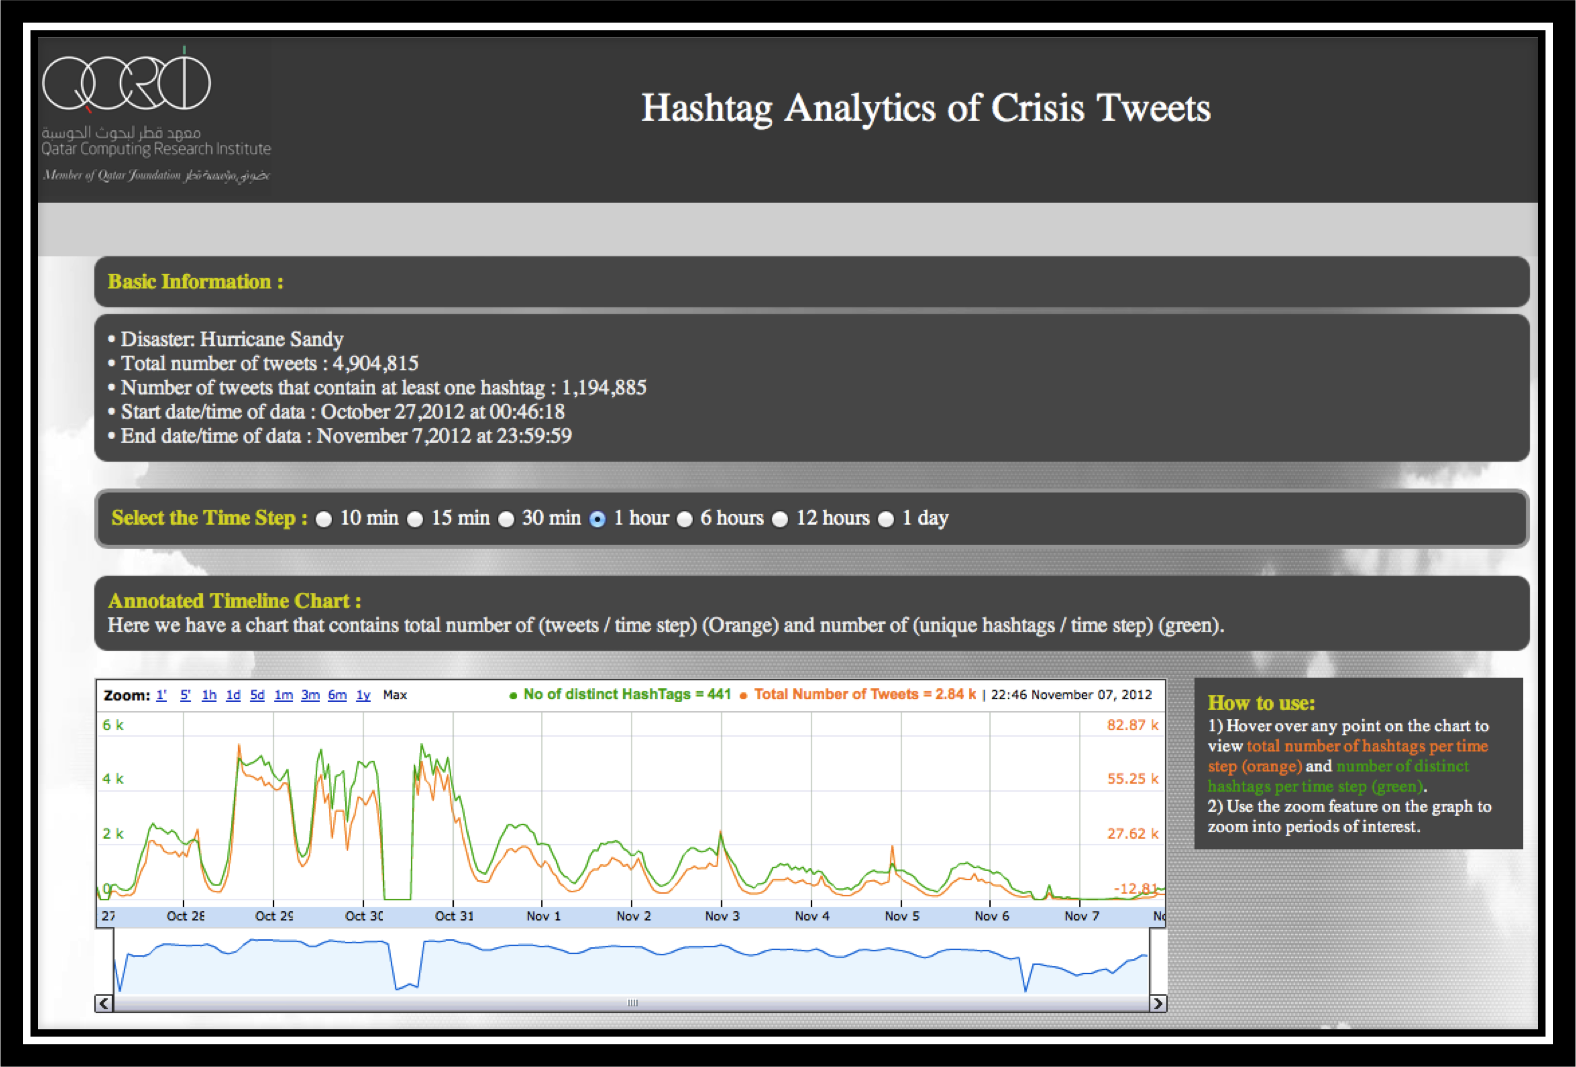
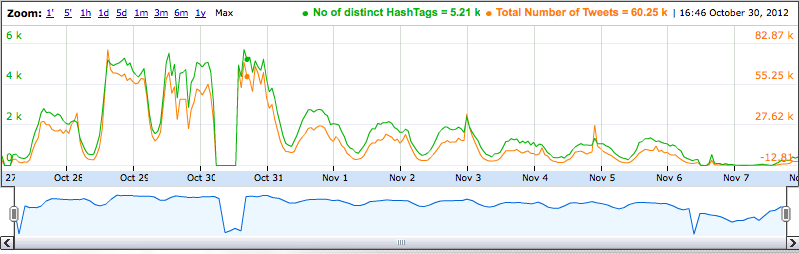
Users can visualize the frequency of tweets (orange line) and hashtags (green line) over time using different time-steps, ranging from 10 minute to 1 day intervals. They can also “zoom in” to capture more minute changes in the number of hashtags per time interval. (The dramatic drop on October 30th is due to a server crash. So if you have access to tweets posted during those hours, I’d be grateful if you could share them with us).
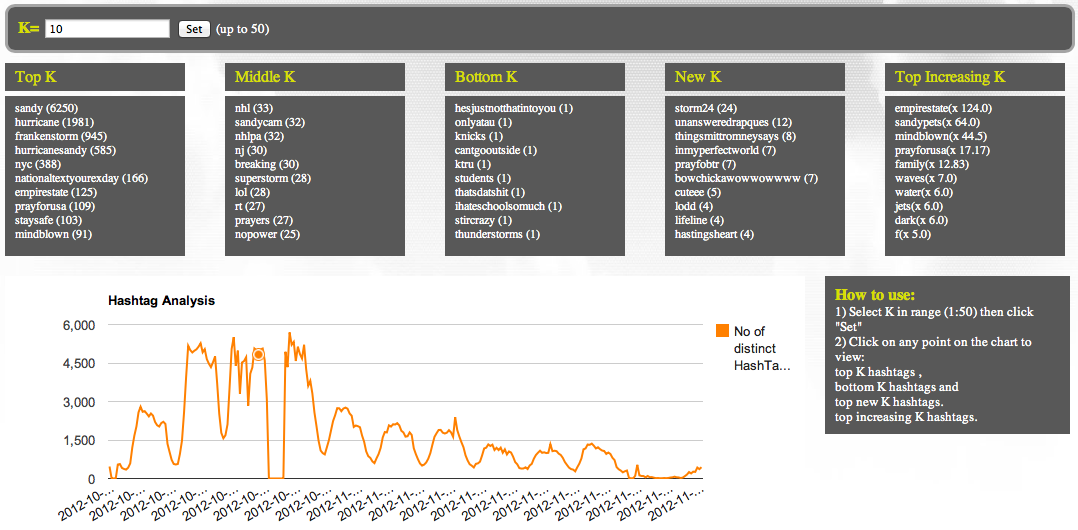
In the second part of the dashboard (displayed below), users can select any point on the graph to display the top “K” most frequent hashtags. The default value for K is 10 (e.g., top-10 most frequent hashtags) but users can change this by typing in a different number. In addition, the 10 least-frequent hashtags are displayed, as are the 10 “middle-most” hashtags. The top-10 newest hashtags posted during the selected time are also displayed as are the hashtags that have seen the largest increase in frequency. These latter two metrics, “New K” and “Top Increasing K”, may provide early warning signals during disasters. Indeed, the appearance of a new hashtag can reveal a new problem or need while a rapid increase in the frequency of some hashtags can denote the spread of a problem or need.
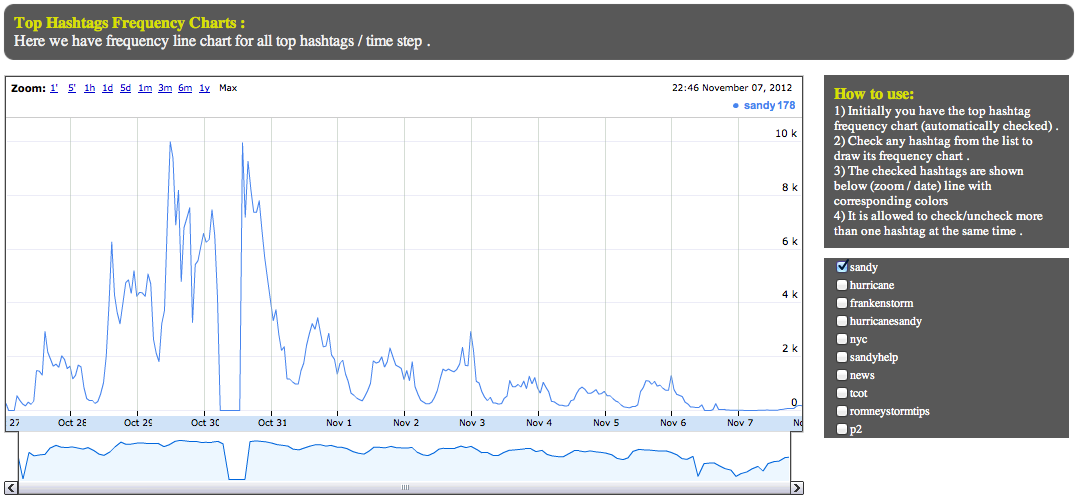
The third part of the dashboard allows users to visualize and compare the frequency of top hashtags over time. This feature is displayed in the screenshot below. Patterns that arise from diverging or converging hashtags may indicate important developments on the ground.
We’re only at the early stages of developing our hashtags analytics platform (above), but we hope the tool will provide insights during future disasters. For now, we’re simply experimenting and tinkering. So feel free to get in touch if you would like to collaborate and/or suggest some research questions.

Acknowledgements: Many thanks to QCRI colleagues Ahmed Meheina and Sofiane Abbar for their work on developing the dashboard.

Pingback: Cyberculture roundup: Dropbox moves forward.. News from Edward Snowden, Bradley Manning and Aaron Swartz cases… | Erkan's Field Diary
Pingback: Cyberculture roundup: Dropbox moves forward.. News from Edward Snowden, Bradley Manning and Aaron Swartz cases… « Erkan's Field Diary
Pingback: Today's Scuttlebot: Instagrams From the T.S.A., and Facebook Father - NYTimes.com
Pingback: Weekly Roundup of Awesome Links: Week of July 15th 2013
Pingback: Hashtag Analysis of #Westgate Crisis Tweets | iRevolution