
Social media networks are evolving a new nervous system for our planet. These real-time networks provide immediate feedback loops when media-rich societies experience a shock. My colleague Todd Mostak recently shared the tweet map below with me which depicts tweets referring to “marathon” (in red) shortly after the bombs went off during Boston’s marathon. The green dots represent all the other tweets posted at the time. Click on the map to enlarge. (It is always difficult to write about data visualizations of violent events because they don’t capture the human suffering, thus seemingly minimizing the tragic events).
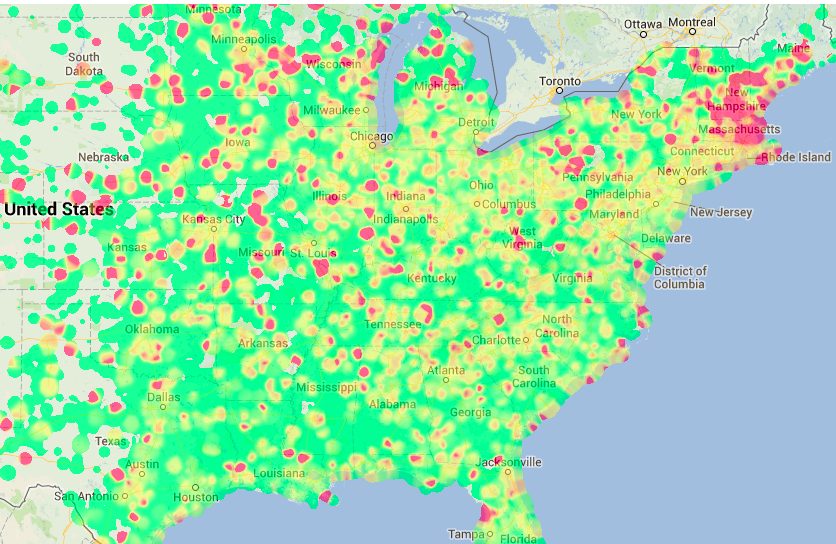
Visualizing a social system at this scale gives a sense that we’re looking at a living, breathing organism, one that has just been wounded. This impression is even more stark in the dynamic visualization captured in the video below.
This an excerpt of Todd’s longer video, available here. Note that this data visualization uses less than 3% of all posted tweets because 97%+ of tweets are not geo-tagged. So we’re not even seeing the full nervous system in action. For more analysis of tweets during the marathon, see this blog post entitled “Boston Marathon Explosions: Analyzing First 1,000 Seconds on Twitter.”


I quite like the way you use the analogy with the ‘nervous system’. Very, very useful.
Thanks for reading, Luis! It was Hillary Clinton who first used the “nervous system” analogy, back in a 2010 speech.
Pingback: Cyberculture roundup: http://piratebrowser.com/ Pirate Bay’s 10th year gift… NSA by the numbers…HTTPS Hackable In 30 Seconds | Erkan's Field Diary
Pingback: Weekly Roundup of Awesome Links: Week of August 12th 2013
Pingback: Analyzing Fake Content on Twitter During Boston Marathon Bombings | iRevolution