
The Qatar Foundation’s Computing Research Institute (QCRI) has just launched a live sentiment analysis tool of all #COP18 tweets being posted during the United Nations (UN) Climate Change Conference in Doha, Qatar. The event kicked off on Monday, November 26th and will conclude on Friday, December 7th. While the world’s media is actively covering COP18, social media reports are equally insightful. This explains the rationale behind QCRI’s Live #COP18 Twitter Sentiment Analysis Tool.
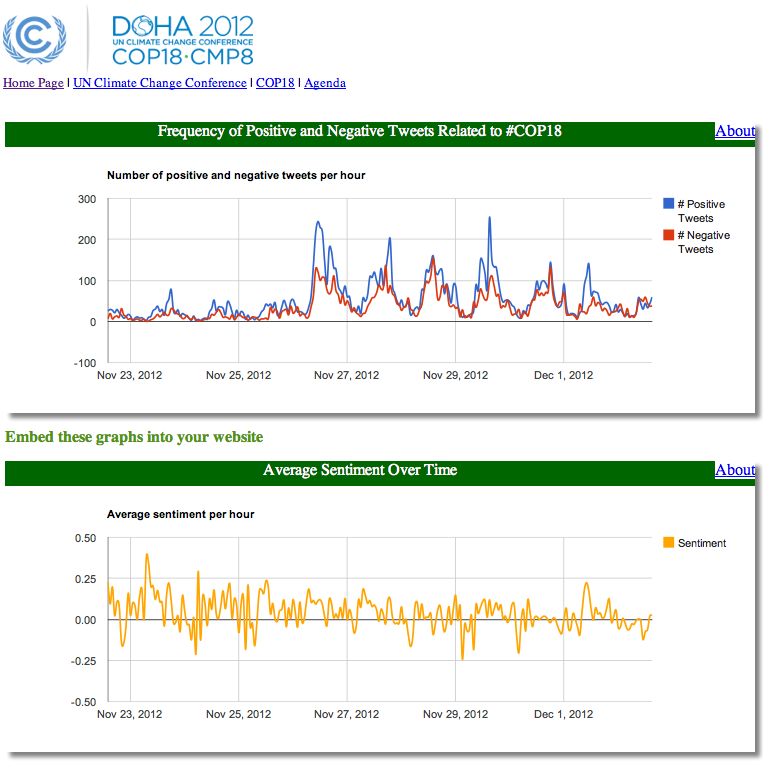
The first timeline displays the number of positive versus negative tweets posted with the COP18 hashtag. The tweets are automatically tagged as positive or negative using the SentiStrength algorithm, which has the same level of accuracy as that of a person if s/he were to manually tag the tweets. The second timeline simply depicts the average sentiment of #COP18 tweets. Both graphs are auto-matically updated every hour. Note that tweets in all languages are analyzed, not just English-language tweets.
These timelines enable journalists, activists and others to monitor the general mood and reaction to presentations, announcements & conversations happening at the UN Climate Conference. For example, we see a major spike in positive tweets (and to a lesser extent negative tweets) between 10am-11am on November 26th. This is when the Opening Ceremony kicks off, as can be seen from the conference agenda.

The next highest peak occurs between 6pm-7pm on the 27th, which corresponds to the opening plenary of the Ad Hoc Working Group on the Durban Platform for Enhanced Action (ADP). This group is tasked with establishing an agreement that will legally bind all parties to climate targets for the first time. The tweets are primarily positive, which may reflect a positive start to negotiations on opera-tionalizing the Durban Platform. This news article appears to support this hypo-thesis. At 2pm time on November 28th, the number of positive and negative tweets both peak at approximately the same number, 160 tweets. Twitter users may be evenly divided on a topic being discussed.

To find out more, simply scroll to the right of the timelines. You’ll see two twitter streams displayed. The first provides a list of selected positive and negative tweets. More specifically, the most frequently retweeted positive and negative tweets for each day are displayed. This feature enables users to understand how some tweets are driving the sentiment analyses displayed on the timelines. The second twitter stream displays the most recent tweets on the UN Conference.
If you’re interested in displaying these live graphs on your website, simply click on the “Embed link” to grab the code. The code is free, we simply ask that you credit and link to QCRI. If you analyze #COP18 tweets using these timelines, please let us know so we can benefit from your insights during this pivotal conference. The sentiment analysis dashboard was put together by QCRI’s Sofiane Abbar, Walid Magdy and myself. We welcome your feedback on how to make this dashboard more useful for future conferences and events. Please note that this site was put together “overnight”; i.e., it was rushed. As such it is only an initial prototype.


