Tag Archives: flooding

Social Media for Disaster Response – Done Right!

To say that Indonesia’s capital is prone to flooding would be an understatement. Well over 40% of Jakarta is at or below sea level. Add to this a rapidly growing population of over 10 million and you have a recipe for recurring disasters. Increasing the resilience of the city’s residents to flooding is thus imperative. Resilience is the capacity of affected individuals to self-organize effectively, which requires timely decision-making based on accurate, actionable and real-time information. But Jakarta is also flooded with information during disasters. Indeed, the Indonesian capital is the world’s most active Twitter city.

JK1

So even if relevant, actionable information on rising flood levels could somehow be gleaned from millions of tweets in real-time, these reports could be inaccurate or completely false. Besides, only 3% of tweets on average are geo-located, which means any reliable evidence of flooding reported via Twitter is typically not actionable—that is, unless local residents and responders know where waters are rising, they can’t take tactical action in a timely manner. These major challenges explain why most discount the value of social media for disaster response.

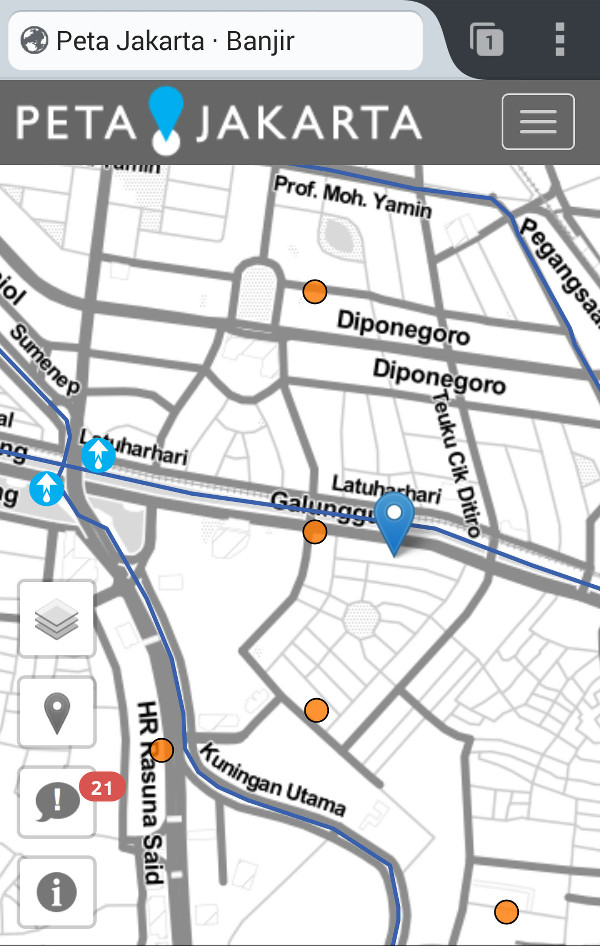
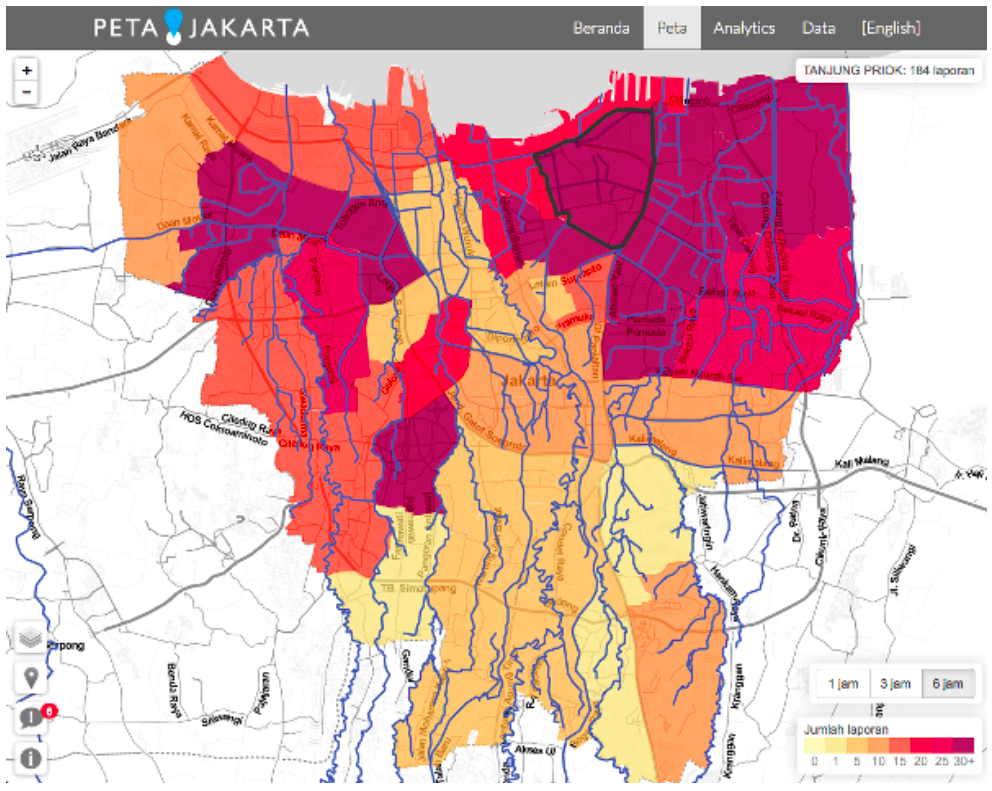
But Digital Humanitarians in Jakarta aren’t your average Digital Humanitarians. These Digital Jedis recently launched one of the most promising humanitarian technology initiatives I’ve seen in years. Code named Peta Jakarta, the project takes social media and digital humanitarian action to the next level. Whenever someone posts a tweet with the word banjir (flood), they receive an automated tweet reply from @PetaJkt inviting them to confirm whether they see signs of flooding in their area: “Flooding? Enable geo-location, tweet @petajkt #banjir and check petajakarta.org.” The user can confirm their report by turning geo-location on and simply replying with the keyword banjir or flood. The result gets added to a live, public crisis map, like the one below.

Credit: Peta Jakarta

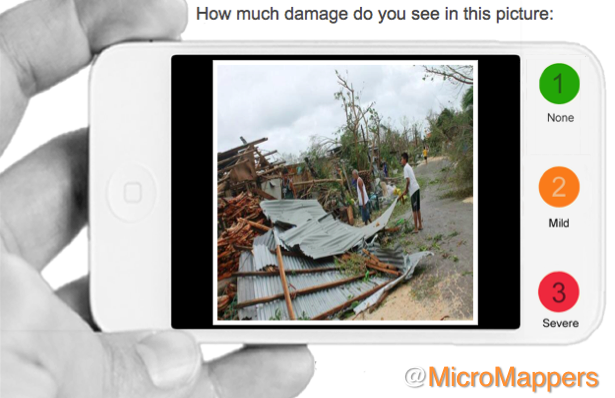
Over the course of the 2014/2015 monsoon season, Peta Jakarta automatically sent 89,000 tweets to citizens in Jakarta as a call to action to confirm flood conditions. These automated invitation tweets served to inform the user about the project and linked to the video below (via Twitter Cards) to provide simple instructions on how to submit a confirmed report with approximate flood levels. If a Twitter user forgets to turn on the geo-location feature of their smartphone, they receive an automated tweet reminding them to enable geo-location and resubmit their tweet. Finally, the platform “generates a thank you message confirming the receipt of the user’s report and directing them to PetaJakarta.org to see their contribution to the map.” Note that the “overall aim of sending programmatic messages is not to simply solicit a high volume of replies, but to reach active, committed citizen-users willing to participate in civic co-management by sharing nontrivial data that can benefit other users and government agencies in decision-making during disaster scenarios.”

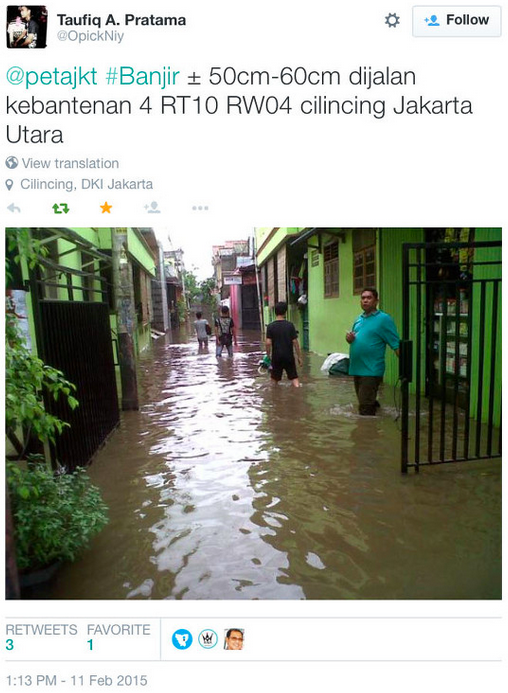
A report is considered verified when a confirmed geo-tagged tweet includes a picture of the flooding, like in the tweet below. These confirmed and verified tweets get automatically mapped and also shared with Jakarta’s Emergency Management Agency (BPBD DKI Jakarta). The latter are directly involved in this initiative since they’re “regularly faced with the difficult challenge of anticipating & responding to floods hazards and related extreme weather events in Jakarta.” This direct partnership also serves to limit the “Data Rot Syndrome” where data is gathered but not utilized. Note that Peta Jakarta is able to carry out additional verification measures by manually assessing the validity of tweets and pictures by cross-checking other Twitter reports from the same district and also by monitoring “television and internet news sites, to follow coverage of flooded areas and cross-check reports.”

Screen Shot 2015-06-29 at 2.38.54 PM

During the latest monsoon season, Peta Jakarta “received and mapped 1,119 confirmed reports of flooding. These reports were formed by 877 users, indicating an average tweet to user ratio of 1.27 tweets per user. A further 2,091 confirmed reports were received without the required geolocation metadata to be mapped, highlighting the value of the programmatic geo-location ‘reminders’ […]. With regard to unconfirmed reports, Peta Jakarta recorded and mapped a total of 25,584 over the course of the monsoon.”

The Live Crisis Maps could be viewed via two different interfaces depending on the end user. For local residents, the maps could be accessed via smartphone with the visual display designed specifically for more tactical decision-making, showing flood reports at the neighborhood level and only for the past hour.

PJ2

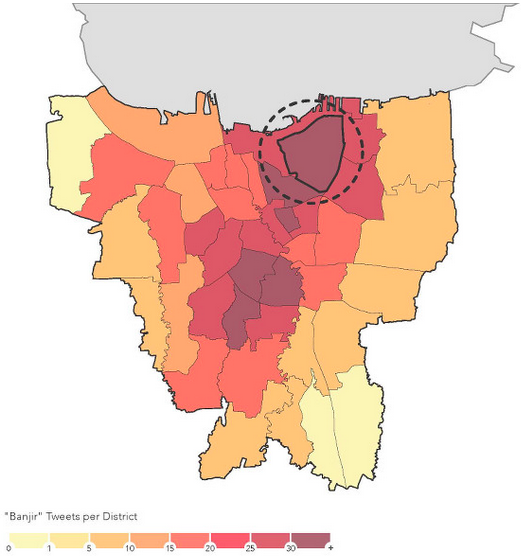
For institutional partners, the data is visualized in more aggregate terms for strategic decision-making based trends-analysis and data integration. “When viewed on a desktop computer, the web-application scaled the map to show a situational overview of the city.”

Credit: Peta Jakarta

Peta Jakarta has “proven the value and utility of social media as a mega-city methodology for crowdsourcing relevant situational information to aid in decision-making and response coordination during extreme weather events.” The initiative enables “autonomous users to make independent decisions on safety and navigation in response to the flood in real-time, thereby helping increase the resilience of the city’s residents to flooding and its attendant difficulties.” In addition, by “providing decision support at the various spatial and temporal scales required by the different actors within city, Peta Jakarta offers an innovative and inexpensive method for the crowdsourcing of time-critical situational information in disaster scenarios.” The resulting confirmed and verified tweets were used by BPBD DKI Jakarta to “cross-validate formal reports of flooding from traditional data sources, supporting the creation of information for flood assessment, response, and management in real-time.”


My blog post is based several conversations I had with Peta Jakarta team and on this white paper, which was just published a week ago. The report runs close to 100 pages and should absolutely be considered required reading for all Digital Humanitarians and CrisisMappers. The paper includes several dozen insights which a short blog post simply cannot do justice to. If you can’t find the time to read the report, then please see the key excerpts below. In a future blog post, I’ll describe how the Peta Jakarta team plans to leverage UAVs to complement social media reporting.

  • Extracting knowledge from the “noise” of social media requires designed engagement and filtering processes to eliminate unwanted information, reward valuable reports, and display useful data in a manner that further enables users, governments, or other agencies to make non-trivial, actionable decisions in a time-critical manner.
  • While the utility of passively-mined social media data can offer insights for offline analytics and derivative studies for future planning scenarios, the critical issue for frontline emergency responders is the organization and coordination of actionable, real-time data related to disaster situations.
  • User anonymity in the reporting process was embedded within the Peta Jakarta project. Whilst the data produced by Twitter reports of flooding is in the public domain, the objective was not to create an archive of users who submitted potentially sensitive reports about flooding events, outside of the Twitter platform. Peta Jakarta was thus designed to anonymize reports collected by separating reports from their respective users. Furthermore, the text content of tweets is only stored when the report is confirmed, that is, when the user has opted to send a message to the @petajkt account to describe their situation. Similarly, when usernames are stored, they are encrypted using a one-way hash function.
  • In developing the Peta Jakarta brand as the public face of the project, it was important to ensure that the interface and map were presented as community-owned, rather than as a government product or academic research tool. Aiming to appeal to first adopters—the young, tech-savvy Twitter-public of Jakarta—the language used in all the outreach materials (Twitter replies, the outreach video, graphics, and print advertisements) was intentionally casual and concise. Because of the repeated recurrence of flood events during the monsoon, and the continuation of daily activities around and through these flood events, the messages were intentionally designed to be more like normal twitter chatter and less like public service announcements.
  • It was important to design the user interaction with PetaJakarta.org to create a user experience that highlighted the community resource element of the project (similar to the Waze traffic app), rather than an emergency or information service. With this aim in mind, the graphics and language are casual and light in tone. In the video, auto-replies, and print advertisements, PetaJakarta.org never used alarmist or moralizing language; instead, the graphic identity is one of casual, opt-in, community participation.
  • The most frequent question directed to @petajkt on Twitter was about how to activate the geo-location function for tweets. So far, this question has been addressed manually by sending a reply tweet with a graphic instruction describing how to activate geo-location functionality.
  • Critical to the success of the project was its official public launch with, and promotion by, the Governor. This endorsement gave the platform very high visibility and increased legitimacy among other government agencies and public users; it also produced a very successful media event, which led substantial media coverage and subsequent public attention.

  • The aggregation of the tweets (designed to match the spatio-temporal structure of flood reporting in the system of the Jakarta Disaster Management Agency) was still inadequate when looking at social media because it could result in their overlooking reports that occurred in areas of especially low Twitter activity. Instead, the Agency used the @petajkt Twitter stream to direct their use of the map and to verify and cross-check information about flood-affected areas in real-time. While this use of social media was productive overall, the findings from the Joint Pilot Study have led to the proposal for the development of a more robust Risk Evaluation Matrix (REM) that would enable Peta Jakarta to serve a wider community of users & optimize the data collection process through an open API.
  • Developing a more robust integration of social media data also means leveraging other potential data sets to increase the intelligence produced by the system through hybridity; these other sources could include, but are not limited to, government, private sector, and NGO applications (‘apps’) for on- the-ground data collection, LIDAR or UAV-sourced elevation data, and fixed ground control points with various types of sensor data. The “citizen-as- sensor” paradigm for urban data collection will advance most effectively if other types of sensors and their attendant data sources are developed in concert with social media sourced information.

Integrating Geo-Data with Social Media Improves Situational Awareness During Disasters

A new data-driven study on the flooding of River Elbe in 2013 (one of the most severe floods ever recorded in Germany) shows that geo-data can enhance the process of extracting relevant information from social media during disasters. The authors use “specific geographical features like hydrological data and digital elevation models to prioritize crisis-relevant twitter messages.” The results demonstrate that an “approach based on geographical relations can enhance information extraction from volunteered geographic information,” which is “valuable for both crisis response and preventive flood monitoring.” These conclusions thus support a number of earlier studies that show the added value of data integration. This analysis also confirms several other key assumptions, which are important for crisis computing and disaster response.

floods elbe

The authors apply a “geographical approach to prioritize [the collection of] crisis-relevant information from social media.” More specifically, they combine information from “tweets, water level measurements & digital elevation models” to answer the following three research questions:

  • Does the spatial and temporal distribution of flood-related tweets actually match the spatial and temporal distribution of the flood phenomenon (despite Twitter bias, potentially false info, etc)?

  • Does the spatial distribution of flood-related tweets differ depending on their content?
  • Is geographical proximity to flooding a useful parameter to prioritize social media messages in order to improve situation awareness?

The authors analyzed just over 60,000 disaster-related tweets generated in Germany during the flooding of River Elbe in June 2013. Only 398 of these tweets (0.7%) contained keywords related to the flooding. The geographical distribution of flood-related tweets versus non-flood related tweets is depicted below (click to enlarge).

Screen Shot 2014-10-04 at 7.04.59 AM

As the authors note, “a considerable amount” of flood-related tweets are geo-located in areas of major flooding. So they tested the statistical correlation between the location of flood-related tweets and the actual flooding, which they found to be “statistically significantly lower compared to non-related Twitter messages.” This finding “implies that the locations of flood-related twitter messages and flood-affected catchments match to a certain extent. In particular this means that mostly people in regions affected by the flooding or people close to these regions posted twitter messages referring to the flood.” To this end, major urban areas like Munich and Hamburg were not the source of most flood-related tweets. Instead, “The majority of tweet referring to the flooding were posted by locals” closer to the flooding.

Given that “most flood-related tweets were posted by locals it seems probable that these messages contain local knowledge only available to people on site.” To this end, the authors analyzed the “spatial distribution of flood-related tweets depending on their content.” The results, depicted below (click to enlarge), show that the geographical distribution of tweets do indeed differ based on their content. This is especially true of tweets containing information about “volunteer actions” and “flood level”. The authors confirm these results are statistically significant when compared with tweets related to “media” and “other” issues.

Screen Shot 2014-10-04 at 7.22.05 AM

These findings also reveal that the content of Twitter messages can be combined into three groups given their distance to actual flooding:

Group A: flood level & volunteer related tweets are closest to the floods.
Group B: tweets on traffic conditions have a medium distance to the floods.
Group C: other and media related tweets a furthest to the flooding.

Tweets belonging to “Group A” yield greater situational awareness. “Indeed, information about current flood levels is crucial for situation awareness and can complement existing water level measurements, which are only available for determined geographical points where gauging stations are located. Since volunteer actions are increasingly organized via social media, this is a type of information which is very valuable and completely missing from other sources.”

Screen Shot 2014-10-04 at 6.55.49 AM

In sum, these results show that “twitter messages that are closest to the flood- affected areas (Group A) are also the most useful ones.” The authors thus conclude that “the distance to flood phenomena is indeed a useful parameter to prioritize twitter messages towards improving situation awareness.” To be sure, the spatial distribution of flood-related tweets is “significantly different from the spatial distribution of off-topic messages.” Whether this is also true of other social media platforms like Instagram and Flickr remains to be seen. This is an important area for future research given the increasing use of pictures posted on social media for rapid damage assessments in the aftermath of disasters.

ImageClicker

“The integration of other official datasets, e.g. precipitation data or satellite images, is another avenue for future work towards better understanding the relations between social media and crisis phenomena from a geographical perspective.” I would add both aerial imagery (captured by UAVs) and data from mainstream news (captured by GDELT) to this data fusion exercise. Of course, the geographical approach described above is not limited to the study of flooding only but could be extended to other natural hazards.

This explains why my colleagues at GeoFeedia may be on the right track with their crisis mapping platform. That said, the main limitation with GeoFeedia and the study above is the fact that only 3% of all tweets are actually geo-referenced. But this need not be a deal breaker. Instead, platforms like GeoFeedia can be complemented by other crisis computing solutions that prioritize the analysis of social media content over geography.

Take the free and open-source “Artificial Intelligence for Disaster Response” (AIDR) platform that my team and I at QCRI are developing. Humanitarian organizations can use AIDR to automatically identify tweets related to flood levels and volunteer actions (deemed to provide the most situational awareness) without requiring that tweets be geo-referenced. In addition, AIDR can also be used to identify eyewitness tweets regardless of whether they refer to flood levels, volunteering or other issues. Indeed, we already demonstrated that eyewitness tweets can be automatically identified with an accuracy of 80-90% using AIDR. And note that AIDR can also be used on geo-tagged tweets only.

The authors of the above study recently go in touch to explore ways that their insights can be used to further improve AIDR. So stay tuned for future updates on how we may integrate geo-data more directly within AIDR to improve situational awareness during disasters.

bio

See also:

  • Debating the Value of Tweets For Disaster Response (Intelligently) [link]
  • Social Media for Emergency Management: Question of Supply and Demand [link]
  • Become a (Social Media) Data Donor and Save a Life [link]

Crowdsourcing Crisis Response Following Philippine Floods

Widespread and heavy rains resulting from Typhoon Haikui have flooded the Philippine capital Manila. Over 800,000 have been affected by the flooding and some 250,000 have been relocated to evacuation centers. Given the gravity of the situation, “some resourceful Filipinos put up an online spreadsheet where concerned citizens can list down places where help is most urgently needed” (1). Meanwhile, Google’s Crisis Response Team has launched this resource page  which includes links to News updates, Emergency contact information, Person Finder and this shelter map.

Filipinos volunteers are using an open (but not editable) Google Spreadsheet and crowdsourcing reports using this Google Form to collect urgent reports on needs. The spreadsheet (please click the screenshot below to enlarge) includes time of incident, location (physical address), a description of the alert (many include personal names and phone numbers) and the person it was reported by. Additional fields include status of the alert, the urgency of this alert and whether action has been taken. The latter is also color coded.

“The spreadsheet can easily be referenced by any rescue group that can access the web, and is constantly updated by volunteers real-time” (2). This reminds me a lot of the Google Spreadsheets we used following the Haiti Earthquake of 2010. The Standby Volunteer Task Force (SBTF) continues to use Google Spreadsheets in similar aways but for the purposes of media monitoring and these are typically not made public. What is noteworthy about these important volunteer efforts in the Philippines is that the spreadsheet was made completely public in order to crowdsource the response.

As I’ve noted before, emergency management professionals cannot be every-where at the same time, but the crowd is always there. The tradeoff with the use of open data to crowdsource crisis response is obviously privacy and data protection. Volunteers may therefore want to let those filling out the Google Form know that any information they provide will or may be made public. I would also recommend that they create an “About Us” or “Who We Are” link to cultivate a sense of trust with the initiative. Finally, crowdsourcing offers-for-help may facilitate the “matchmaking” of needs and available resources.

I would give the same advice to volunteers who recently setup this Crowdmap of the floods. I would also suggest they set up their own Standby Volunteer Task Force (SBTF) in order to deploy again in the future. In the meantime, reports on flood levels can be submitted to the crisis map via webform, email and SMS.

Flood Warning, Mobile Phones and Dynamic Mapping in India

I’m in Mumbai for the next 10 days to work on a flood early warning and response project. Here’s a quick overview of the project:

The Monsoon Project
In Mumbai and Ahmedabad, we will see what kind of qualitative data people have reported. The next step is to to expand the data collection exercise to discreet objective data points that may expedite rescue and response in real-time. Can farmers sitting atop roofs in the flooded villages of Orissa use their cell phones to transmit simple, discreet, data points that would help plot a real-time map of events as they unfold? Can such a platform be created? How far are we in terms of technology and collaboration? At HHI, the Crisis Mapping Project is well underway, with small projects at multiple locations in different stages of development.

The Monsoon project is one such: To pilot such an interactive platform we need a predictable, controlled model within which to test such an instrument. In recent years, the monsoons in Mumbai have invariably brought the city to a stand-still. What we want to do now is to see if we can develop simple indicators that the common man can identify (“early warning signs”) to alert their communities to an impending “bad-floods day” in Mumbai. This monsoon Gregg Greenough and Patrick Meier from HHI will be in Mumbai to meet with the faculty at the Geography Dept of Mumbai University to explore ways to collaborate on developing these indicators. Site visits in Mumbai before and after the workshop.

Action points: Request MU/ AIDMI / CEE  to identify local partners in India that should be invited to the workshop. Once the indicators are identified, the goal is to test the technology on a local platform, amongst pre-selected volunteers across the city, during the monsoons of 2009.

My role, as part of the HHI team, is simply to provide a conceptual and technical overview of other crisis early warning projects that make use of mobile technologies. For example, I got the green light from Ory Okolloh to consider a potential partnership with the team in Mumbai should making use of the Ushahidi platform make sense for the Monsoon Project. (Incidentally, congratulations to the Ushahidi team on launching their most recent version of the platform!) In addition to Ushahidi and a number of other related initiatives, I will share the latest maps of Bihar on Google Earth to stimulate a dialogue on whether this type of dynamic mapping is operationally useful (the map I’ve linked to here is not particularly impressive). In conclusion, I will share relevant best practices and lessons “learned” in the field of early warning and response.

It may not be a coincidence that the National Geographic channel was just featuring a documentary on the great Mumbai floods of July 2005 yesterday. Watching these pictures and those of Bihar over the past two weeks, I’m starting to get some sense of the challenge ahead, not least because the topic of disaster management is an area I have more academic than practical experience in; so I’ll be doing a lot of listening and learning. Before leaving for Mumbai, I had the opportunity to touch base with a  friend at the Fletcher School who just returned from working on flood preparedness and response in Bihar.

In any case, I wanted to share some of my own observations. The government’s response to the devastation in the northeast of the country has been particularly slow, with just one military helicopter spotted once or twice in two weeks, according to a BBC report I saw yesterday.

If we are to make good on the UNISDR’s call for a shift towards people-centered early warning, then flood early warning/response systems ought to empower local communities to get out of harm’s way and minimize loss of livelihood. This shift in discourse and operational mandate is an important one in my opinion. Centralized, state-centered, top-down, external responses to crises are apparently increasingly ineffective.

In the case of the devastating floods of 2005, part of the problem was the late warning. The rains had already begun when India’s meteorological department realized that unlike monsoon storms, this storm had clouds as tall as 15 kilometers as opposed to the usual 8 kilometers.  Even if the warning had been disseminated hours or even days earlier, would the most vulnerable populations in Mumbai have had the capacity to get out of harm’s way? I don’t know what the Indian government’s operational plans look like for this type of disaster, but I hope to learn soon.

Another question on my mind is if/how mobile technology might empower vulnerable communities in Mumbai during the Monsoon season? As it happens,  the front page of today’s (Sunday print edition) of The Times of India figured an article on mobile phones: “A Mobile in Every Hand by 2020.” I include some sections below:

Today, one in four Indians has a mobile phone. […] From the villager sitting atop his half-drowned hut calling for help in flood-hit Bihar, to the kabadiwallah who eagerly hands you his number, it’s mobile networking like never before.

“[…] the mobile phone’s ‘greatest impact [will] be on those people with professions that are time, location and information sensitive. […] fishermen wanting a weather update or the location of the best catch; hospitals contacting patients without a permanent address; SMSes on the Sensex.”

“It is true that network coverage and mobile penetration are still limited to certain areas. But, interestingly, as a study by the Center for Knowledge Societies (CKS) showed in Maharashtra, Up and Karnataka, many new mobile users belong to poorer areas with scarce infrastructure, high levels of illiteracy and low PC and internet penetration.”

I remember an interesting conversation I had last year with Suha Ulgen, the coordinator of the UN Geographic Information Working Group Secretariat (UNGIWIG), regarding an earthquake preparedness and response project he had worked on in Turkey. The team involved in the project used mobile technologies and GPS units to map the most vulnerable areas (e.g., buildings, bridges, etc) in various neighborhoods across the city. Together with local volunteers, they documented the neighborhoods in great detail during the day, and would upload all their data directly on to a dynamic mapping platform in the evenings.

This approach appeals to me for several reasons. First, the approach comes close to local crowdsourcing.  Tapping into local knowledge is critical. As mentioned in this article (PDF) I wrote for Monday Developments (April/2007), “From Disaster to Conflict Early Warning: A People-Centered Approach,” the non-local community (a.k.a. international community) has a lot to learn when it comes indigenous early warning and response practices:

In Swaziland, for example, we are taught floods can be predicted from the height of bird nests near rivers, while moth numbers predict drought. Because these indicators are informal, they rarely figure in peer-reviewed journals and remain invisible to the international humanitarian community.

I’m looking forward to learning more about the corresponding local know how in Mumbai. Second, vulnerability mapping is an important component of preparedness training, contingency planning and disaster response. Third, geo-referencing pockets of vulnerability using a dynamic platform provides a host of new possibilities for disaster response including automated and subscription-based SMS alerts, rapid disaster impact assessments and more networked forms of communication in crisis zones. In addition to mapping areas of vulnerability, one could also map potential shelter areas, sources of clean water, etc.

This may or may not make sense within the context of flooding and/or Mumbai, which is why I’ll definitely be doing a lot of listening and learning in the coming days. Any feedback and guidance in the meantime would certainly be of value.

Patrick Philippe Meier