Tag Archives: floods

Humanitarian UAVs in the Solomon Islands

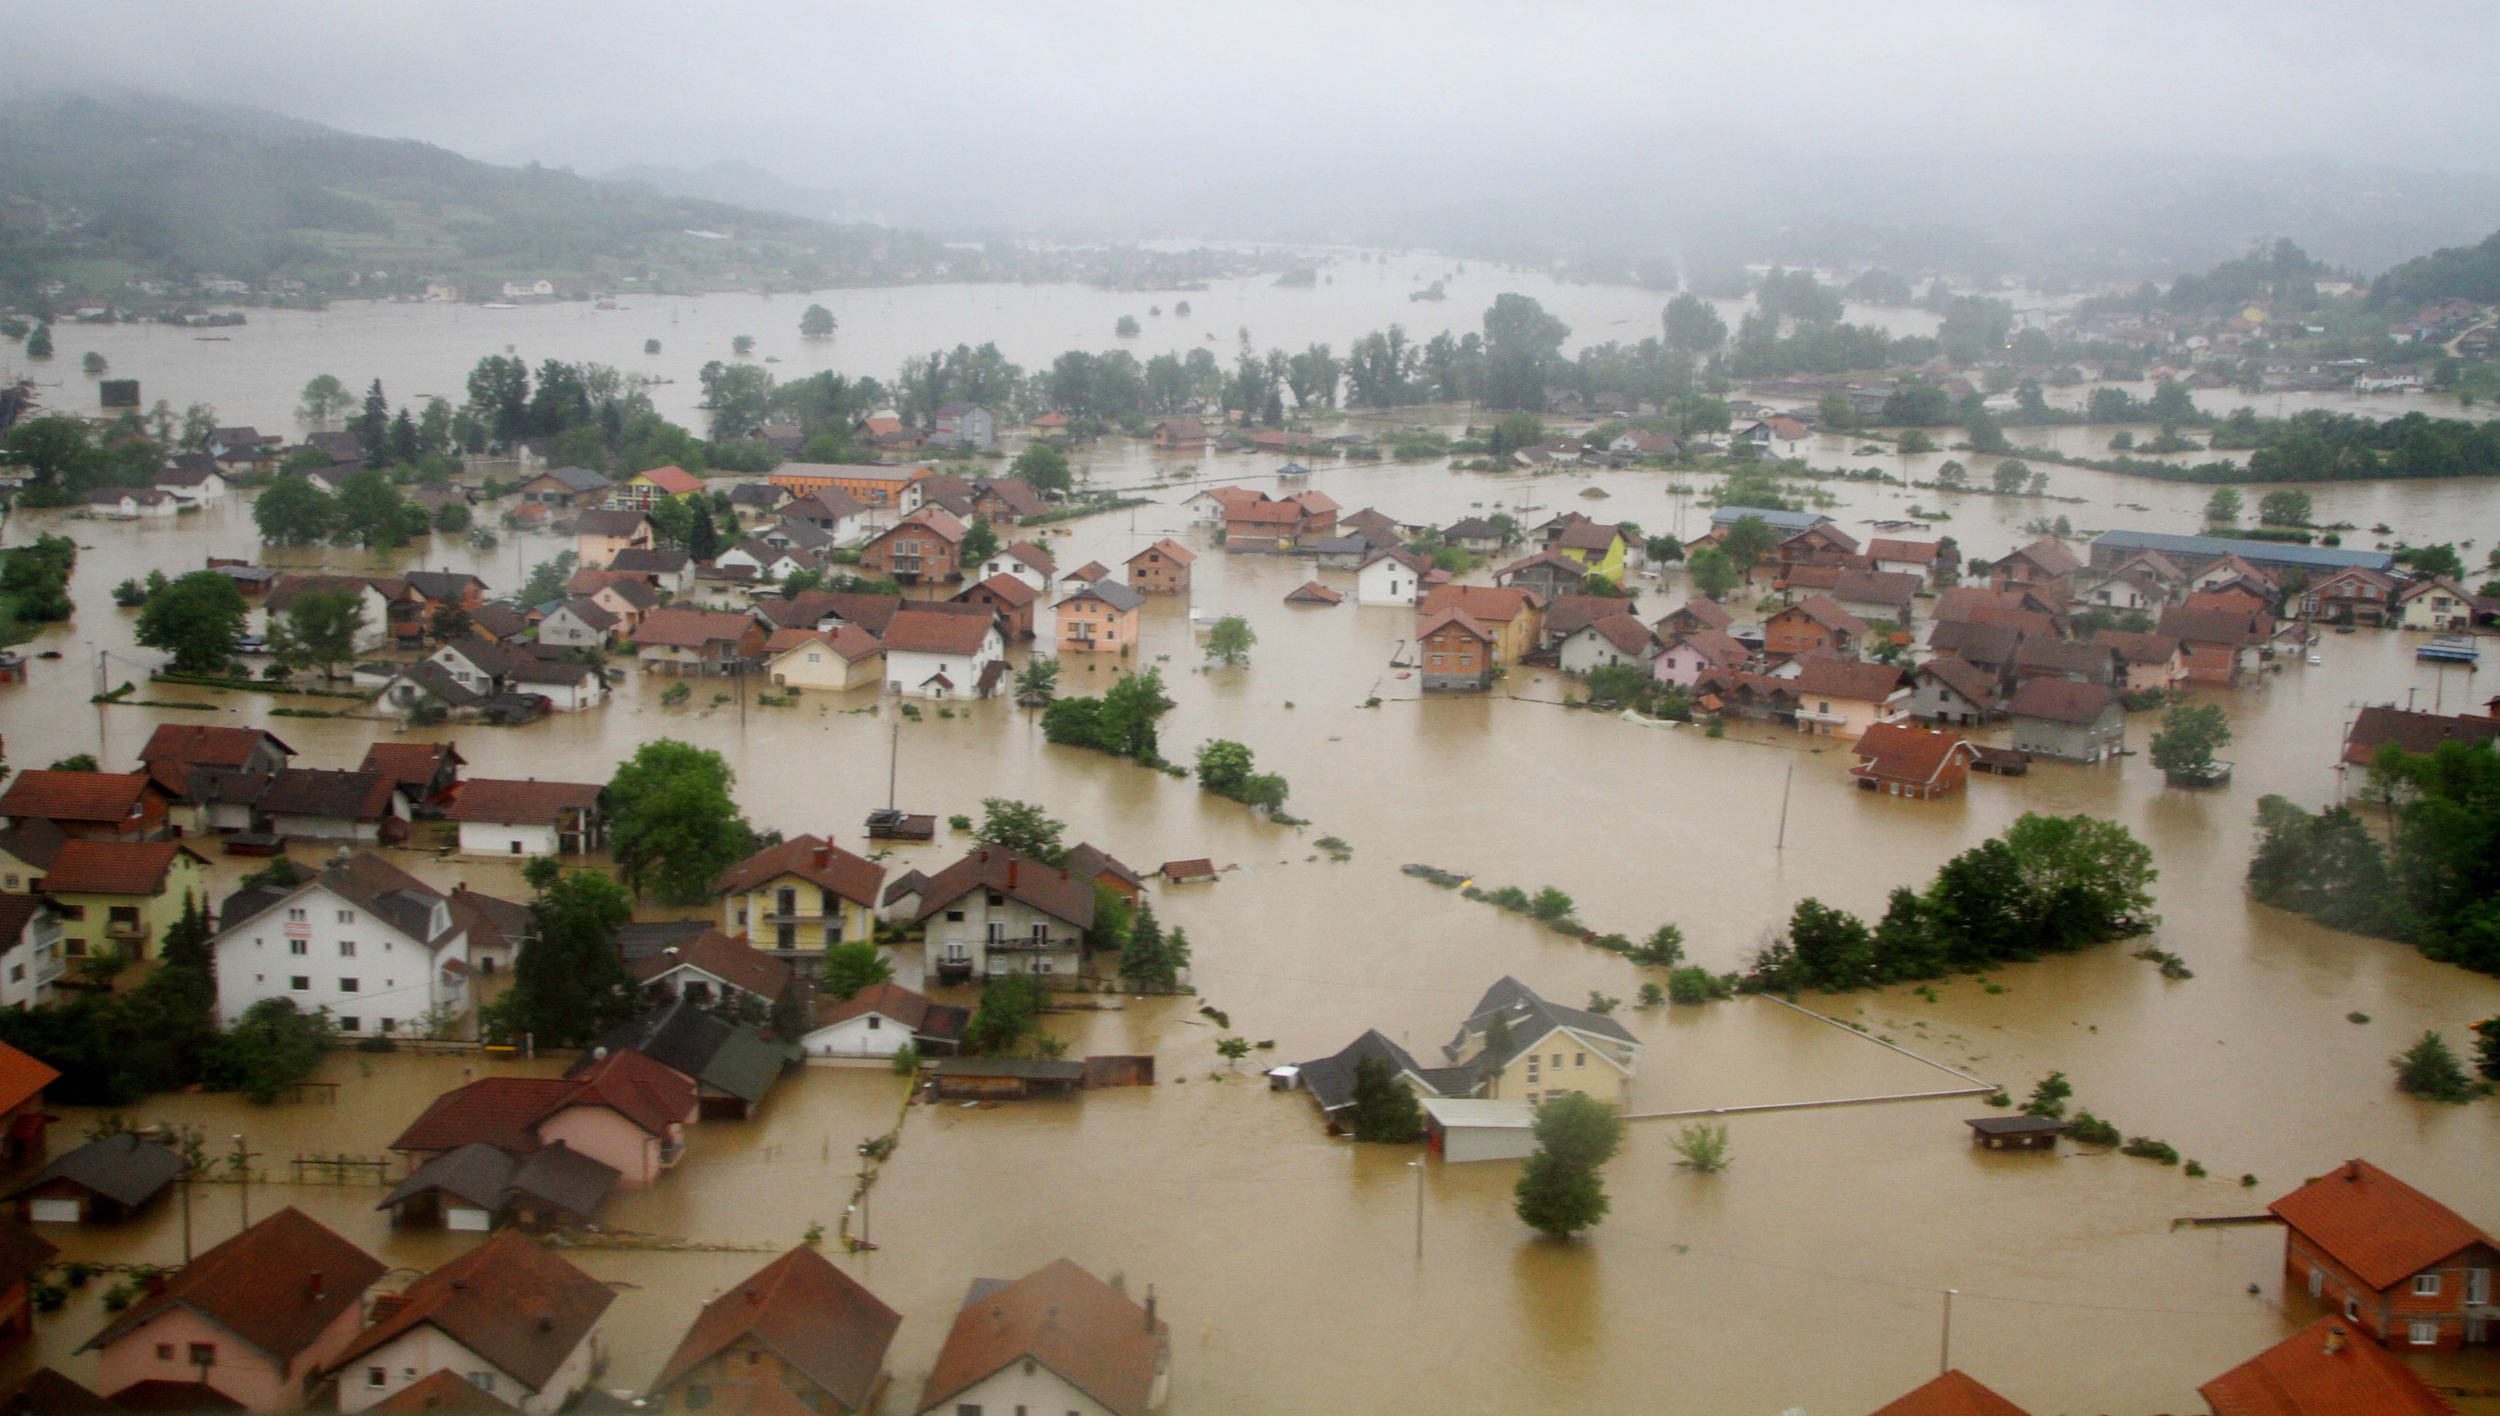
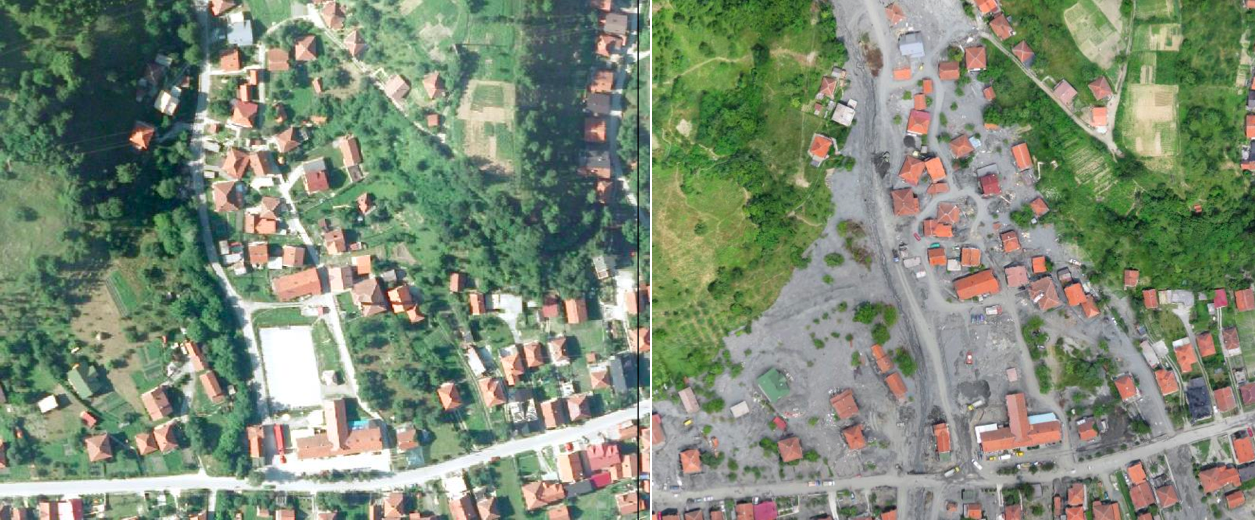
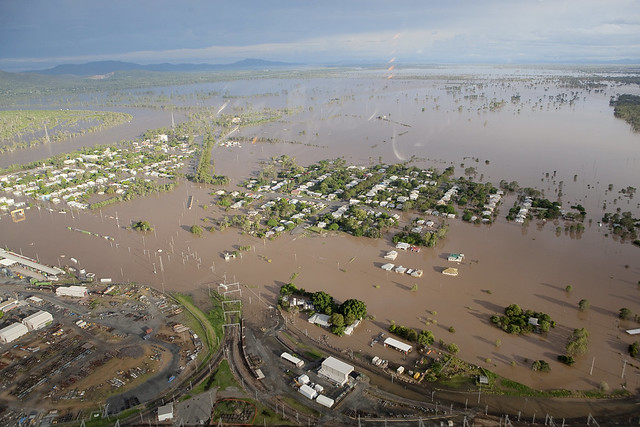
The Solomon Islands experienced heavy rains and flash floods following Tropical Cyclone Ita earlier this year. Over 50,000 people were affected and dozens killed, according to ReliefWeb. Infrastructure damage was extensive; entire houses were washed away and thousands lost their food gardens.

solomonfloods

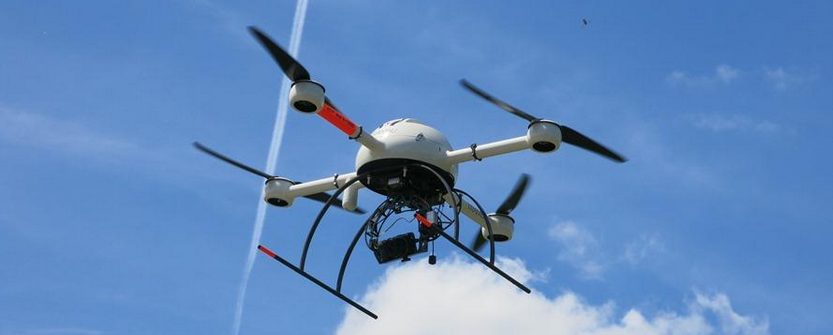
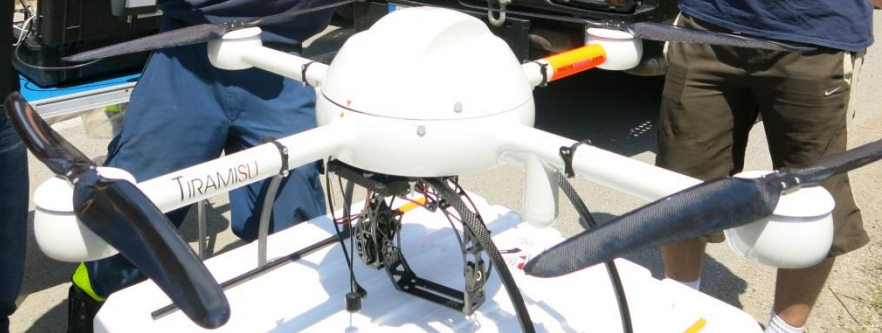
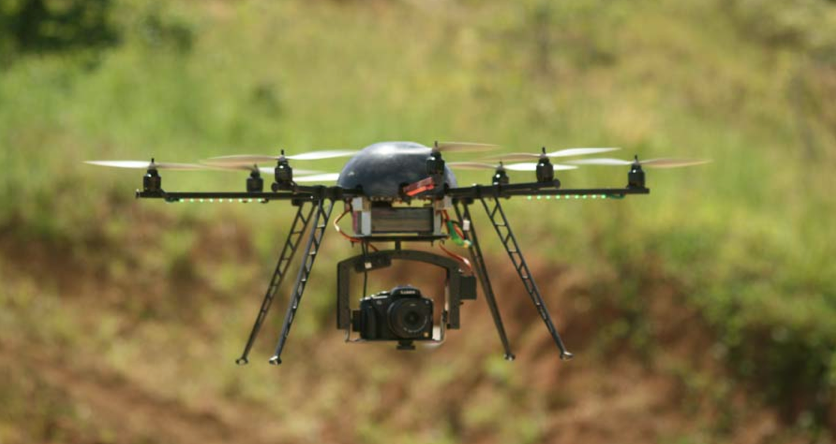
Disaster responders used a rotary-wing UAV (an “Oktocopter”) to assist with the damage assessment efforts. More specifically, the UAV was used to assess the extent of the flood damage in the most affected area along Mataniko River.

Solomons UAV

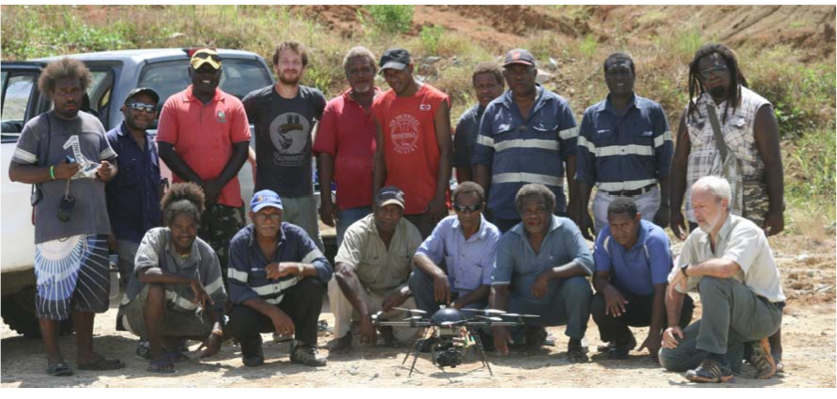
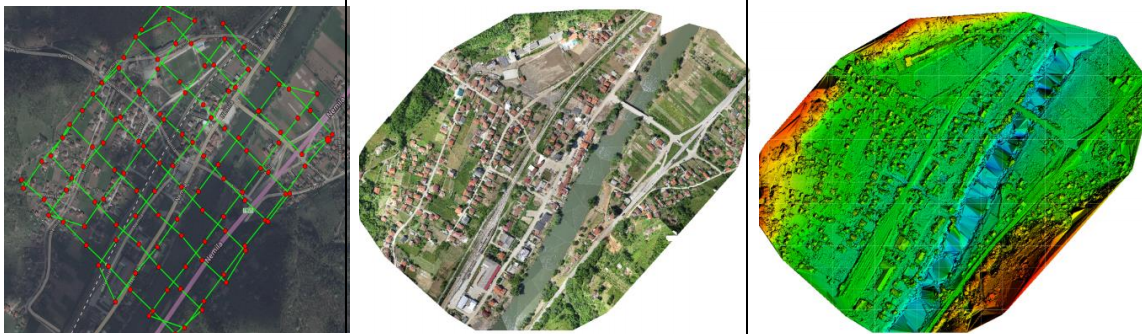
The UAV was also used to map an area proposed for resettlement. In addition, the UAV was flown over a dam to assess potential damage. These flights were pre-programmed and thus autonomous. (Here’s a quick video demo on how to program UAV flights for disaster response). The UAV was flown at 110 meters altitude in order to capture very high-resolution imagery. “The altitude of 110m also allowed for an operation below the traditional air space and ensured a continuous visibility of the UAV from the starting / landing position.”

Screen Shot 2014-09-25 at 4.04.49 AM

While responders faced several challenges with the UAV, they nevertheless stated that “The UAV was extremely useful for the required mapping” (PDF). Some of these challenges included the limited availability of batteries, which limited the number of UAV flights. The wind also posed a challenge.

Solomons Analysis

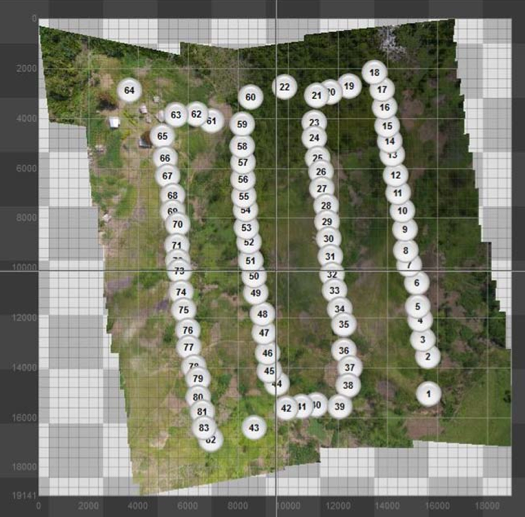
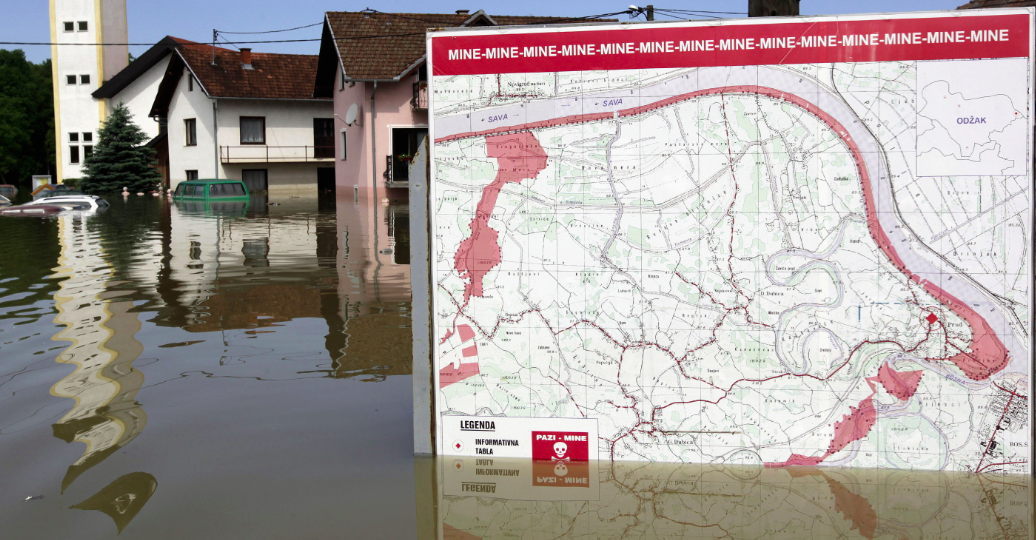
Responders took more than 800 pictures (during one 17 minute flight) over the above area which was proposed for resettlement. About 10% of these images were then stitched together to form the mosaic displayed above. The result below depicts flooded areas along Mataniko River. According to responders, “This image data can be utilized to demonstrate the danger of destruction to people who start to resettle in the Mataniko River Valley. These very high resolution images (~ 3 to 5 cm) show details such as destroyed cars, parts of houses, etc. which demonstrate the force of the high water.” In sum, “The maps together with the images of the river could be utilized to raise awareness not to settle again in these areas.”

Screen Shot 2014-09-25 at 4.14.33 AM

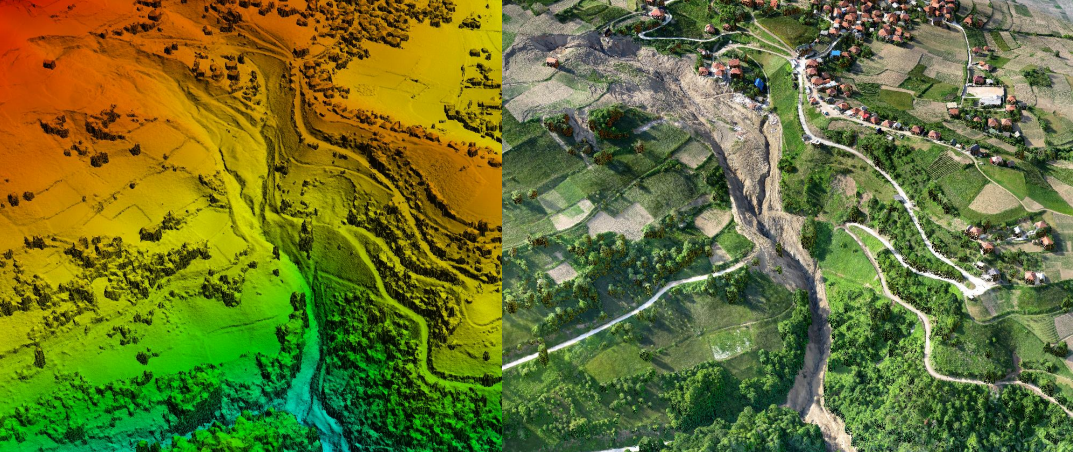
Images taken of the dam were used to create the Digital Terrain Model (DTM) below. This enables responders to determine areas where the dam is most likely to overflow due to damage or future floods.

Screen Shot 2014-09-25 at 4.15.40 AM

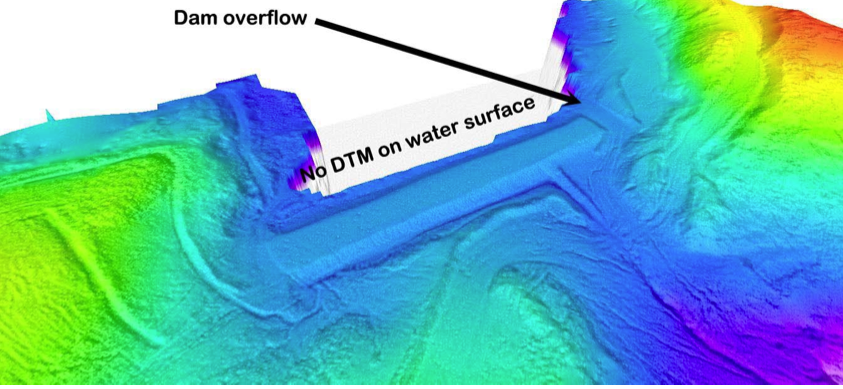
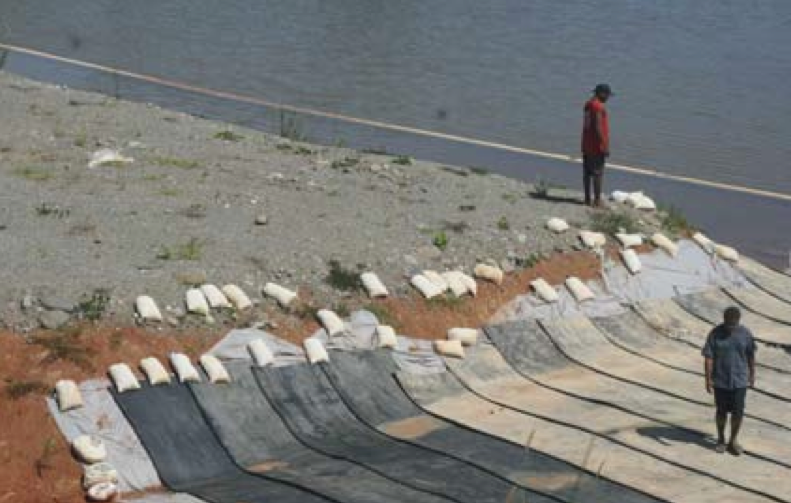
The result of this DTM analysis enables responders to target the placement of rubber mats fixed with sand bags around the damn’s most vulnerable points.

Solomons Dam

In conclusion, disaster responders write that the use of “UAVs for data acquisition can be highly recommended. The flexibility of an UAV can be of high benefit for mapping purposes, especially in cases where fast data acquisition is desired, e.g. natural hazards. An important advantage of a UAV as platform is that image data recording is performed at low height and not disturbed by cloud cover. In theory a fixed-wing UAV might be more efficient for rapid mapping. However, the DTM applications would not be possible in this resolution with a fixed wing UAV. Notably due to the flexibility for potential starting and landing areas and the handling of the topography characterized by step valleys and obstacles such as power lines between mountain tops within the study area. Especially within the flooded areas a spatially sufficient start and land area for fixed wing UAVs would have been hard to identify.”

Bio

See Also:

  • Official UN Policy Brief on Humanitarian UAVs [link]
  • Common Misconceptions About Humanitarian UAVs [link]
  • Humanitarians in the Sky: Using UAVs for Disaster Response [link]
  • Crisis Map of UAV Videos for Disaster Response [link]
  • Humanitarian UAV Missions During Balkan Floods [link]
  • UAVs, Community Mapping & Disaster Risk Reduction in Haiti [link]

Disaster Tweets Coupled With UAV Imagery Give Responders Valuable Data on Infrastructure Damage

My colleague Leysia Palen recently co-authored an important study (PDF) on tweets posted during last year’s major floods in Colorado. As Leysia et al. write, “Because the flooding was widespread, it impacted many canyons and closed off access to communities for a long duration. The continued storms also prevented airborne reconnaissance. During this event, social media and other remote sources of information were sought to obtain reconnaissance information […].”

1coloflood

The study analyzed 212,672 unique tweets generated by 57,049 unique Twitter users. Of these tweets, 2,658 were geo-tagged. The researchers combed through these geo-tagged tweets for any information on infrastructure damage. A sample of these are included below (click to enlarge). Leysia et al. were particularly interested in geo-tagged tweets with pictures of infrastructure damage.

Screen Shot 2014-09-07 at 3.17.34 AM

They overlaid these geo-tagged pictures on satellite and UAV/aerial imagery of the disaster-affected areas. The latter was captured by Falcon UAV. The satellite and aerial imagery provided the researchers with an easy way to distinguish between vegetation and water. “Most tweets appeared to fall primarily within the high flood hazard zones. Most bridges and roads that were located in the flood plains were expected to experience a high risk of damage, and the tweets and remote data confirmed this pattern.” According to Shideh Dashti, an assistant professor of civil, environmental and architectural engineering, and one of the co-authors, “we compared those tweets to the damage reported by engineering reconnaissance teams and they were well correlated.”

falcon uav flooding

To this end, by making use of real-time reporting by those affected in a region, including their posting of visual data,” Leysia and team “show that tweets may be used to directly support engineering reconnaissance by helping to digitally survey a region and navigate optimal paths for direct observation.” In sum, the results of this study demonstrate “how tweets, particularly with postings of visual data and references to location, may be used to directly support geotechnical experts by helping to digitally survey the affected region and to navigate optimal paths through the physical space in preparation for direct observation.”

Since the vast majority of tweets are not geo-tagged, GPS coordinates for potentially important pictures in these tweets are not available. The authors thus recommend looking into using natural language processing (NLP) techniques to “expose hazard-specific and site-specific terms and phrases that the layperson uses to report damage in situ.” They also suggest that a “more elaborate campaign that instructs people how to report such damage via tweets […] may help get better reporting of damage across a region.”

These findings are an important contribution to the humanitarian computing space. For us at QCRI, this research suggests we may be on the right track with MicroMappers, a crowdsourcing (technically a microtasking) platform to filter and geo-tag social media content including pictures and videos. MicroMappers was piloted last year in response to Typhoon Haiyan. We’ve since been working on improving the platform and extending it to also analyze UAV/aerial imagery. We’ll be piloting this new feature in coming weeks. Ultimately, our aim is for MicroMappers to create near real-time Crisis Maps that provide an integrated display of relevant Tweets, pictures, videos and aerial imagery during disasters.

Bio

See also:

  • Using AIDR to Automatically Collect & Analyze Disaster Tweet [link]
  • Crisis Map of UAV Videos for Disaster Response [link]
  • Humanitarians in the Sky: Using UAVs for Disaster Response [link]
  • Digital Humanitarian Response: Why Moving from Crowdsourcing to Microtasking is Important [link]

Humanitarian UAV Missions During Balkan Floods

The Balkans recently experienced the heaviest rains in 120 years of recorded weather measurements, causing massive flooding and powerful landslides. My colleague Haris Balta, a certified UAV pilot with the European Union’s ICARUS Unmanned Search & Rescue Project (and a member of the Humanitarian UAV Network, UAViators), was deployed to Bosnia to support relief efforts. During this time, another colleague, Peter Spruyt from the European Commission (DG JRC), was also deployed to the region to carry out a post-disaster needs assessment using UAVs.

Image: Flood in Bosnia and Herzegovina

Haris, who also works at the intersection of robotics and demining, was asked by the Government of the Federation of Bosnia and Herzegovina to identify the location of mines displaced due to the major flooding and mudslides. As it turns out, some mines were displaced as far as 23 kilometers. When the flood waters subsided and villagers returned, most were unaware of this imminent danger. Haris used a rotary-wing UAV (the quadcopter pictured below) and logged some 20 flights (both manual and autonomous) at more than a dozen locations.

ICARUS Quadcopter

Screen Shot 2014-07-02 at 9.41.49 AM

The purpose of these flights was to capture imagery that could be used to identify displaced land mines and to analyze the effects of landslides on other explosive remnants of war. Haris and team created 3D maps from the imagery and used geo-statistical modeling to try and determine in which direction land mines may have been displaced. The imagery also provided valuable information on dyke-breaches and other types of infrastructure damage.

Meanwhile, my colleague Peter from DG JRC (who is also a member of the Humanitarian UAV Network) flew a light fixed-wing UAV in five locations to support damage and needs assessments in close collaboration with the World Bank and the UN. According to Peter, both local and regional authorities were very supportive. Some of the resulting images and models of landslide areas are depicted below, courtesy of DG JRC (click to enlarge).

DG JRC

Screen Shot 2014-07-02 at 12.39.17 PM

Screen Shot 2014-07-02 at 12.31.18 PM

I just introduced Peter and Haris since they weren’t aware of each other’s respective efforts. If you’re participating in humanitarian UAV missions, please consider sharing you work with the Humanitarian UAV Network by posting a quick summary of your mission to the Network’s Operations page; even a one-sentence description will go a long way to facilitate information sharing.

bio

See Also:

  • Humanitarians in the Sky: Using UAVs for Disaster Response [link]
  • Crisis Map of UAV/Aerial Videos for Disaster Response [link]
  • Using UAVs for Search & Rescue [link]
  • Debrief: UAV/Drone Search & Rescue Challenge [link]
  • Crowdsourcing Analysis of UAV Imagery for Search/Rescue [link]
  • Check-List for Flying UAVs in Humanitarian Settings [link]

Using #Mythbuster Tweets to Tackle Rumors During Disasters

The massive floods that swept through Queensland, Australia in 2010/2011 put an area almost twice the size of the United Kingdom under water. And now, a year later, Queensland braces itself for even worse flooding:

Screen Shot 2013-01-26 at 11.38.38 PM

More than 35,000 tweets with the hashtag #qldfloods were posted during the height of the flooding (January 10-16, 2011). One of the most active Twitter accounts belonged to the Queensland Police Service Media Unit: @QPSMedia. Tweets from (and to) the Unit were “overwhelmingly focussed on providing situational information and advice” (1). Moreover, tweets between @QPSMedia and followers were “topical and to the point, significantly involving directly affected local residents” (2). @QPSMedia also “introduced innovations such as the #Mythbuster series of tweets, which aimed to intervene in the spread of rumor and disinformation” (3).

rockhampton floods 2011

On the evening of January 11, @QPSMedia began to post a series of tweets with #Mythbuster in direct response to rumors and misinformation circulating on Twitter. Along with official notices to evacuate, these #Mythbuster tweets were the most widely retweeted @QPSMedia messages.” They were especially successful. Here is a sample: “#mythbuster: Wivenhoe Dam is NOT about to collapse! #qldfloods”; “#mythbuster: There is currently NO fuel shortage in Brisbane. #qldfloods.”

Screen Shot 2013-01-27 at 12.19.03 AM

This kind of pro-active intervention reminds me of the #fakesandy hashtag used during Hurricane Sandy and FEMA’s rumor control initiative during Hurricane Sandy. I expect to see greater use of this approach by professional emergency responders in future disasters. There’s no doubt that @QPSMedia will provide this service again with the coming floods and it appears that @QLDonline is already doing so (above tweet). Brisbane’s City Council has also launched this Crowdmap marking latest road closures, flood areas and sandbag locations. Hoping everyone in Queensland stays safe!

In the meantime, here are some relevant statistics on the crisis tweets posted during the 2010/2011 floods in Queensland:

  • 50-60% of #qldfloods messages were retweets (passing along existing messages, and thereby  making them more visible); 30-40% of messages contained links to further information elsewhere on the Web.
  • During the crisis, a number of Twitter users dedicated themselves almost exclusively to retweeting #qldfloods messages, acting as amplifiers of emergency information and thereby increasing its reach.
  • #qldfloods tweets largely managed to stay on topic and focussed predominantly on sharing directly relevant situational information, advice, news media and multimedia reports.
  • Emergency services and media organisations were amongst the most visible participants in #qldfloods, especially also because of the widespread retweeting of their messages.
  • More than one in every five shared links in the #qldfloods dataset was to an image hosted on one of several image-sharing services; and users overwhelmingly depended on Twitpic and other Twitter-centric image-sharing services to upload and distribute the photographs taken on their smartphones and digital cameras
  • The tenor of tweets during the latter days of the immediate crisis shifted more strongly towards organising volunteering and fundraising efforts: tweets containing situational information and advice, and news media and multimedia links were retweeted disproportionately often.
  • Less topical tweets were far less likely to be retweeted.

Social Network Analysis of Tweets During Australia Floods

This study (PDF) analyzes the community of Twitter users who disseminated  information during the crisis caused by the Australian floods in 2010-2011. “In times of mass emergencies, a phenomenon known as collective behavior becomes apparent. It consists of socio-behaviors that include intensified information search and information contagion.” The purpose of the Australian floods analysis is to reveal interesting patterns and features of this online community using social network analysis (SNA).

The authors analyzed 7,500 flood-related tweets to understand which users did the tweeting and retweeting. This was done to create nodes and links for SNA, which was able to “identify influential members of the online communities that emerged during the Queensland, NSW and Victorian floods as well as identify important resources being referred to. The most active community was in Queensland, possibly induced by the fact that the floods were orders of mag-nitude greater than in NSW and Victoria.”

The analysis also confirmed “the active part taken by local authorities, namely Queensland Police, government officials and volunteers. On the other hand, there was not much activity from local authorities in the NSW and Victorian floods prompting for the greater use of social media by the authorities concerned. As far as the online resources suggested by users are concerned, no sensible conclusion can be drawn as important ones identified were more of a general nature rather than critical information. This might be comprehensible as it was past the impact stage in the Queensland floods and participation was at much lower levels in the NSW and Victorian floods.”

Social Network Analysis is an under-utilized methodology for the analysis of communication flows during humanitarian crises. Understanding the topology of a social network is key to information diffusion. Think of this as a virus infecting a network. If we want to “infect” a social network with important crisis information as quickly and fully as possible, understanding the network’ topology is a requirement as is, therefore, social network analysis.

Analyzing Disaster Tweets from Major Thai Floods

The 2011 Thai Floods was one of the country’s worst disasters in recent history.  The flooding began in July and lasted until December. Over 13 million people were affected. More than 800 were killed. The World Bank estimated $45 billion in total economic damage. This new study, “The Role of Twitter during a Natural Disaster: Case Study of 2011 Thai Flood,” analyzes how twitter was used during these major floods.

The number of tweets increase significantly in October, which is when the flooding reached parts of the Bangkok Metropolitan area. The month before (Sept-to-Oct) also a notable increase of tweets, which may “demonstrate that Thais were using Twitter to search for realtime and practical information that traditional media could not provide during the natural disaster period.”

To better understand the type of information shared on Twitter during the floods, the authors analyzed 175,551 tweets that used the hashtag #thaiflood. They removed “retweets” and duplicates, yielding a dataset of 64,582 unique tweets. Using keyword analysis and a rule based approach, the authors auto-matically classified these tweets into 5 categories:

Situational Announcements and Alerts: Tweets about up-to-date situational and location-based information related to the flood such as water levels, traffic conditions and road conditions in certain areas. In addition, emergency warnings from authorities advising citizens to evacuate areas, seek shelter or take other protective measures are also included.

Support Announcements: Tweets about free parking availability, free emergency survival kits distribution and free consulting services for home repair, etc.

Requests for Assistance: Tweets requesting any types of assistance; such as food, water, medical supplies, volunteers or transportation.

Requests for Information: Tweets including general inquiries related to the flood and flood relief such as inquiries for telephone numbers of relevant authorities, regarding the current situation in specific locations and about flood damage compensation.

Other: Tweets including all other messages, such as general comments; complaints and expressions of opinions.

The results of this analysis are shown in the figures below. The first shows the number of tweets per each category, while the second shows the distribution of these categories over time.

Messages posted during the first few weeks “included current water levels in certain areas and roads; announcements for free parking availability; requests for volunteers to make sandbags and pack emergency survival kits; announce-ments for evacuation in certain areas and requests for boats, food, water supplies and flood donation information. For the last few weeks when water started to recede, Tweet messages included reports on areas where water had receded, information on home cleaning andrepair and guidance regarding the process to receive flood damage compensation from the government.”

To determine the credibility of tweets, the authors identify the top 10 most re-tweeted users during the floods. They infer that the most retweeted tweets signal that the content of said tweets is perceived as credible. “The majority of these top users are flood/disaster related government or private organizations.” Siam Arsa, one of the leading volunteer networks helping flood victims in Thailand, was one of the top users ranked by retweets. The group utilizes social media on both Facebook  (www.facebook.com/siamarsa) and Twitter (@siamarsa) to share information about flooding and related volunteer work.”

In conclusion, “if the government plans to implement social media as a tool for disaster response, it would be well advised to prepare some measures or pro-tocols that help officials verify incoming information and eliminate false information. The  citizens should also be educated to take caution when receiving news and information via social media, and to think carefully about the potential effect before disseminating certain content.”

Gov Twitter

My QCRI colleagues and I are collecting tweets about Typhoon Pablo, which is making landfall in the Philippines. We’re specifically tracking tweets with one or more of the following hashtags: #PabloPh, #reliefPH and #rescuePH, which the government is publicly encouraging Filipinos to use. We hope to carry out an early analysis of these tweets to determine which ones provide situational aware-ness. The purpose of this applied action research is to ultimately develop a real-time dashboard for humanitarian response. This explains why we launched this Library of Crisis Hashtags. For further reading, please see this post on “What Percentage of Tweets Generated During a Crisis Are Relevant for Humanitarian Response?”

Crowdsourcing Crisis Response Following Philippine Floods

Widespread and heavy rains resulting from Typhoon Haikui have flooded the Philippine capital Manila. Over 800,000 have been affected by the flooding and some 250,000 have been relocated to evacuation centers. Given the gravity of the situation, “some resourceful Filipinos put up an online spreadsheet where concerned citizens can list down places where help is most urgently needed” (1). Meanwhile, Google’s Crisis Response Team has launched this resource page  which includes links to News updates, Emergency contact information, Person Finder and this shelter map.

Filipinos volunteers are using an open (but not editable) Google Spreadsheet and crowdsourcing reports using this Google Form to collect urgent reports on needs. The spreadsheet (please click the screenshot below to enlarge) includes time of incident, location (physical address), a description of the alert (many include personal names and phone numbers) and the person it was reported by. Additional fields include status of the alert, the urgency of this alert and whether action has been taken. The latter is also color coded.

“The spreadsheet can easily be referenced by any rescue group that can access the web, and is constantly updated by volunteers real-time” (2). This reminds me a lot of the Google Spreadsheets we used following the Haiti Earthquake of 2010. The Standby Volunteer Task Force (SBTF) continues to use Google Spreadsheets in similar aways but for the purposes of media monitoring and these are typically not made public. What is noteworthy about these important volunteer efforts in the Philippines is that the spreadsheet was made completely public in order to crowdsource the response.

As I’ve noted before, emergency management professionals cannot be every-where at the same time, but the crowd is always there. The tradeoff with the use of open data to crowdsource crisis response is obviously privacy and data protection. Volunteers may therefore want to let those filling out the Google Form know that any information they provide will or may be made public. I would also recommend that they create an “About Us” or “Who We Are” link to cultivate a sense of trust with the initiative. Finally, crowdsourcing offers-for-help may facilitate the “matchmaking” of needs and available resources.

I would give the same advice to volunteers who recently setup this Crowdmap of the floods. I would also suggest they set up their own Standby Volunteer Task Force (SBTF) in order to deploy again in the future. In the meantime, reports on flood levels can be submitted to the crisis map via webform, email and SMS.

Crowdsourcing a Crisis Map of the Beijing Floods: Volunteers vs Government

Flash floods in Beijing have killed over 70 people and forced the evacuation of more than 50,000 after destroying over 8,000 homes and causing $1.6 billion in damages. In total, some 1.5 million people have been affected by the floods after Beijing recorded the heaviest rainfall the city has seen in more than 60 years.

The heavy rains began on July 21. Within hours, users of the Guokr.com social network launched a campaign to create a live crisis map of the flood’s impact using Google Maps. According to TechPresident, “the result was not only more accurate than the government output—it was available almost a day earlier. According to People’s Daily Online, these crowd-sourced maps were widely circulated on Weibo [China’s version of Twitter] the Monday and Tuesday after the flooding.” The crowdsourced, citizen-generated flood map of Beijing is available here and looks like this:

One advantage of working with Google is that the crisis map can also be viewed via Google Earth. That said, the government does block a number of Google services in China, which puts the regime at a handicap during disasters.

This is an excellent example of crowdsourced crisis mapping. My one recommen-dation to Chinese volunteers would be to crowdsource solutions in addition to problems. In other words, map offers of help and turn the crisis map into a local self-help map, i.e., a Match.com for citizen-based humanitarian response. In short, use the map as a platform for self-organization and crowdsource response by matching calls for help with corresponding offers of help. I would also recommend they create their own Standby Volunteer Task Force (SBTF) for crisis mapping to build social capital and repeat these efforts in future disasters.

Several days after Chinese volunteers first launched their crisis map, the Beijing Water Authority released its own map, which looks like a classic example of James Scott’s “Seeing Like a State.” The map is difficult to read and it is unclear whether the map is even a dynamic or interactive, or live for that matter. It appears static and cryptic. One wonders whether these adjectives also describe the government’s response.

Meanwhile, there is growing anger over the state’s botched response to the floods. According to People’s Daily, “Chinese netizens have criticised the munici-pal authority for failing to update the city’s run-down drainage system or to pre-warn residents about the impending disaster.” In other cities, Guangdong Mobile (the local division of China Mobile) sent out 30 million SMS about the storm in cooperation with the provincial government. “Mobile users in Shenzhen, Zhongshan, Zhuhai, Jiangmen, and Yunfu received reminders to be careful from the telecom company because those five cities were forecast to be most affected by the storm.”

All disasters are political. They test the government’s capacity. The latter’s inability to respond swiftly and effectively has repercussions on citizens’ perception of governance and statehood. The more digital volunteers engage in crisis mapping, the more they highlight the local capacity and agency of ordinary citizens to create shared awareness and help themselves—with or without the state. In doing so, volunteers build social capital, which facilitates future collective action both on and offline. If government officials are not worried about their own failures in disaster management, they should be. This failure will continue to have political consequences, in China and elsewhere.

Crowdsourcing Solutions and Crisis Information during the Renaissance

The Bristol Channel Floods of January 30, 1607 reportedly caused the largest loss of life from any sudden onset natural disaster in the UK in the past 500 years. “As there were no newspapers at the time, principal accounts reporting the impact of the flood survive in a small number of pamphlets privately printed in London. These original pamphlets […] with titles like Lamentable Newes out of Monmouthshire and Newes of out Summerset-shire, were sold by printers who also published Shakespeare” (RMS 2007).

Clearly, crowdsourcing is not new, only the word is. After all, crowdsourcing is a methodology, not a technology nor an industry. Perhaps one of my favorite examples of crowdsourcing during the Renaissance surrounds the invention of the marine chronometer, which completely revolutionized long distance sea travel. Thousands of lives were being lost in shipwrecks because longitude coordinates were virtually impossible to determine in the open seas. Finding a solution this problem became critical as the Age of Sail dawned on many European empires. 

So the Spanish King, Dutch Merchants and others turned to crowdsourcing by offering major prize money for a solution. The British government even launched the “Longitude Prize” which was established through an Act of Parliament in 1714 and administered by the “Board of Longitude.” This board brought together the greatest scientific minds of the time to work on the problem, including Sir Isaac Newton. Galileo was also said to have taken up the challenge. 

The main prizes included: “£10,000 for a method that could determine longitude within 60 nautical miles (111 km); £15,000 for a method that could determine longitude within 40 nautical miles (74 km); and £20,000 for a method that could determine longitude within 30 nautical miles (56 km).” Note that £20,000 in 1714 is around $4.7 million dollars today. The $1 million Netflix Prize launched 400 years later pales in comparison.” In addition, the Board had the discretion to make awards to persons who were making significant contributions to the effort or to provide financial support to those who were working towards a solution. The Board could also make advances of up to £2,000 for experimental work deemed promising.” 

Interestingly, the person who provided the most breakthroughs—and thus received the most prize money—was the son of a carpenter, the self-educated British clockmaker John Harrison.  And so, as noted by Peter LaMotte, “by allowing anyone to participate in solving the problem, a solution was found for a puzzle that had baffled some of the brightest minds in history (even Galileo!). In the end, it was found by someone who would never have been tapped to solve it to begin with.”

I’d love to see a “Manual GPS Prize” to find very simple, virtually free and highly scalable solutions for accurate geo-location. This means no GPS units and no smart phones—preferably no cell phones at all actually. Something along the lines of WalkingPapers but without the need to print out satellite imagery and scan anything. Impossible? What if the prize for a solution were $4.7 million?

Interested in more examples of crowdsourcing from way back when? Then check-out Peter’s recent blog post and my earlier post entitled “Calling 911: What Humanitarians Can Learn from 50 Years of Crowdsourcing.” Have other examples to share? Please add them to the comments section, thanks!