Tag Archives: Micro

Using Twitter to Detect Micro-Crises in Real-Time

Social media is increasingly used to communicate during major crises. But what about small-scale incidents such as a car crash or fire? These “micro-crises” typically generate a far smaller volume of social media activity during a much shorter period and more bounded geographical area. Detecting these small-scale events thus poses an important challenge for the field of Crisis Computing.

Axel Shulz et al

Axel Schulz just published co-authored a paper on this exact challenge. In this study, he and co-authors Petar Ristoski & Heiko Paulheim “present a solution for a real-time identifi cation of small scale incidents using microblogs,” which uses machine learning—combining text classi cation and semantic enrichment of microblogs—to increase situational awareness. The study draws on 7.5 million tweets posted in the city centers of Seattle and Memphis during November & December 2012 and February 2013. The authors used the “Seattle Real Time Fire 911 Calls” dataset to identify relevant keywords in the collected tweets. They also used WordNet to “extend this set by adding the direct hyponyms. For instance, the keyword “accident” was extended with ‘collision’, ‘crash’, ‘wreck’, ‘injury’, ‘fatal accident’, and ‘casualty’.”

An evaluation of this combined “text classi cation” and “semantic enrichment” approach shows that small scale incidents can be identified with an accuracy 89%. A copy of Axel et al.‘s paper is available here (PDF). This is a remarkable level of accuracy given the rare and micro-level nature of the incidents studied.

bio

Introducing MicroMappers for Digital Disaster Response

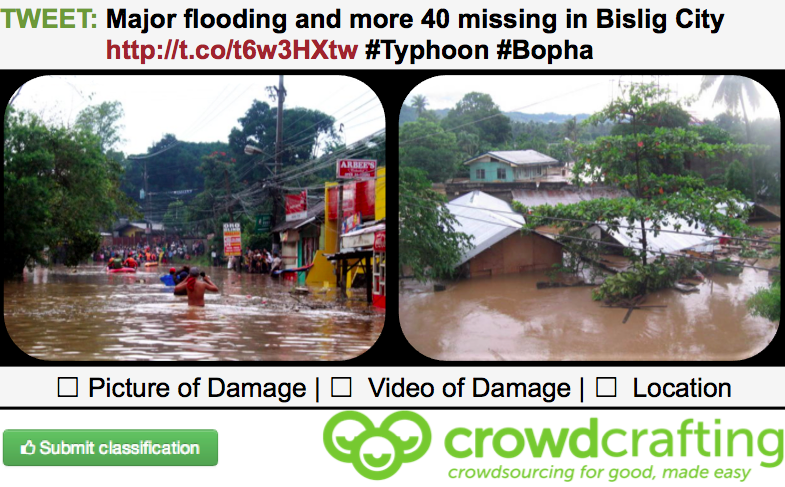
The UN activated the Digital Humanitarian Network (DHN) on December 3, 2012 to carry out a rapid damage needs assessment in response to Typhoon Pablo in the Philippines. More specifically, the UN requested that Digital Humanitarians collect and geo-reference all tweets with links to pictures or video footage capturing Typhoon damage. To complete this mission, I reached out to my colleagues at CrowdCrafting. Together, we customized a microtasking app to filter, classify and geo-reference thousands of tweets. This type of rapid damage assessment request was the first of its kind, which means that setting up the appropriate workflows and technologies took a while, leaving less time for the tagging, verification and analysis of the multimedia content pointed to in the disaster tweets. Such is the nature of innovation; optimization takes place through iteration and learning.

Microtasking is key to the future of digital humanitarian response, which is precisely why I am launching MicroMappers in partnership with CrowdCrafting. MicroMappers, which combimes the terms Micro-Tasking and Crisis-Mappers, is a collection of free & open source microtasking apps specifically customized and optimized for digital disaster response. The first series of apps focus on rapid damage assessment activations. In other words, the apps include Translate, Locate and Assess. The Translate & Locate Apps are self-explanatory. The Assess App enables digital volunteers to quickly tag disaster tweets that link to relevant multimedia that captures disaster damage. This app also invites volunteers to rate the level of damage in each image and video.

For example, say an earthquake strikes Mexico City. We upload disaster tweets with links to the Translate App. Volunteer translators only translate tweets with location information. These get automatically pushed to the Assess App where digital volunteers tag tweets that point to relevant images/videos. They also rate the level of damage in each. (On a side note, my colleagues and I at QCRI are also developing a crawler that will automatically identify whether links posted on twitter actually point to images/videos). Assessed  tweets are then pushed in real-time to the Locate App for geo-referencing. The resulting tweets are subsequently published to a live map where the underlying data can also be downloaded.  Both the map & data download feature can be password protected.

The plan is to have these apps online and live 24/7 in the event of an activation request. When a request does come in, volunteers with the Digital Humanitarian Network will simply go to MicroMappers.com (not yet live) to start using the apps right away. Members of the public will also be invited to support these efforts and work along side digital humanitarian volunteers. In other words, the purpose of the MicroMappers Apps is not only to facilitate and accelerate digital humanitarian efforts but also to radically democratize these efforts by increasing the participation base. To be sure, one doesn’t need prior training to microtask, simply being able to read and access the web will make you an invaluable member of the team.

We plan to have the MicroMappers Apps completed in May/June September for testing by members of the Digital Humanitarian Network. In the meantime, huge thanks to our awesome partners at CrowdCrafting for making all of this possible! If you’re a coder and interested in contributing to these efforts, please feel free to get in touch with me. We may be able to launch and test these apps earlier with your help. After all, disasters won’t wait until we’re ready and we have several more disaster response apps that are in need of customization.

bio

Using Ushahidi Data to Study the Micro-Dynamics of Violent Conflict

The field of conflict analysis has long been handicapped by the country-year straightjacket. This is beginning to change thanks to the increasing availability of subnational and sub-annual conflict data. In the past, one was limited to macro-level data, such as the number of casualties resulting from violent conflict in a given county and year. Today, datasets such as the Armed Conflict Location Event Data (ACLED) provide considerably more temporal and spatial resolution. Another example is this quantitative study: “The Micro-dynamics of Reciprocity in an Asymmetric Conflict: Hamas, Israel, and the 2008-2009 Gaza Conflict,” authored by by NYU PhD Candidate Thomas Zeitzoff.

Picture 5

I’ve done some work on conflict event-data and reciprocity analysis in the past (such as this study of Afghanistan), but Thomas is really breaking new ground here with the hourly temporal resolution of the conflict analysis, which was made possible by Al-Jazeera’s War on Gaza project powered by the Ushahidi platform.

ABSTRACT

The Gaza Conflict (2008-2009) between Hamas and Israel was de fined the participants’ strategic use of force. Critics of Israel point to the large number of Palestinian casualties compared to Israelis killed as evidence of a disproportionate Israeli response. I investigate Israeli and Hamas response patterns by constructing a unique data set of hourly conflict intensity scores from new social media and news source over the nearly 600 hours of the conflict. Using vector autoregression techniques (VAR), I fi nd that Israel responds about twice as intensely to a Hamas escalation as Hamas responds to an Israeli escalation. Furthermore, I find that both Hamas’ and Israel’s response patterns change once the ground invasion begins and after the UN Security Council votes. (Study available as PDF here).

As Thomas notes, “Ushahidi worked with Al-Jazeera to track events on the ground in Gaza via SMS messages, email, or the web. Events were then sent in by reporters and civilians through the platform and put into a Twitter feed entitled AJGaza, which gave the event a time stamp. By cross-checking with other sources such as Reuters, the UN, and the Israeli newspaper Haaretz, I was able see that the time stamp was usually within a few minutes of event occurrence.”

Key Highlights from the study:

  • Hamas’ cumulative response intensity to an Israeli escalation decreases (by about 17 percent) after the ground invasion begins. Conversely, Israel’s cumulative response intensity after the invasion increases by about three fold.
  • Both Hamas and Israel’s cumulative response drop after the UN Security Council vote on January 8th, 2009 for an immediate cease-fi re, but Israel’s drops more than Hamas (about 30 percent to 20 percent decrease).
  • For the period covering the whole conflict, Hamas would react (on average) to a “surprise” 1 event (15 minute interval) of Israeli misinformation/psy-ops with the equivalent of 1 extra incident of mortar re/endangering civilians.
  • Before the invasion, Hamas would respond to a 1 hour shock of targeted air strikes with 3 incidents of endangering civilians. Comparatively, after the invasion, Hamas would only respond to that same Israeli shock with 3 incidents of psychological warfare.
  • The results con firm my hypotheses that Israel’s reactions were more dependent upon Hamas and that these responses were contextually dependent.
  • Wikipedia’s Timeline of the 2008-2009 Gaza Conflict was particularly helpful in sourcing and targeting events that might have diverging reports (i.e. controversial).

[An earlier version of this blog post appeared on my Early Warning blog]