Tag Archives: MicroMappers

Crowdsourcing Point Clouds for Disaster Response

Point Clouds, or 3D models derived from high resolution aerial imagery, are in fact nothing new. Several software platforms already exist to reconstruct a series of 2D aerial images into fully fledged 3D-fly-through models. Check out these very neat examples from my colleagues at Pix4D and SenseFly:

What does a castle, Jesus and a mountain have to do with humanitarian action? As noted in my previous blog post, there’s only so much disaster damage one can glean from nadir (that is, vertical) imagery and oblique imagery. Lets suppose that the nadir image below was taken by an orbiting satellite or flying UAV right after an earthquake, for example. How can you possibly assess disaster damage from this one picture alone? Even if you had nadir imagery for these houses before the earthquake, your ability to assess structural damage would be limited.

Screen Shot 2015-04-09 at 5.48.23 AM

This explains why we also captured oblique imagery for the World Bank’s UAV response to Cyclone Pam in Vanuatu (more here on that humanitarian mission). But even with oblique photographs, you’re stuck with one fixed perspective. Who knows what these houses below look like from the other side; your UAV may have simply captured this side only. And even if you had pictures for all possible angles, you’d literally have 100’s of pictures to leaf through and make sense of.

Screen Shot 2015-04-09 at 5.54.34 AM

What’s that famous quote by Henry Ford again? “If I had asked people what they wanted, they would have said faster horses.” We don’t need faster UAVs, we simply need to turn what we already have into Point Clouds, which I’m indeed hoping to do with the aerial imagery from Vanuatu, by the way. The Point Cloud below was made only from single 2D aerial images.

It isn’t perfect, but we don’t need perfection in disaster response, we need good enough. So when we as humanitarian UAV teams go into the next post-disaster deployment and ask what humanitarians they need, they may say “faster horses” because they’re not (yet) familiar with what’s really possible with the imagery processing solutions available today. That obviously doesn’t mean that we should ignore their information needs. It simply means we should seek to expand their imaginations vis-a-vis the art of the possible with UAVs and aerial imagery. Here is a 3D model of a village in Vanuatu constructed using 2D aerial imagery:

Now, the title of my blog post does lead with the word crowdsourcing. Why? For several reasons. First, it takes some decent computing power (and time) to create these Point Clouds. But if the underlying 2D imagery is made available to hundreds of Digital Humanitarians, we could use this distributed computing power to rapidly crowdsource the creation of 3D models. Second, each model can then be pushed to MicroMappers for crowdsourced analysis. Why? Because having a dozen eyes scrutinizing one Point Cloud is better than 2. Note that for quality control purposes, each Point Cloud would be shown to 5 different Digital Humanitarian volunteers; we already do this with MicroMappers for tweets, pictures, videos, satellite images and of course aerial images as well. Each digital volunteer would then trace areas in the Point Cloud where they spot damage. If the traces from the different volunteers match, then bingo, there’s likely damage at those x, y and z coordinate. Here’s the idea:

We could easily use iPads to turn the process into a Virtual Reality experience for digital volunteers. In other words, you’d be able to move around and above the actual Point Cloud by simply changing the position of your iPad accordingly. This technology already exists and has for several years now. Tracing features in the 3D models that appear to be damaged would be as simple as using your finger to outline the damage on your iPad.

What about the inevitable challenge of Big Data? What if thousands of Point Clouds are generated during a disaster? Sure, we could try to scale our crowd-sourcing efforts by recruiting more Digital Humanitarian volunteers, but wouldn’t that just be asking for a “faster horse”? Just like we’ve already done with MicroMappers for tweets and text messages, we would seek to combine crowdsourcing and Artificial Intelligence to automatically detect features of interest in 3D models. This sounds to me like an excellent research project for a research institute engaged in advanced computing R&D.

I would love to see the results of this applied research integrated directly within MicroMappers. This would allow us to integrate the results of social media analysis via MicroMappers (e.g, tweets, Instagram pictures, YouTube videos) directly with the results of satellite imagery analysis as well as 2D and 3D aerial imagery analysis generated via MicroMappers.

Anyone interested in working on this?

How Digital Jedis Are Springing to Action In Response To Cyclone Pam

Digital Humanitarians sprung to action just hours after the Category 5 Cyclone collided with Vanuatu’s many islands. This first deployment focused on rapidly assessing the damage by analyzing multimedia content posted on social media and in the mainstream news. This request came directly from the United Nations (OCHA), which activated the Digital Humanitarian Network (DHN) to carry out the rapid damage assessment. So the Standby Task Force (SBTF), a founding member of the DHN, used QCRI′s MicroMappers platform to produce a digital, interactive Crisis Map of some 1,000+ geo-tagged pictures of disaster damage (screenshot below).

MM_ImageMap_Vanuatu

Within days of Cyclone Pam making landfall, the World Bank (WB) activated the Humanitarian UAV Network (UAViators) to quickly deploy UAV pilots to the affected islands. UAViators has access to a global network of 700+ professional UAV pilots is some 70+ countries worldwide. The WB identified two UAV teams from the Humanitarian UAV Network and deployed them to capture very high-resolution aerial photographs of the damage to support the Government’s post-disaster damage assessment efforts. Pictures from these early UAV missions are available here. Aerial images & videos of the disaster damage were also posted to the UAViators Crowdsourced Crisis Map.

Last week, the World Bank activated the DHN (for the first time ever) to help analyze the many, many GigaBytes of aerial imagery from Vanuatu. So Digital Jedis from the DHN are now using Humanitarian OpenStreetMap (HOT) and MicroMappers (MM) to crowdsource the search for partially damaged and fully destroyed houses in the aerial imagery. The OSM team is specifically looking at the “nadir imagery” captured by the UAVs while MM is exclusively reviewing the “oblique imagery“. More specifically, digital volunteers are using MM to trace destroyed houses red, partially damaged houses orange, and using blue to denote houses that appear to have little to no damage. Below is an early screenshot of the Aerial Crisis Map for the island of Efate. The live Crisis Map is available here.

Screen Shot 2015-04-06 at 10.56.09 AM

Clicking on one of these markers will open up the high resolution aerial pictures taken at that location. Here, two houses are traced in blue (little to no damage) and two on the upper left are traced in orange (partial damage expected).

Screen Shot 2015-04-06 at 10.57.17 AM

The cameras on the UAVs captured the aerial imagery in very high resolution, as you can see from the close up below. You’ll note two traces for the house. These two traces were done by two independent volunteers (for the purposes of quality control). In fact, each aerial image is shown to at least 3 different Digital Jedis.

Screen Shot 2015-04-06 at 10.58.31 AM

Once this MicroMappers deployment is over, we’ll be using the resulting traces to create automated featured detection algorithms; just like we did here for the MicroMappers Namibia deployment. This approach, combining crowdsourcing with Artificial Intelligence (AI), is explored in more detail here vis-a-vis disaster response. The purpose of taking this hybrid human-machine computing solution is to accelerate (semi-automate) future damage assessment efforts.

Meanwhile, back in Vanuatu, the HOT team has already carried out some tentative, preliminary analysis of the damage based on the aerial imagery provided. They are also up-dating their OSM maps of the affected islands thanks this imagery. Below is an initial damage assessment carried out by HOT for demonstration purposes only. Please visit their deployment page on the Vanuatu response for more information.

2015-04-04_18h04_00

So what’s next? Combining both the nadir and oblique imagery to interpret disaster damage is ultimately what is needed, so we’re actually hoping to make this happen (today) by displaying the nadir imagery directly within the Aerial Crisis Map produced by MicroMappers. (Many thanks to the MapBox team for their assistance on this). We hope this integration will help HOT and our World Bank partners better assess the disaster damage. This is the first time that we as a group are doing anything like this, so obviously lots of learning going on, which should improve future deployments. Ultimately, we’ll need to create 3D models (point clouds) of disaster affected areas (already easy to do with high-resolution aerial imagery) and then simply use MicroMappers to crowdsource the analysis of these 3D models.

And here’s a 3D model of a village in Vanuatu constructed using 2D aerial photos taken by UAV:

For now, though, Digital Jedis will continue working very closely with the World Bank to ensure that the latter have the results they need in the right format to deliver a comprehensive damage assessment to the Government of Vanuatu by the end of the week. In the meantime, if you’re interested in learning more about digital humanitarian action, then please check out my new book, which features UAViators, HOT, MM and lots more.

Aerial Imagery Analysis: Combining Crowdsourcing and Artificial Intelligence

MicroMappers combines crowdsourcing and artificial intelligence to make sense of “Big Data” for Social Good. Why artificial intelligence (AI)? Because regular crowdsourcing alone is no match for Big Data. The MicroMappers platform can already be used to crowdsource the search for relevant tweets as well as pictures, videos, text messages, aerial imagery and soon satellite imagery. The next step is therefore to add artificial intelligence to this crowdsourced filtering platform. We have already done this with tweets and SMS. So we’re now turning our attention to aerial and satellite imagery.

Our very first deployment of MicroMappers for aerial imagery analysis was in Africa for this wildlife protection project. We crowdsourced the search for wild animals in partnership with rangers from the Kuzikus Wildlife Reserve based in Namibia. We were very pleased with the results, and so were the rangers. As one of them noted: “I am impressed with the results. There are at times when the crowd found animals that I had missed!” We were also pleased that our efforts caught the attention of CNN. As noted in that CNN report, our plan for this pilot was to use crowdsourcing to find the wildlife and to then combine the results with artificial intelligence to develop a set of algorithms that can automatically find wild animals in the future.

To do this, we partnered with a wonderful team of graduate students at EPFL, the well known polytechnique in Lausanne, Switzerland. While these students were pressed for time due to a number of deadlines, they were nevertheless able to deliver some interesting results. Their applied, computer vision research is particularly useful given our ultimate aim: to create an algorithm that can learn to detect features of interest in aerial and satellite imagery in near real-time (as we’re interested in applying this to disaster response and other time-sensitive events). For now, however, we need to walk before we can run. This means carrying out the tasks of crowdsourcing and artificial intelligence in two (not-yet-integrated) steps.

MM Oryx

As the EPFL students rightly note in their preliminary study, the use of thermal imaging (heat detection) to automatically identify wildlife in the bush is some-what problematic since “the temperature difference between animals and ground is much lower in savannah […].” This explains why the research team used the results of our crowdsourcing efforts instead. More specifically, they focused on automatically detecting the shadows of gazelles and ostriches by using an object based support vector machine (SVM). The whole process is summarized below.

Screen Shot 2015-02-09 at 12.46.38 AM

The above method produces results like the one below (click to enlarge). The circles represents the objects used to train the machine learning classifier. The discerning reader will note that the algorithm has correctly identified all the gazelles save for one instance in which two gazelles were standing close together were identified as one gazelle. But no other objects were mislabeled as a gazelle. In other words, EPFL’s gazelle algorithm is very accurate. “Hence the classifier could be used to reduce the number of objects to assess manually and make the search for gazelles faster.” Ostriches, on the other hand, proved more difficult to automatically detect. But the students are convinced that this could be improved if they had more time.

Screen Shot 2015-02-09 at 12.56.17 AM

In conclusion, more work certainly needs to be done, but I am pleased by these preliminary and encouraging results. In addition, the students at EPFL kindly shared some concrete features that we can implement on the MicroMappers side to improve the crowdsourced results for the purposes of developing automated algorithms in the future. So a big thank you to Briant, Millet and Rey for taking the time to carry out the above research. My team and I at QCRI very much look forward to continuing our collaboration with them and colleagues at EPFL.

In the meantime, more on all this in my new bookDigital Humanitarians: How Big Data is Changing the Face of Humanitarian Response, which has already been endorsed by faculty at Harvard, MIT, Stanford, Oxford, etc; and by experts at the UN, World Bank, Red Cross, Twitter, etc.

MicroMappers: Towards Next Generation Humanitarian Technology

The MicroMappers platform has come a long way and still has a ways to go. Our vision for MicroMappers is simple: combine human computing (smart crowd-sourcing) with machine computing (artificial intelligence) to filter, fuse and map a variety of different data types such as text, photo, video and satellite/aerial imagery. To do this, we have created a collection of “Clickers” for MicroMappers. Clickers are simply web-based crowdsourcing apps used to make sense of “Big Data”. The “Text Cicker” is used to filter tweets & SMS’s; “Photo Clicker” to filter photos; “Video Clicker” to filter videos and yes the Satellite & Aerial Clickers to filter both satellite and aerial imagery. These are the Data Clickers. We also have a collection of Geo Clickers that digital volunteers use to geo-tag tweets, photos and videos filtered by the Data Clickers. Note that these Geo Clickers auto-matically display the results of the crowdsourced geo-tagging on our MicroMaps like the one below.

MM Ruby Tweet Map

Thanks to our Artificial Intelligence (AI) engine AIDR, the MicroMappers “Text Clicker” already combines human and machine computing. This means that tweets and text messages can be automatically filtered (classified) after some initial crowdsourced filtering. The filtered tweets are then pushed to the Geo Clickers for geo-tagging purposes. We want to do the same (semi-automation) for photos posted to social media as well as videos; although this is still a very active area of research and development in the field of computer vision.

So we are prioritizing our next hybrid human-machine computing efforts on aerial imagery instead. Just like the “Text Clicker” above, we want to semi-automate feature detection in aerial imagery by adding an AI engine to the “Aerial Clicker”. We’ve just starting to explore this with computer vision experts in Switzerland and Canada. Another development we’re eyeing vis-a-vis UAVs is live video streaming. To be sure, UAVs will increasingly be transmitting live video feeds directly to the web. This means we may eventually need to develop a “Streaming Clicker”, which would in some respects resemble our existing “Video Clicker” except that the video would be broadcasting live rather than play back from YouTube, for example. The “Streaming Clicker” is for later, however, or at least until a prospective partner organization approaches us with an immediate and compelling social innovation use-case.

In the meantime, my team & I at QCRI will continue to improve our maps (data visualizations) along with the human computing component of the Clickers. The MicroMappers smartphone apps, for example, need more work. We also need to find partners to help us develop apps for tablets like the iPad. In addition, we’re hoping to create a “Translate Clicker” with Translators Without Borders (TWB). The purpose of this Clicker would be to rapidly crowdsource the translation of tweets, text messages, etc. This could open up rather interesting possibilities for machine translation, which is certainly an exciting prospect.

MM All Map

Ultimately, we want to have one and only one map to display the data filtered via the Data and Geo Clickers. This map, using (Humanitarian) OpenStreetMap as a base layer, would display filtered tweets, SMS’s, photos, videos and relevant features from satellite and UAV imagery. Each data type would simply be a different layer on this fused “Meta-Data Crisis Map”; and end-users would simply turn individual layers on and off as needed. Note also the mainstream news feeds (CNN and BBC) depicted in the above image. We’re working with our partners at UN/OCHA, GDELT & SBTF to create a “3W Clicker” to complement our MicroMap. As noted in my forthcoming book, GDELT is the ultimate source of data for the world’s digitized news media. The 3Ws refers to Who, What, Where; an important spreadsheet that OCHA puts together and maintains in the aftermath of major disasters to support coordination efforts.

In response to Typhoon Ruby in the Philippines, Andrej Verity (OCHA) and I collaborated with Kalev Leetaru from GDELT to explore how the MicroMappers “3W Clicker” might work. The result is the Google Spreadsheet below (click to enlarge) that is automatically updated every 15 minutes with the latest news reports that refer to one or more humanitarian organizations in the Philippines. GDELT includes the original URL of the news article as well as the list of humanitarian organizations referenced in the article. In addition, GDELT automatically identifies the locations referred to in the articles, key words (tags) and the date of the news article. The spreadsheet below is already live and working. So all we need now is the “3W Clicker” to crowdsource the “What”.

MM GDELT output

The first version of the mock-up we’ve created for the “3W Clicker” is displayed below. Digital volunteers are presented with an interface that includes an news article with the names of humanitarian organizations highlighted in red for easy reference. GDELT auto-populates the URL, the organization name (or names if there are more than one) and the location. Note that both the “Who” & “Where” information can be edited directly by the volunteer incase GDELT’s automated algorithm gets those wrong. The main role of digital volunteers, however, would simply be to identify the “What” by quickly skimming the article.

MM 3W Clicker v2

The output of the “3W Clicker” would simply be another MicroMap layer. As per Andrej’s suggestion, the resulting data could also be automatically pushed to another Google Spreadsheet in HXL format. We’re excited about the possibilities and plan to move forward on this sooner rather than later. In addition to GDELT, pulling in feeds from CrisisNET may be worth exploring. I’m also really keen on exploring ways to link up with the Global Disaster Alert & Coordination System (GDACS) as well as GeoFeedia.

In the meantime, we’re hoping to pilot our “Satellite Clicker” thanks to recent conversations with Planet Labs and SkyBox Imaging. Overlaying user-generated content such as tweets and images on top of both satellite and aerial imagery can go a long way to helping verify (“ground truth”) social media during disasters and other events. This is evidenced by recent empirical studies such as this one in Germany and this one in the US. On this note, as my QCRI colleague Heather Leson recently pointed out, the above vision for MicroMappers is still missing one important data feed; namely sensors—the Internet of Things. She is absolutely spot on, so we’ll be sure to look for potential pilot projects that would allow us to explore this new data source within MicroMappers.

The above vision is a tad ambitious (understatement). We really can’t do this alone. To this end, please do get in touch if you’re interested in joining the team and getting MicroMappers to the next level. Note that MicroMappers is free and open source and in no way limited to disaster response applications. Indeed, we recently used the Aerial Clicker for this wildlife protection project in Namibia. This explains why our friends over at National Geographic have also expressed an interest in potentially piloting the MicroMappers platform for some of their projects. And of course, one need not use all the Clickers for a project, simply the one(s) that make sense. Another advantage of MicroMappers is that the Clickers (and maps) can be deployed very rapidly (since the platform was initially developed for rapid disaster response purposes). In any event, if you’d like to pilot the platform, then do get in touch.

bio

See also: Digital Humanitarians – The Book

Digital Jedis Complete Response to Typhoon Ruby

Thank you, Digital Jedis!

Every Click you made on MicroMappers was a gift. Typhoon Ruby (Hagupit) disrupted the lives of many and caused damage in regions already affected by previous disasters. As MicroMappers, you gave your time, clicks and skills to make a difference. Catherine, the Head of the UN’s Information Management Unit in the Philippines had this to say: “I would like to thank all the volunteers […] for their invaluable contribution over the past few days. We are lucky that Hagupit [Ruby] made less damages than expected and that the emergency quickly scaled down.”

MM Ruby Tweet Map

MicroMappers and our partners at the Standby Task Force (SBTF) were activated by the United Nations Office for the Coordination of Humanitarian Affairs (OCHA). The Mission?

To augment the situational awareness of humanitarian actors on the ground by making sense of social media generated following the Typhoon.

Over the course of 72 hours, these Digital Jedis united to MicroMap one Click at a time. By reviewing tweets and image, each MicroMapper built collective intelligence and insights that were used to build a comprehensive situational awareness reports and maps for the UN. Many hands, and in this case, Clicks, make light work.

As Catherine rightly notes, there was thankfully less damage than many feared. This explains why our MicroMaps (above and below) are thankfully not riddled with hundreds of markers. In addition, we prioritize quality over quantity at MicroMappers. Our UN partners had specifically asked for tweets related to:

(1) Requests for Help / Needs
(2) Infrastructure Damage
(3) Humanitarian Aid Provided

Together, these tweets—which are mapped above—represented less than 5% of the Ruby-related tweets that were collected during the first 72 hours of the Typhoon making landfall. This doesn’t mean that only 5% of the information on Twitter was relevant for emergency response, however. Indeed, we also tagged tweets that were not related to the above 3 categories but that were still informative. These constituted more than 20% of all tweets collected (which are not included in the map above). In the analysis provided to UN partners, we did include a review of those other relevant tweets.

MM Ruby Tweet Clicker

Some 700 Digital Jedis joined the response online, a new record for MicroMappers! An astounding 50,394 Clicks were made using the Text Clicker pictured above (each tweet was reviewed by at least 3 digital volunteers for quality assurance purposes). And a further 3,555 Clicks were carefully made by the SBTF to geo-locate (map) relevant tweets. In other words, close to 55,000 Clicks went into making the high quality map displayed above! That’s over 12 Clicks per minute non-stop for more than 4,300 consecutive minutes!

MM Ruby Image Map

The United Nations also asked Digital Jedis to identify pictures posted on Twitter that showed disaster damage. Over 30,000 Clicks went into this operation with a further 7,413 Clicks made by the SBTF to map images that showed severe and mild damage. In sum, over 40,000 Clicks went into the MicroMap above. Overall, the entire MicroMappers response was powered by close to 100,000 Clicks!

Screen Shot 2014-12-10 at 8.36.04 AMMM Infographic 2MM Infographic 3

Digital Jedis have yet again shown that together, we can help people get positively involved in their world, even when half-a-globe and many timezones away. Yes, we can and should donate $$ to support relief efforts and good causes around the world but we can also get directly involved by donating our time, or what we call M&M’s, Minutes and Mouse clicks. This year MicroMappers have mobilized to support wildlife protection in Namibia, food security efforts in the Philippines and of course this most recent response to Typhoon Ruby. On that note, thanks again to all volunteers who supported the MicroMappers response to the Typhoon in partnership with the United Nations. You truly are Digital Jedis! And the UK Guardian certainly agrees, check out their article on our digital response.

So what’s next? We will continue to solicit your feedback on how to improve the Clickers and will get started right away. (Add your MicroMappers feedback here). In the meantime, we will leave the Clickers online for newcomers who wish to practice. We are also in touch with the UN and UAV partners in the Philippines as they may soon fly their small, remote-control planes to take aerial photographs over disaster affected areas. If they do, they will send us the photographs for analysis via MicroMappers, so stay tuned.

In closing, MicroMappers was developed by QCRI in partnership SBTF/OCHA. So a million thanks to the QCRI team and SBTF for deploying MicroMappers in support of these digital humanitarian efforts. Special thanks go to Ji Lucas, Jus Mackinnon, ChaTo Castillo, Muhammad Imran, Heather Leson, Sarah Vieweg and last but certainly not least Peter Mosur.

(Ed. note: Blog post was cross-posted from MicroMappers.org. Infrographic uses Infogr.am software)

Calling All Digital Jedis: Support UN Response to Super Typhoon Ruby!

The United Nations has officially activated the Digital Humanitarian Network (DHN) in response to Typhoon Ruby. The DHN serves as the official interface between formal humanitarian organizations and digital volunteer groups from all around the world. These digital volunteers—also known as Digital Jedis— provide humanitarian organizations like the UN and the Red Cross with the “surge” capacity they need to make sense of the “Big Data” that gets generated during disasters. This “Big Data” includes large volumes of social media reports and satellite imagery, for example. And there is a lot of this data being generated right now as a result of Super Typhoon Ruby.

Typhoon Ruby

To make sense of this flash flood of information, Digital Jedis use crowdsourcing platforms like MicroMappers, which was developed in partnership with the UN Office for the Coordination of Humanitarian Affairs (OCHA). In their activation of the Digital Humanitarian Network, the UN has requested that Digital Jedis look for Ruby-related tweets that refer to needs, damage & response efforts. They have also asked digital volunteers to identify pictures of damage caused by the Typhoon. These tweets and pictures will then to be added to a live crisis map to augment the UN’s own disaster damage and needs assessment efforts.

You too can be a Digital Jedi. Trust me, MicroMappers is far easier to use than a lightsaber. All it takes is a single Click of the mouse. Yes, it really is that simple. So, if a Digital Jedi you want to be, let your first Click be this one! Following that click will set you on the path to help the United Nation’s important relief efforts in the Philippines. So if you’ve got a bit of time on your hands—even 2 minutes goes a long way—then help us make a meaningful difference in the world, join the Force! And may the Crowd be with Us!

bio

See also: Digital Humanitarians – The Path of the Digtal Jedis

Piloting MicroMappers: Crowdsourcing the Analysis of UAV Imagery for Disaster Response

New update here!

UAVs are increasingly used in humanitarian response. We have thus added a new Clicker to our MicroMappers collection. The purpose of the “Aerial Clicker” is to crowdsource the tagging of aerial imagery captured by UAVs in humanitarian settings. Trying out new technologies during major disasters can pose several challenges, however. So we’re teaming up with Drone Adventures, Kuzikus Wildlife Reserve, Polytechnic of Namibia, and l’École Polytechnique Fédérale de Lausanne (EPFL) to try out our new Clicker using high-resolution aerial photographs of wild animals in Namibia.

Kuzikus1
As part of their wildlife protection efforts, rangers at Kuzikus want to know how many animals (and what kinds) are roaming about their wildlife reserve. So Kuzikus partnered with Drone Adventures and EPFL’s Cooperation and Development Center (CODEV) and the Laboratory of Geographic Information Systems (LASIG) to launch the SAVMAP project, which stands for “Near real-time ultrahigh-resolution imaging from unmanned aerial vehicles for sustainable land management and biodiversity conservation in semi-arid savanna under regional and global change.” SAVMAP was co-funded by CODEV through LASIG. You can learn more about their UAV flights here.

Our partners are interested in experimenting with crowdsourcing to make sense of this aerial imagery and raise awareness about wildlife in Namibia. As colleagues at Kuzikus recently told us, “Rhino poaching continues to be a growing problem that threatens to extinguish some rhino species within a decade or two. Rhino monitoring is thus important for their protection. One problematic is to detect rhinos in large areas and/or dense bush areas. Using digital maps in combination with MicroMappers to trace aerial images of rhinos could greatly improve rhino monitoring efforts.” 

So our pilot project serves two goals: 1) Trying out the new Aerial Clicker for future humanitarian deployments; 2) Assessing whether crowdsourcing can be used to correctly identify wild animals.

MM Aerial Clicker

Can you spot the zebras in the aerial imagery above? If so, you’re already a digital ranger! No worries, you won’t need to know that those are actually zebras, you’ll simply outline any animals you find (using your mouse) and click on “Add my drawings.” Yes, it’s that easy : )

We’ll be running our Wildlife Challenge from September 26th-28th. To sign up for this digital expedition to Namibia, simply join the MicroMappers list-serve here. We’ll be sure to share the results of the Challenge with all volunteers who participate and with our partners in Namibia. We’ll also be creating a wildlife map based on the results so our friends know where the animals have been spotted (by you!).

MM_Rhino

Given that rhino poaching continues to be a growing problem in Namibia (and elsewhere), we will obviously not include the location of rhinos in our wildlife map. You’ll still be able to look for and trace rhinos (like those above) as well as other animals like ostriches, oryxes & giraffes, for example. Hint: shadows often reveal the presence of wild animals!

MM_Giraffe

Drone Adventures hopes to carry out a second mission in Namibia early next year. So if we’re successful in finding all the animals this time around, then we’ll have the opportunity to support the Kuzikus Reserve again in their future protection efforts. Either way, we’ll be better prepared for the next humanitarian disaster thanks to this pilot. MicroMappers is developed by QCRI and is a joint project with the United Nations Office for the Coordination of Humanitarian Affairs (OCHA).

Any questions or suggestions? Feel free to email me at patrick@iRevolution.net or add them in the comments section below. Thank you!

Disaster Tweets Coupled With UAV Imagery Give Responders Valuable Data on Infrastructure Damage

My colleague Leysia Palen recently co-authored an important study (PDF) on tweets posted during last year’s major floods in Colorado. As Leysia et al. write, “Because the flooding was widespread, it impacted many canyons and closed off access to communities for a long duration. The continued storms also prevented airborne reconnaissance. During this event, social media and other remote sources of information were sought to obtain reconnaissance information […].”

1coloflood

The study analyzed 212,672 unique tweets generated by 57,049 unique Twitter users. Of these tweets, 2,658 were geo-tagged. The researchers combed through these geo-tagged tweets for any information on infrastructure damage. A sample of these are included below (click to enlarge). Leysia et al. were particularly interested in geo-tagged tweets with pictures of infrastructure damage.

Screen Shot 2014-09-07 at 3.17.34 AM

They overlaid these geo-tagged pictures on satellite and UAV/aerial imagery of the disaster-affected areas. The latter was captured by Falcon UAV. The satellite and aerial imagery provided the researchers with an easy way to distinguish between vegetation and water. “Most tweets appeared to fall primarily within the high flood hazard zones. Most bridges and roads that were located in the flood plains were expected to experience a high risk of damage, and the tweets and remote data confirmed this pattern.” According to Shideh Dashti, an assistant professor of civil, environmental and architectural engineering, and one of the co-authors, “we compared those tweets to the damage reported by engineering reconnaissance teams and they were well correlated.”

falcon uav flooding

To this end, by making use of real-time reporting by those affected in a region, including their posting of visual data,” Leysia and team “show that tweets may be used to directly support engineering reconnaissance by helping to digitally survey a region and navigate optimal paths for direct observation.” In sum, the results of this study demonstrate “how tweets, particularly with postings of visual data and references to location, may be used to directly support geotechnical experts by helping to digitally survey the affected region and to navigate optimal paths through the physical space in preparation for direct observation.”

Since the vast majority of tweets are not geo-tagged, GPS coordinates for potentially important pictures in these tweets are not available. The authors thus recommend looking into using natural language processing (NLP) techniques to “expose hazard-specific and site-specific terms and phrases that the layperson uses to report damage in situ.” They also suggest that a “more elaborate campaign that instructs people how to report such damage via tweets […] may help get better reporting of damage across a region.”

These findings are an important contribution to the humanitarian computing space. For us at QCRI, this research suggests we may be on the right track with MicroMappers, a crowdsourcing (technically a microtasking) platform to filter and geo-tag social media content including pictures and videos. MicroMappers was piloted last year in response to Typhoon Haiyan. We’ve since been working on improving the platform and extending it to also analyze UAV/aerial imagery. We’ll be piloting this new feature in coming weeks. Ultimately, our aim is for MicroMappers to create near real-time Crisis Maps that provide an integrated display of relevant Tweets, pictures, videos and aerial imagery during disasters.

Bio

See also:

  • Using AIDR to Automatically Collect & Analyze Disaster Tweet [link]
  • Crisis Map of UAV Videos for Disaster Response [link]
  • Humanitarians in the Sky: Using UAVs for Disaster Response [link]
  • Digital Humanitarian Response: Why Moving from Crowdsourcing to Microtasking is Important [link]

Humanitarians in the Sky: Using UAVs for Disaster Response

The following is a presentation that I recently gave at the 2014 Remotely Piloted Aircraft Systems Conference (RPAS 2014) held in Brussels, Belgium. The case studies on the Philippines and Haiti are also featured in my upcoming book on “Digital Humanitarians: How Big Data is Changing the Face of Humanitarian Response.” The book is slated to be published in January/February 2015.

Screen Shot 2014-06-24 at 2.20.54 PM

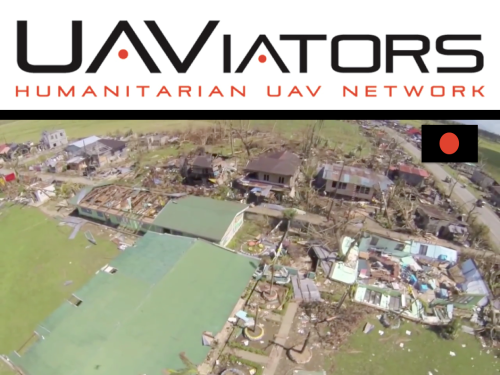
Good afternoon and many thanks to Peter van Blyenburgh for the kind invitation to speak on the role of UAVs in humanitarian contexts beyond the European region. I’m speaking today on behalf of the Humanitarian UAV Network, which brings together seasoned humanitarian professionals with UAV experts to facilitate the use of UAVs in humanitarian settings. I’ll be saying more about the Humanitarian UAV Network (UAViators, pronounced “way-viators”) at the end of my talk.

Screen Shot 2014-06-24 at 2.21.19 PM

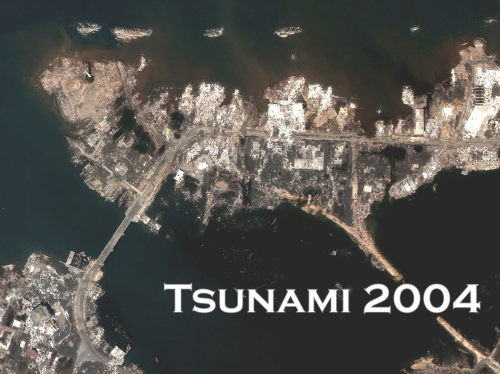
The view from above is key for humanitarian response. Indeed, satellite imagery has played an important role in relief operations since Hurricane Mitch in 1998. And the Indian Ocean Tsunami was the first to be captured from space as the way was still propagating. Some 650 images were produced using data from 15 different sensors. During the immediate aftermath of the Tsunami, satellite images were used at headquarters to assess the extent of the emergency. Later, satellite images were used in the field directly, distributed by the Humanitarian Information Center (HIC) and others to support and coordinate relief efforts. 

Screen Shot 2014-06-24 at 2.21.30 PM

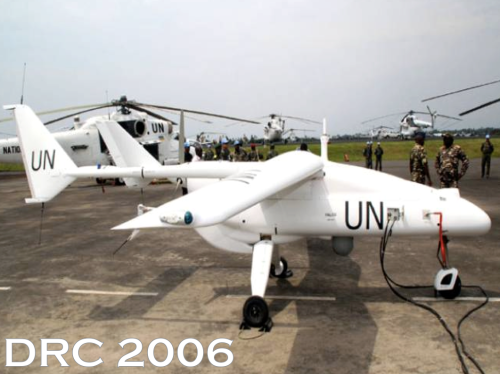
Satellites do present certain limitations, of course. These include cost, the time needed to acquire images, cloud cover, licensing issues and so on. In any event, two years after the Tsunami, an earlier iteration of the UN’s DRC Mission (MONUC) was supported by a European force (EUFOR), which used 4 Belgian UAVs. But I won’t be speaking about this type of UAV. For a variety of reasons, particularly affordability, ease of transport, regulatory concerns, and community engagement, UAVs used in humanitarian response are smaller systems or micro-UAVs that weigh just a few kilograms, such as one fixed-wing displayed below.

Screen Shot 2014-06-24 at 2.21.47 PM

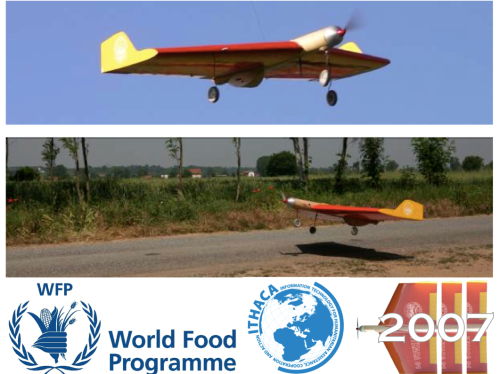
The World Food Program’s UAVs were designed and built at the University of Torino “way back” in 2007. But they’ve been grounded until this year due to lack of legislation in Italy.

Screen Shot 2014-06-24 at 2.22.05 PM

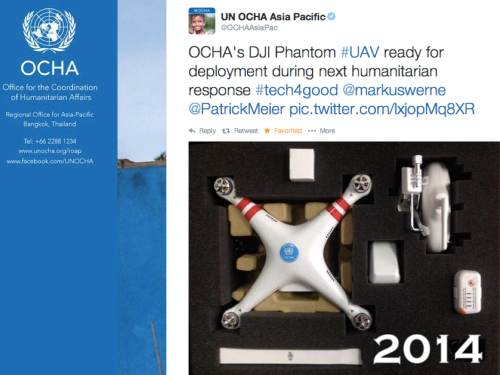
In June 2014, the UN’s Office for the Coordination of Humanitarian Affairs (OCHA) purchased a small quadcopter for use in humanitarian response and advocacy. Incidentally, OCHA is on the Advisory Board of the Humanitarian UAV Network, or UAViators. 

Screen Shot 2014-06-24 at 2.22.41 PM

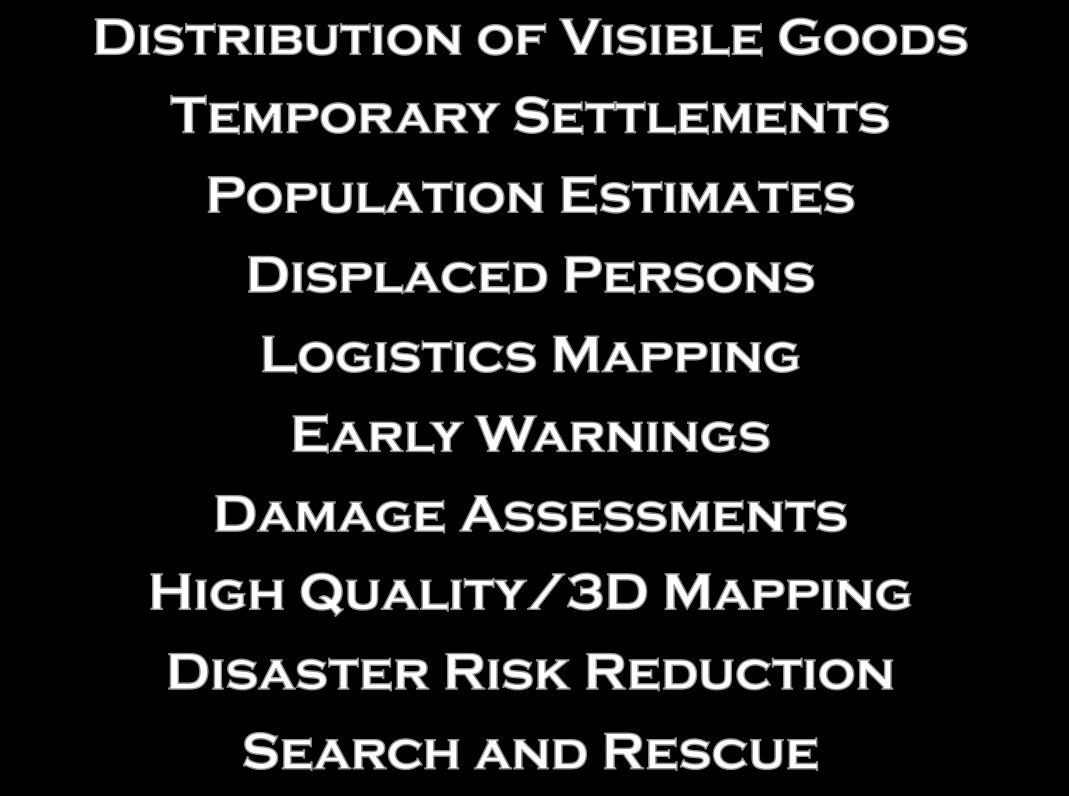
Now, there are many uses cases for the operation of UAVs in humanitarian settings (those listed above are only a subset). All of you here at RPAS 2014 are already very familiar with these applications. So let me jump directly to real world case studies from the Philippines and Haiti.

Screen Shot 2014-06-24 at 2.23.08 PM

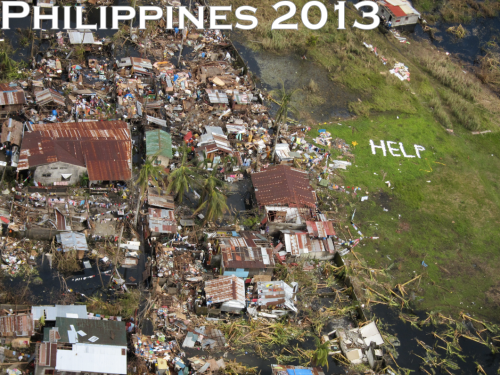
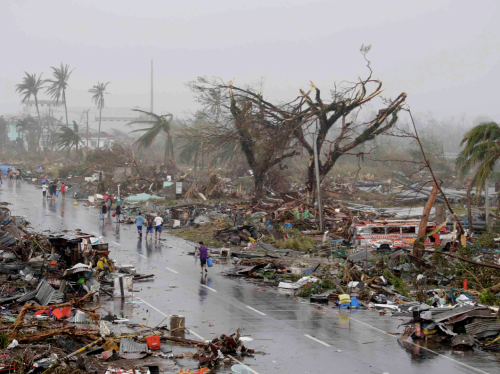
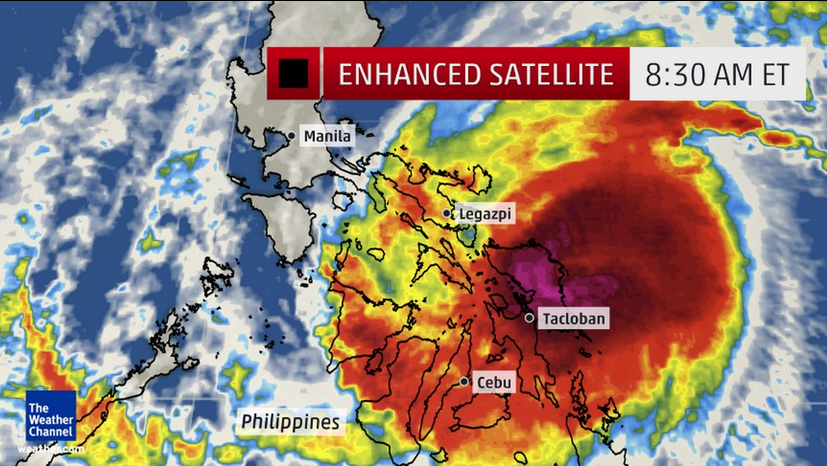
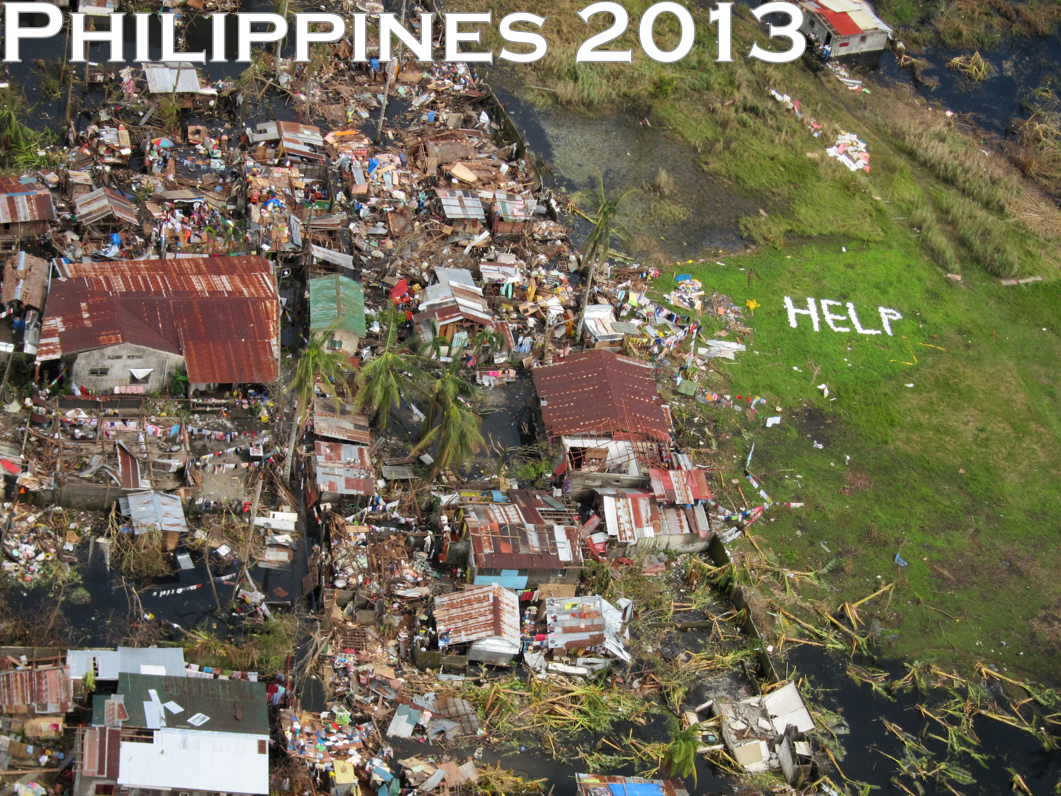
Typhoon Haiyan, or Yolanda as it was known locally, was the most powerful Typhoon in recorded human history to make landfall. The impact was absolutely devastated. I joined UN/OCHA in the Philippines following the Typhoon and was struck by how many UAV projects were being launched. What follows is just a few of said projects.

Screen Shot 2014-06-24 at 2.26.45 PM

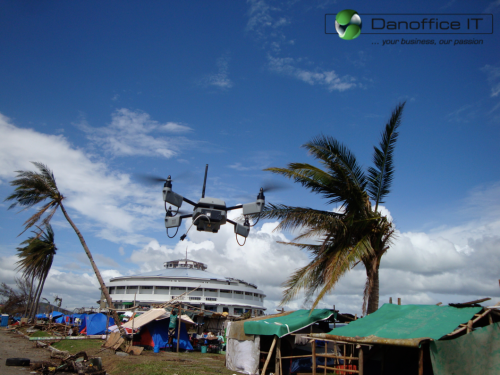
Danoffice IT, a company based in Lausanne, Switzerland, used the Sky-Watch Huginn X1 Quadcopter to support the humanitarian response in Tacloban. The rotary-wing UAV was used to identify where NGOs could set up camp. Later on, the UAV was used to support a range of additional tasks such as identifying which roads were passable for transportation/logistics. The quadcopter was also flown up the coast to assess the damage from the storm surge and flooding and to determine which villages had been most affected. This served to speed up the relief efforts and made the response more targeted vis-a-vis the provision of resources and assistance. Danoffice IT is also on the Board of the Humanitarian UAV Network (UAViators).

Screen Shot 2014-06-24 at 2.27.06 PM

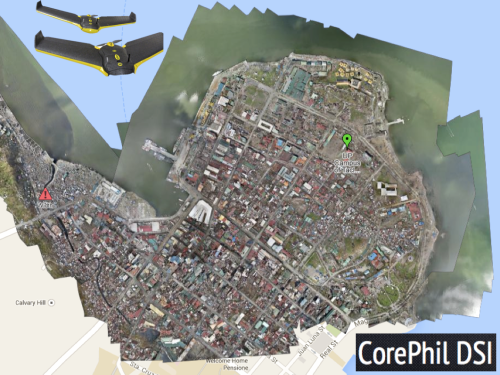
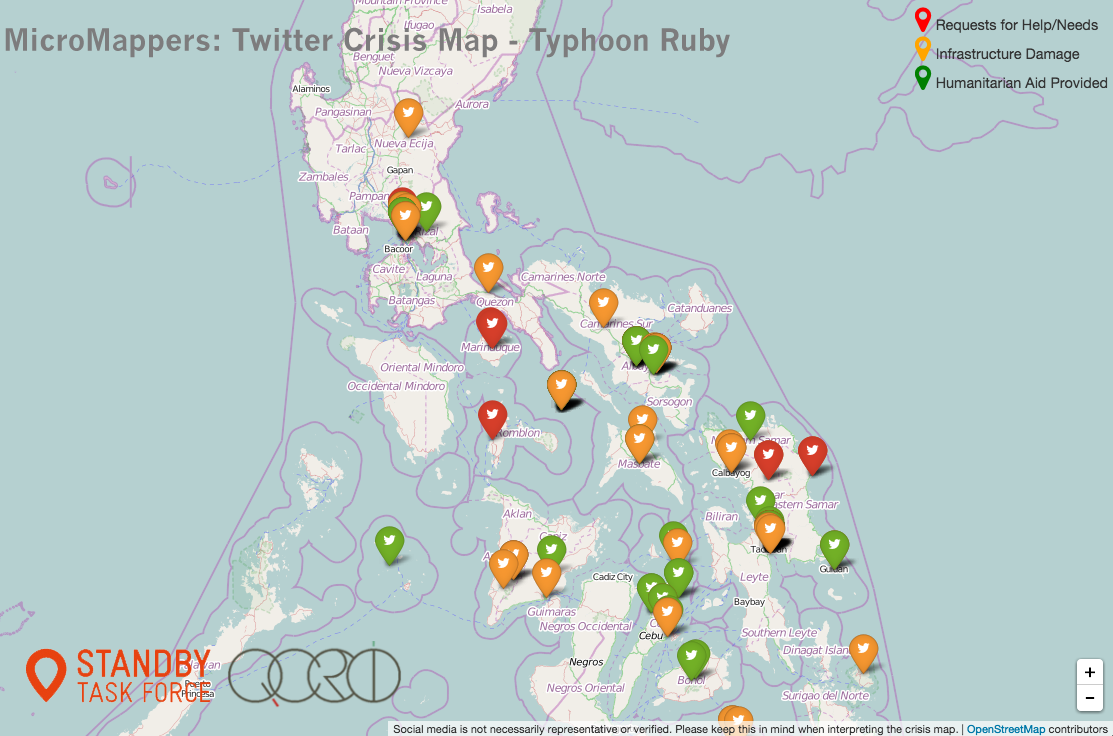
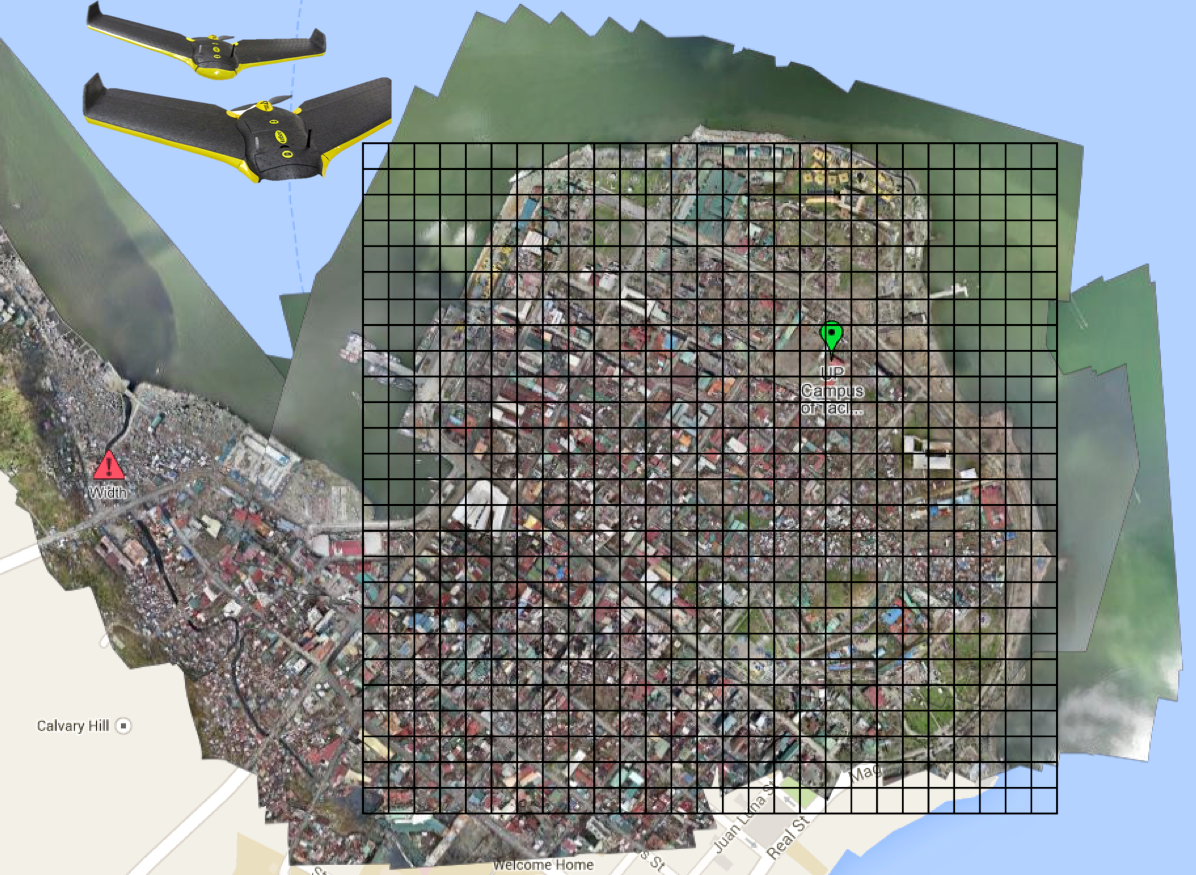
A second UAV project was carried out by local UAV start-up called CorePhil DSI. The team used an eBee to capture aerial imagery of downtown Tacloban, one of the areas hardest-hit by Typhoon Yolanda. They captured 22 Gigabytes of imagery and shared this with the Humanitarian OpenStreetMap Team (HOT) who are also on the Board of UAViators. HOT subsequently crowdsourced the tracing of this imagery (and satellite imagery) to create the most detailed and up-to-date maps of the area. These maps were shared with and used by multiple humanitarian organizations as well as the Filipino Government.

Screen Shot 2014-06-24 at 2.27.28 PM

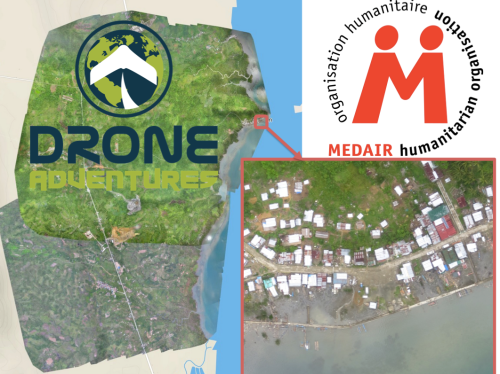
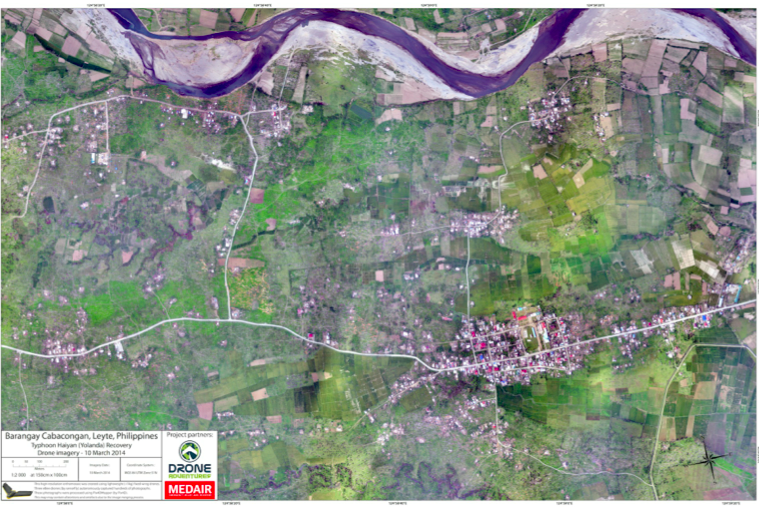
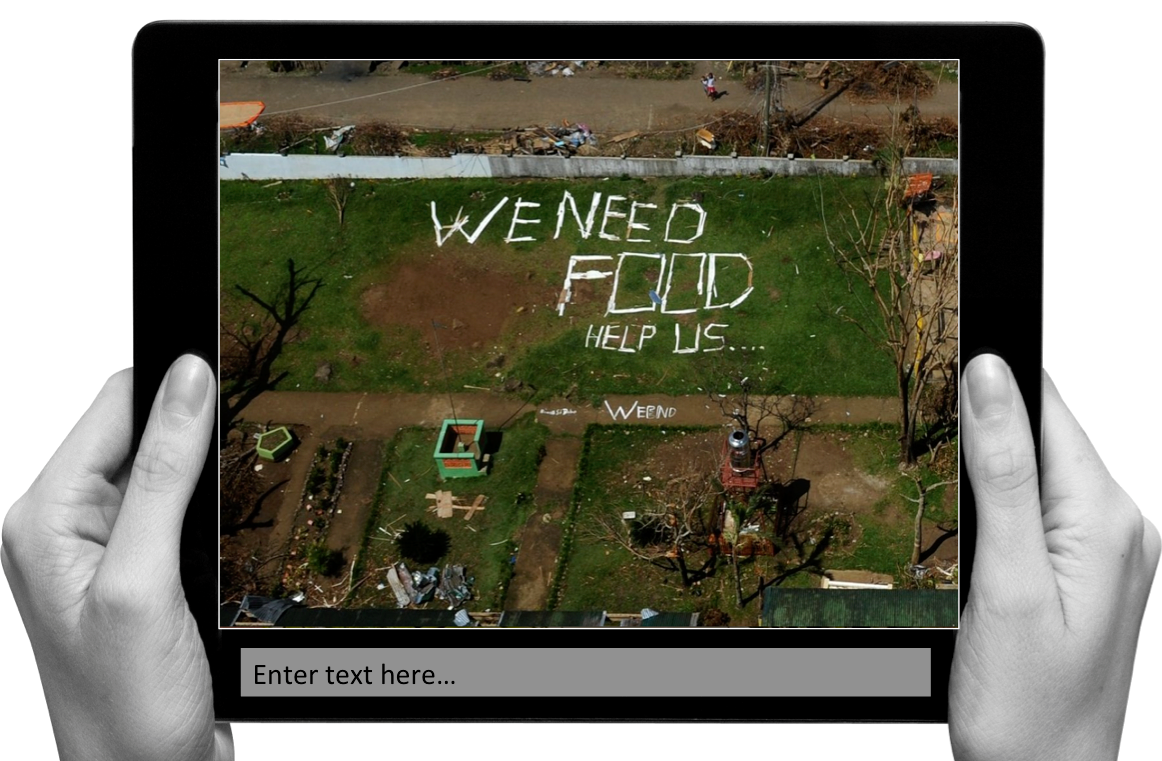
In a third project, the Swiss humanitarian organization Medair partnered with Drone Adventures to create a detailed set of 2D maps and 3D terrain models of the disaster-affected areas in which Medair works. These images were used to inform the humanitarian organization’s recovery and reconstruction programs. To be sure, Medair used the maps and models of Tacloban and Leyte to assist in assessing where the greatest need was and what level of assistance should be given to affected families as they continued to recover. Having these accurate aerial images of the affected areas allowed the Swiss organization to address the needs of individual households and—equally importantly—to advocate on their behalf when necessary.

Screen Shot 2014-06-24 at 3.20.08 PM

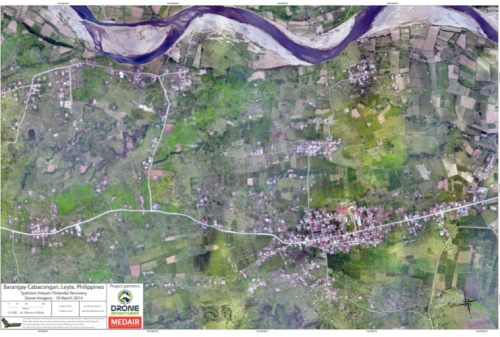
Drone Adventures also flew their fixed-wing UAVs (eBee’s) over Dulag, just north of Leyte, where more than 80% of homes and croplands were destroyed during the Typhoon. Medair is providing both materials and expertise to help build new shelters in Dulag. So the aerial imagery is proving invaluable to identify just how much material is needed and where. The captured imagery is also enabling community members themselves to better understand both where the greatest needs are an also what the potential solutions might be.

Screen Shot 2014-06-24 at 2.27.55 PM

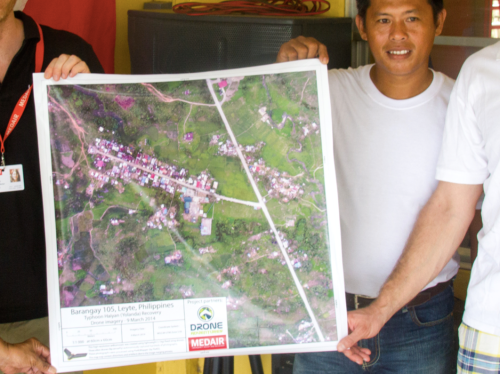
The partners are also committed to Open Data. The imagery captured was made available online and for free, enabling community leaders and humanitarian organizations to use the information to coordinate other reconstruction efforts. In addition, Drone Adventures and Medair presented locally-printed maps to community leaders within 24 hours of flying the UAVs. Some of these maps were printed on rollable, water proof banners, which make them more durable when used in the field.

Screen Shot 2014-06-24 at 2.28.11 PM

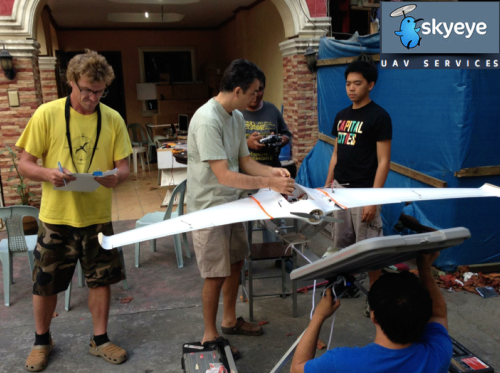
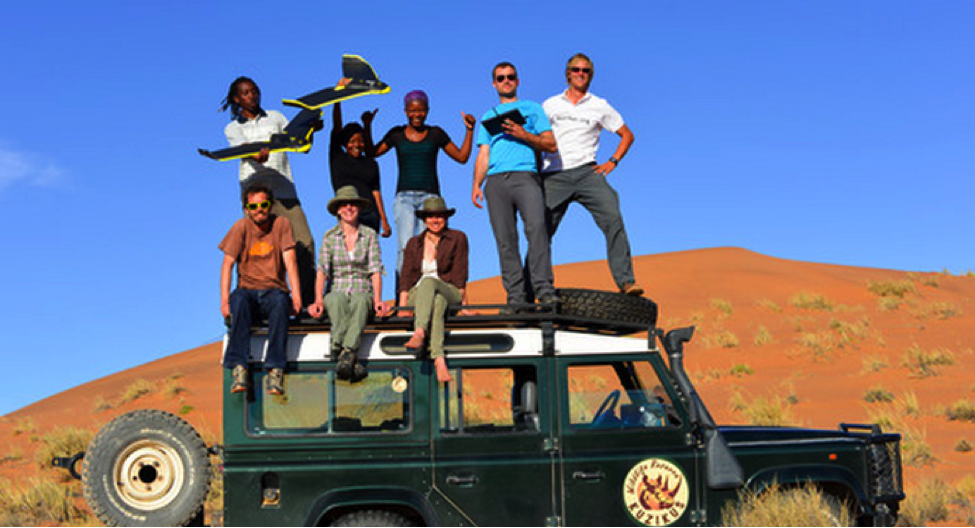
In yet another UAV project, the local Filipino start-up SkyEye Inc partnered with the University of the Philippines in Manila to develop expendable UAVs or xUAVs. The purpose of this initiative is to empower grassroots communities to deploy their own low-cost xUAVs and thus support locally-deployed response efforts. The team has trained 4 out of 5 teams across the Philippines to locally deploy UAVs in preparation for the next Typhoon season. In so doing, they are also transferring math, science and engineering skills to local communities. It is worth noting that community perceptions of UAVs in the Philippines and elsewhere has always been very positive. Indeed, local communities perceive small UAVs as toys more than anything else.

Screen Shot 2014-06-24 at 2.28.37 PM

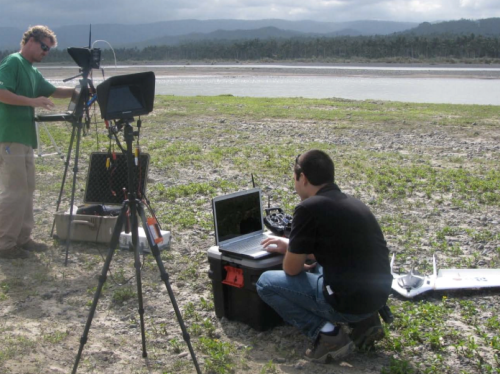
SkyEye worked with this group from the University of Hawaii to create disaster risk reduction models of flood-prone areas.

Screen Shot 2014-06-24 at 2.29.22 PM

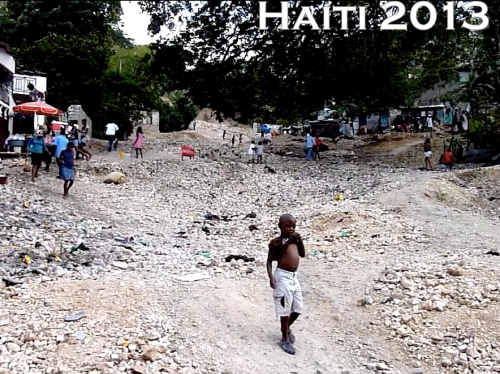
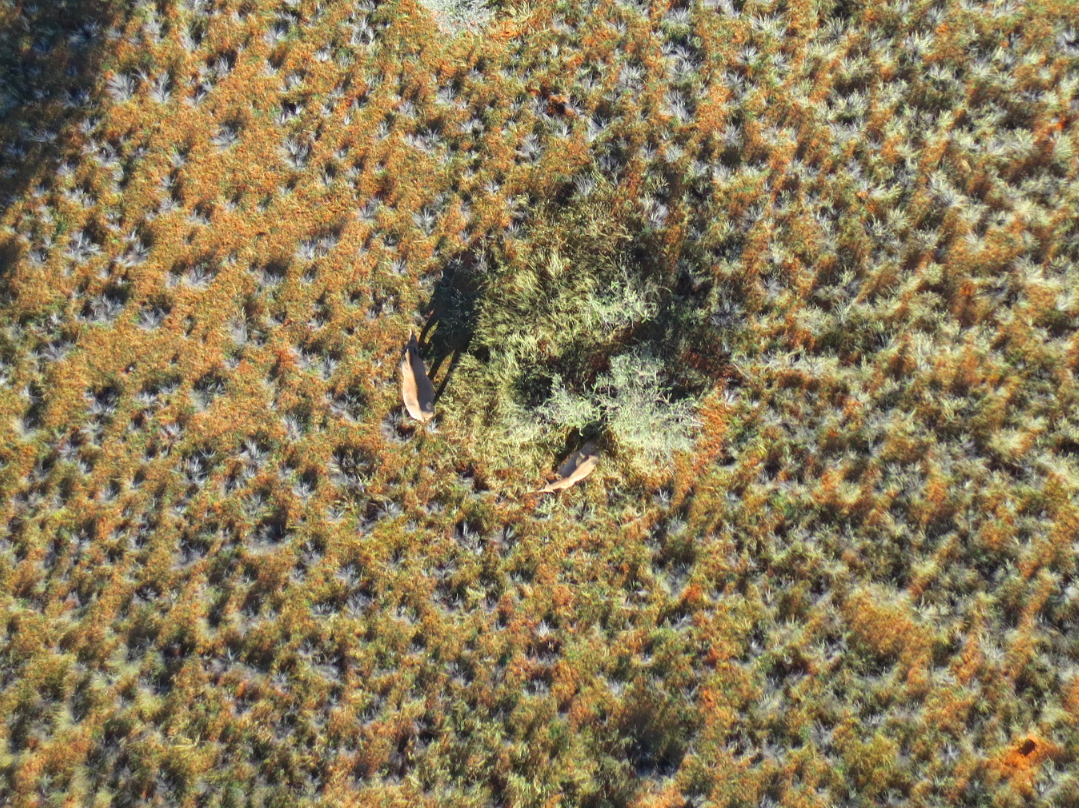
Moving to Haiti, the International Organization for Migration (IOM) has partnered with Drone Adventures and other to produce accurate topographical and 3D maps of disaster prone areas in the Philippines. These aerial images have been used to inform disaster risk reduction and community resilience programs. The UAVs have also enabled IOM to assess destroyed houses and other types of damage caused by floods and droughts. In addition, UAVs have been used to monitor IDP camps, helping aid workers identify when shelters are empty and thus ready to be closed. Furthermore, the high resolution aerial imagery has been used to support a census survey of public building, shelters, hospitals as well as schools.

Screen Shot 2014-06-24 at 2.29.46 PM

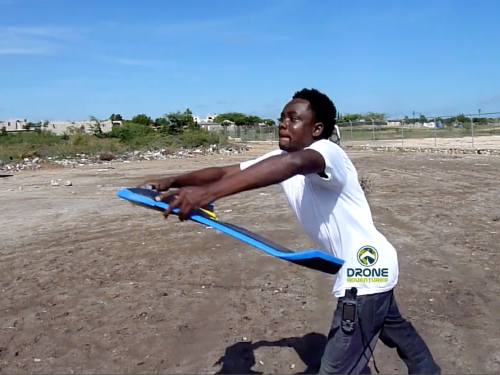
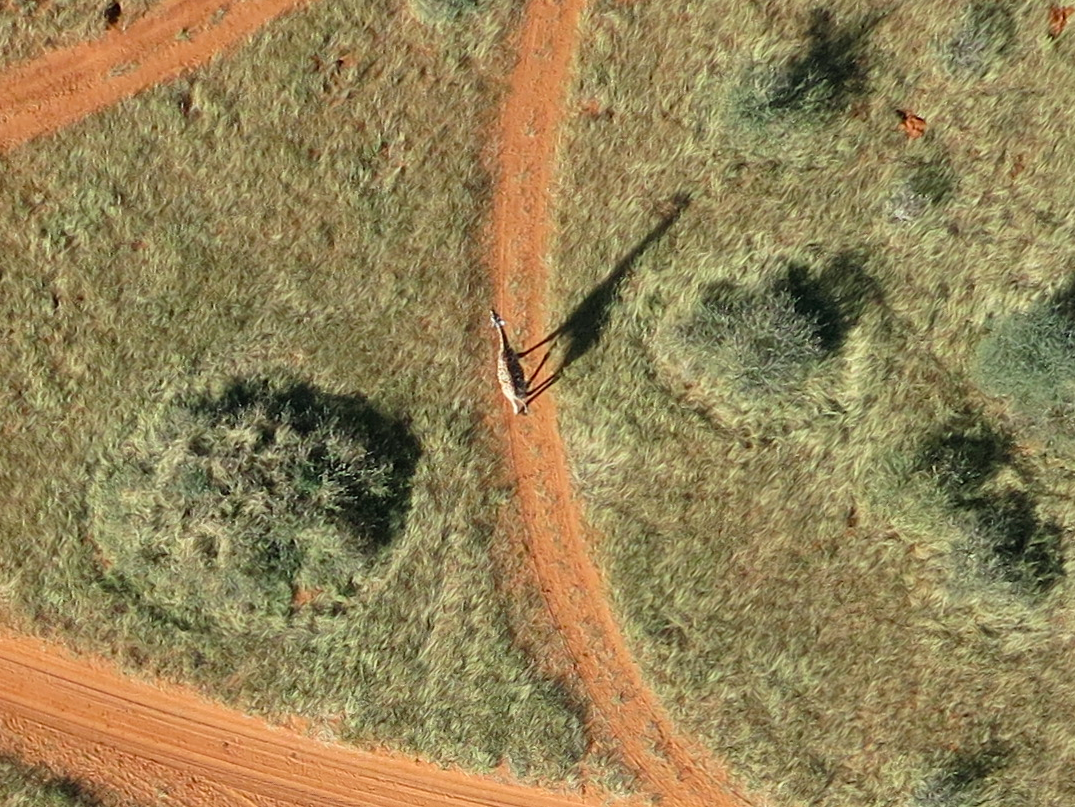
After Hurricane Sandy, for example, aerial imagery enabled IOM to very rapidly assess how many houses had collapsed near Rivière Grise and how many people were affected by the flooding. The aerial imagery was also used to identify areas of standing water where mosquitos and epidemics could easily thrive. Throughout their work with UAVs, IOM has stressed that regular community engagement has been critical for the successful use of UAVs. Indeed, informing local communities of the aerial mapping projects and explaining how the collected information is to be used is imperative. Local capacity building is also paramount, which is why Drone Adventures has trained a local team of Haitians to locally deploy and maintain their own eBee UAV.

Screen Shot 2014-06-24 at 2.30.27 PM

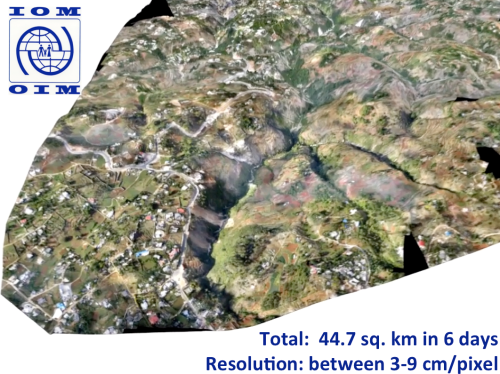
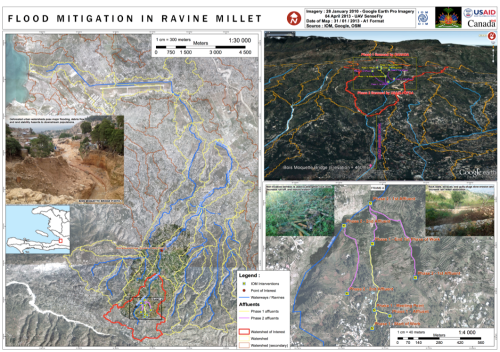
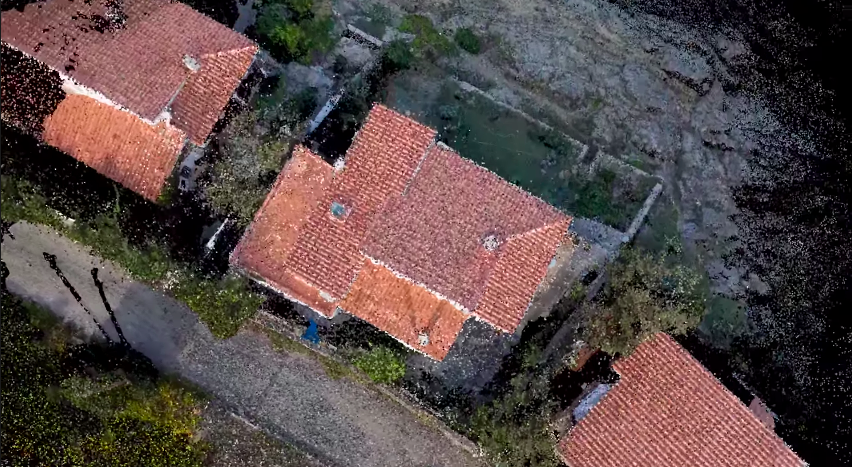
The pictures above and below are some of the information products produced by IOM and Drone Adventures. The 3D model above was used to model flood risk in the area and to inform subsequent disaster risk reduction projects.

Screen Shot 2014-06-24 at 2.30.47 PM

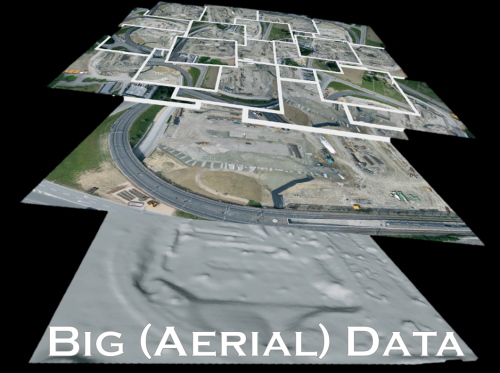
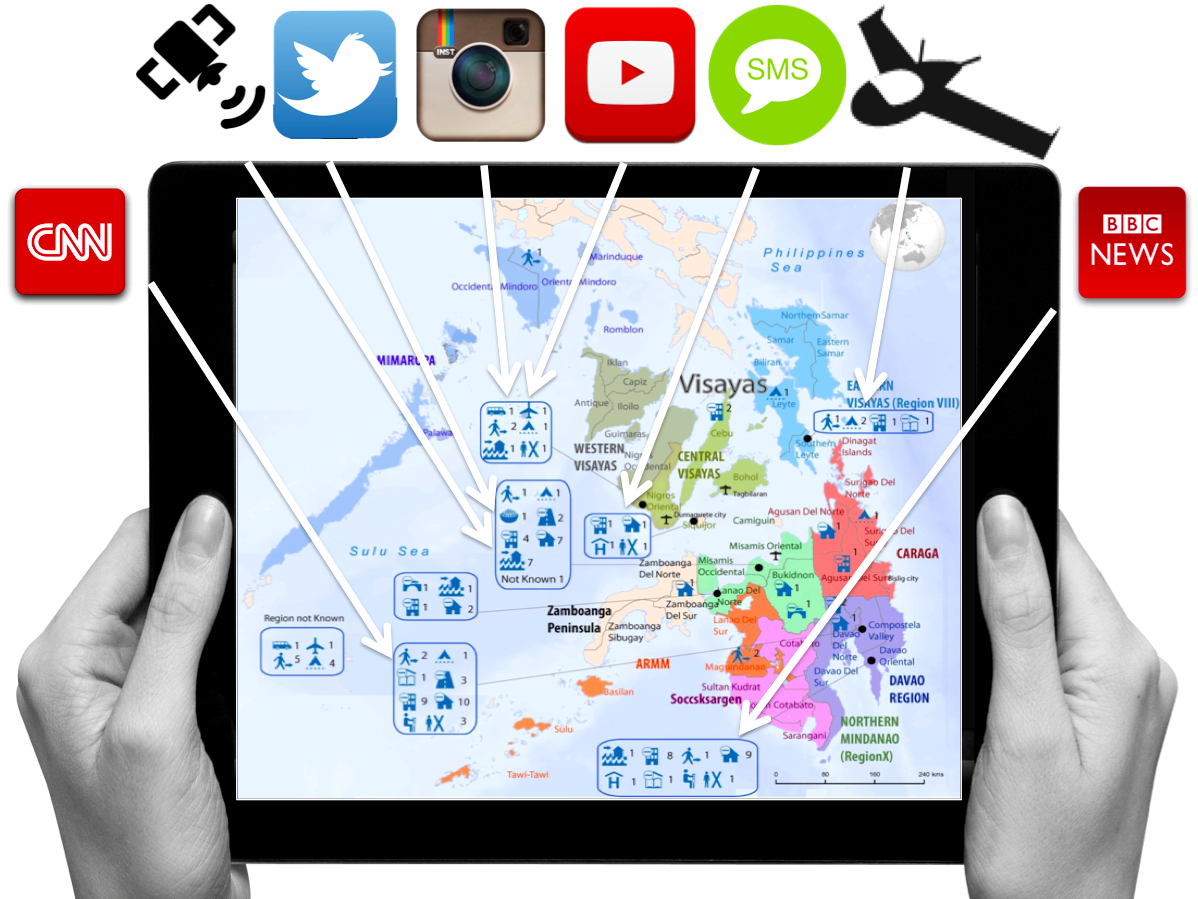
Several colleagues of mine have already noted that aerial imagery presents a Big Data challenge. This means that humanitarian organizations and others will need to use advanced computing (human computing and machine computing) to make sense of Big (Aerial) Data.

Screen Shot 2014-06-24 at 2.31.54 PM

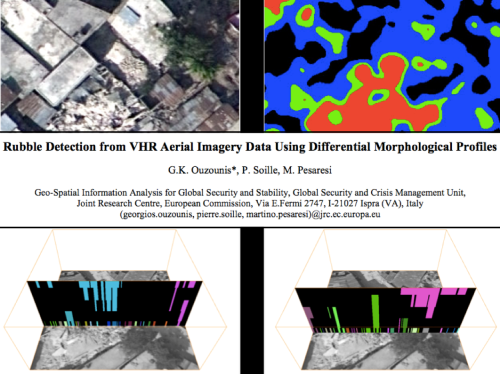
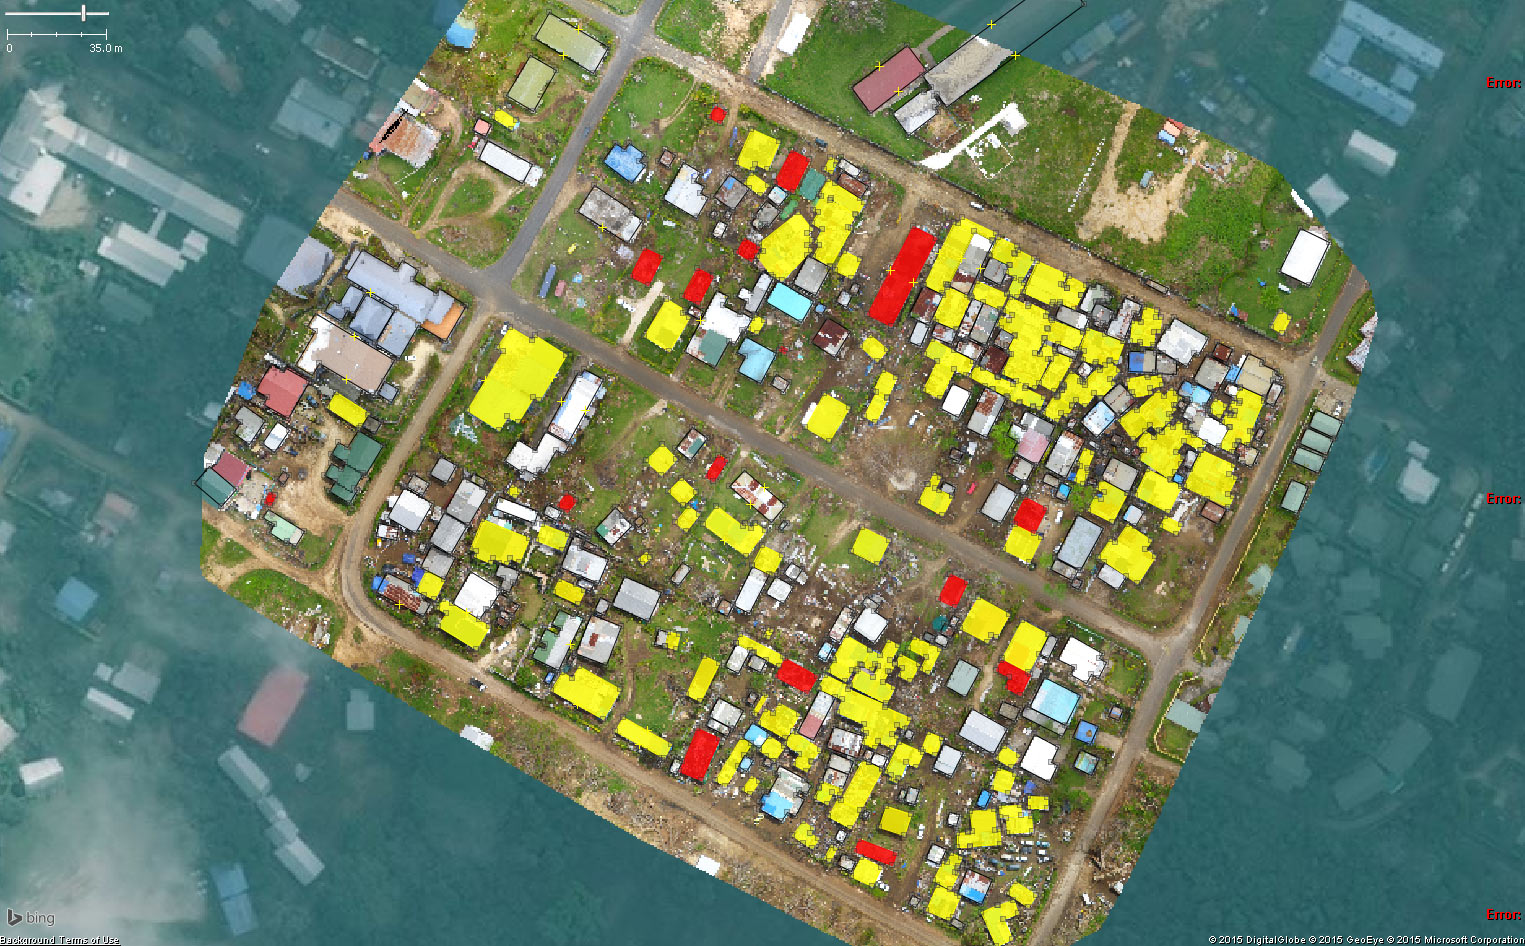
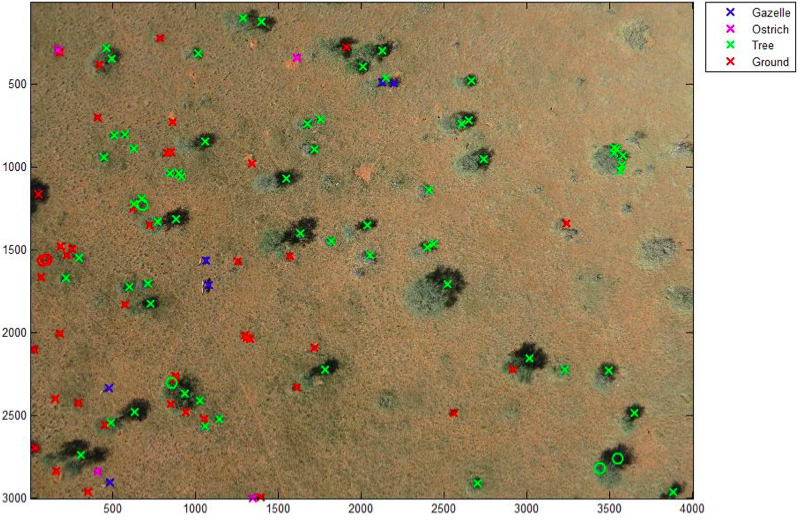
My colleagues at the European Commission’s Joint Research Center (JRC) are already beginning to apply advanced computing to automatically analyze aerial imagery. In the example from Haiti below, the JRC deployed a machine learning classifier to automatically identify rubble left over from the massive earthquake that struck Port-au-Prince in 2010. Their classifier had an impressive accuracy of 92%, “suggesting that the method in its simplest form is sufficiently reliable for rapid damage assessment.”

Screen Shot 2014-06-24 at 2.32.06 PM

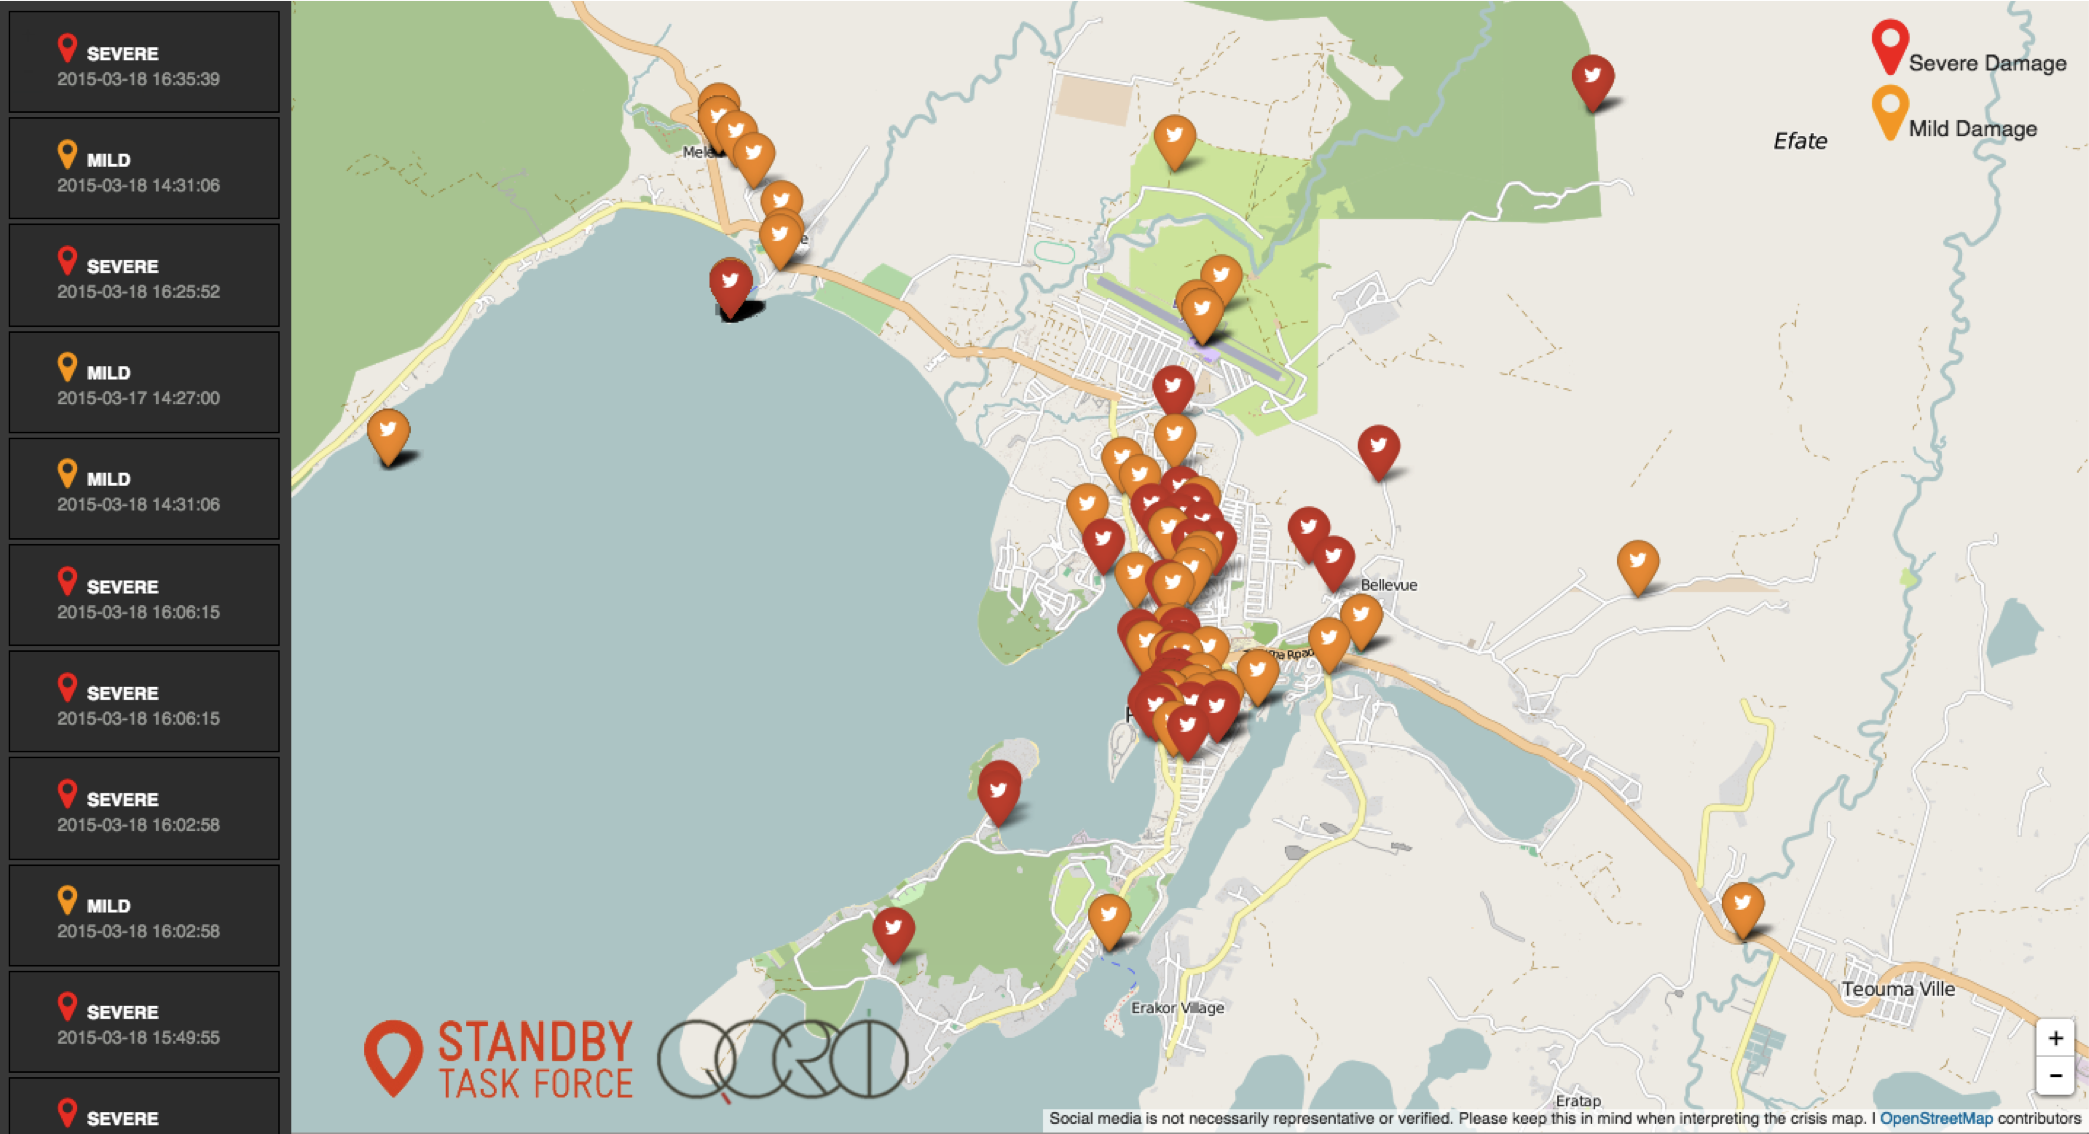
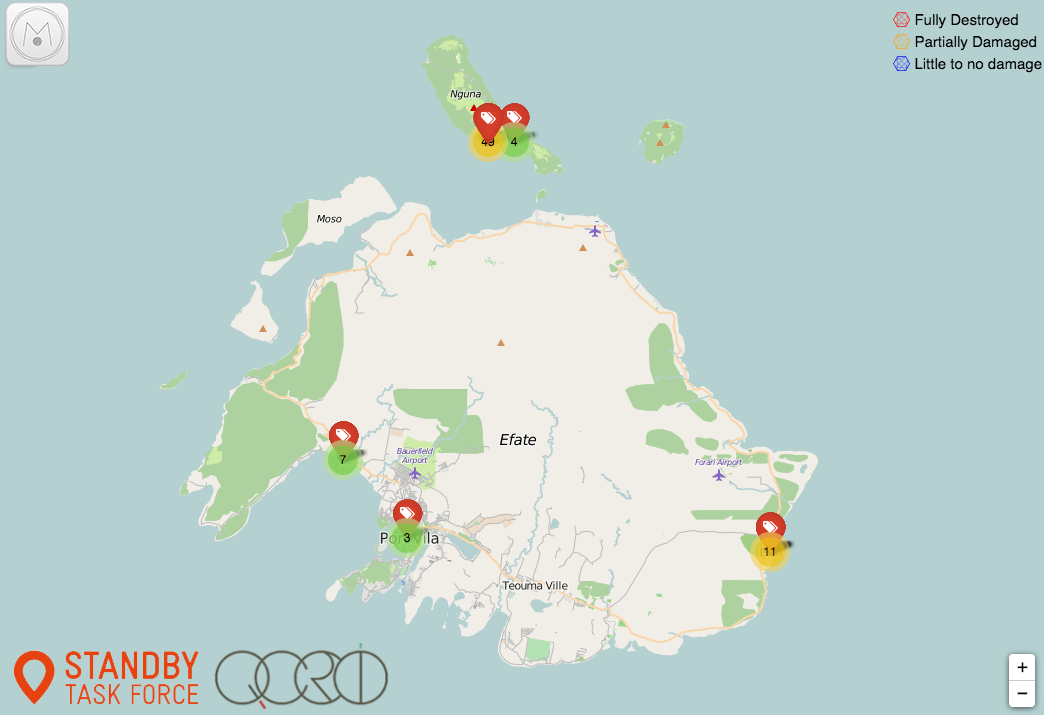
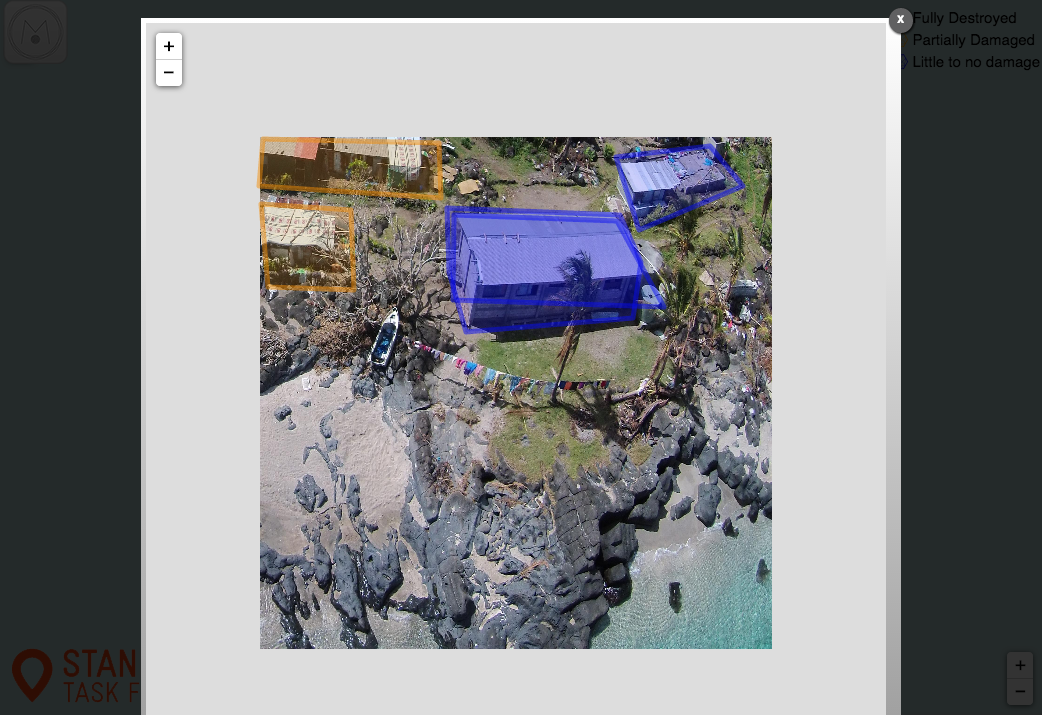
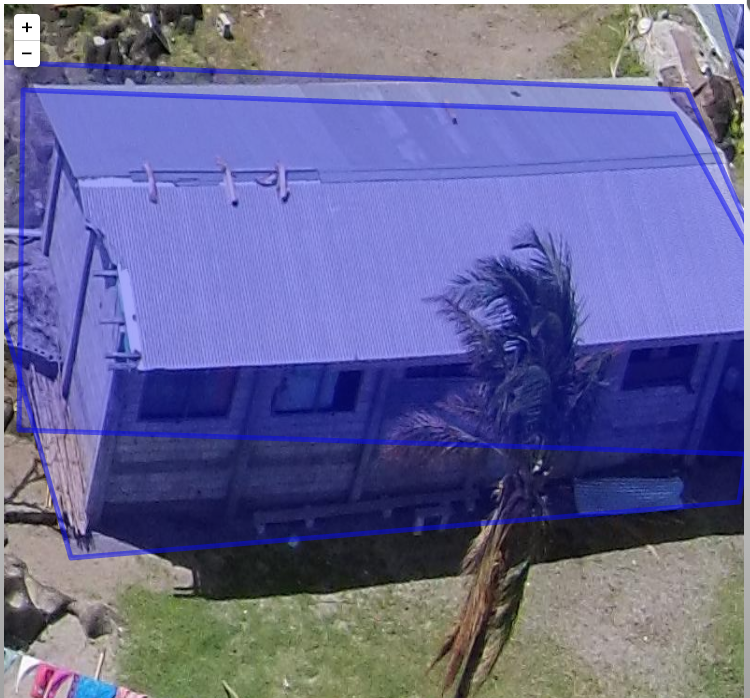
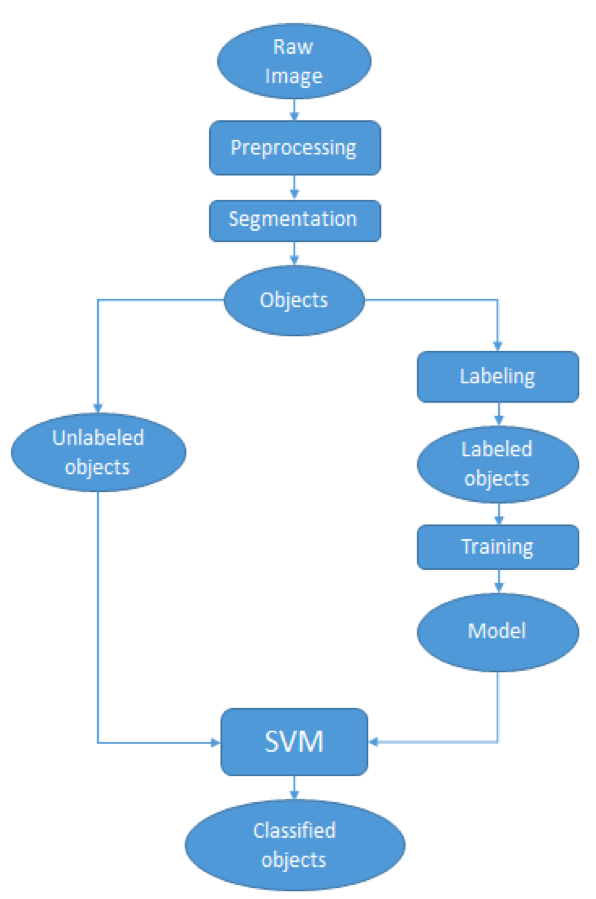
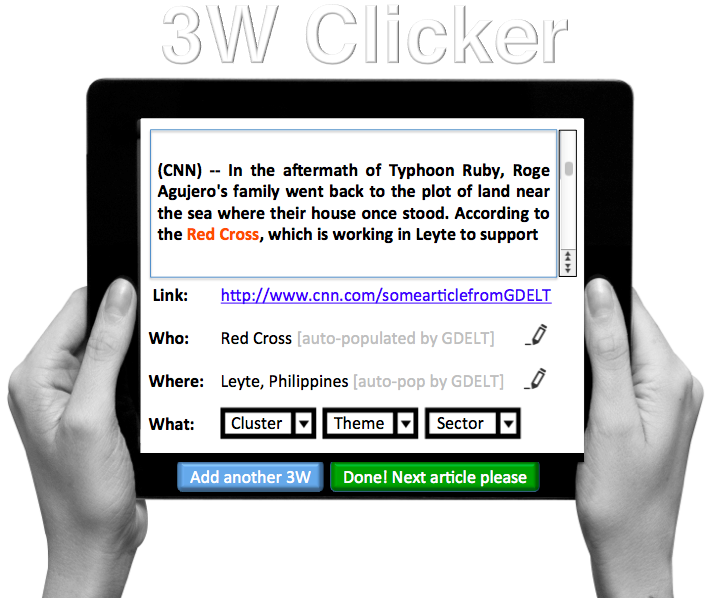
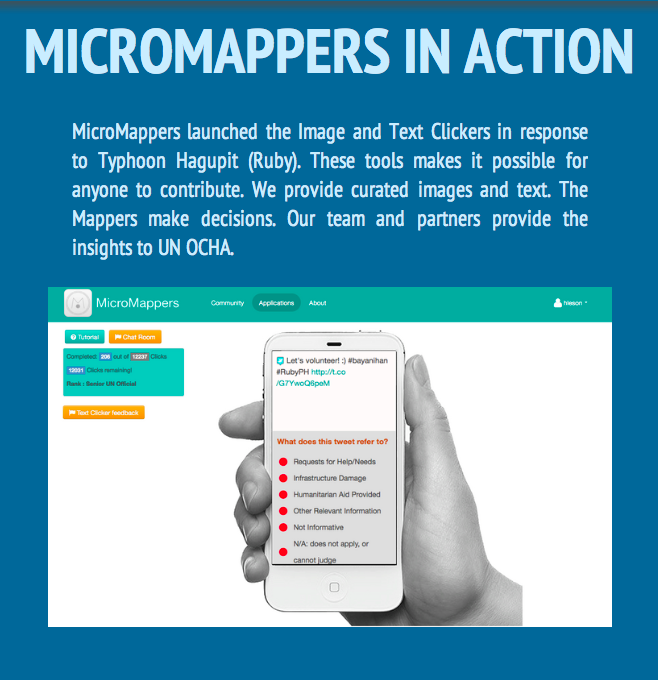
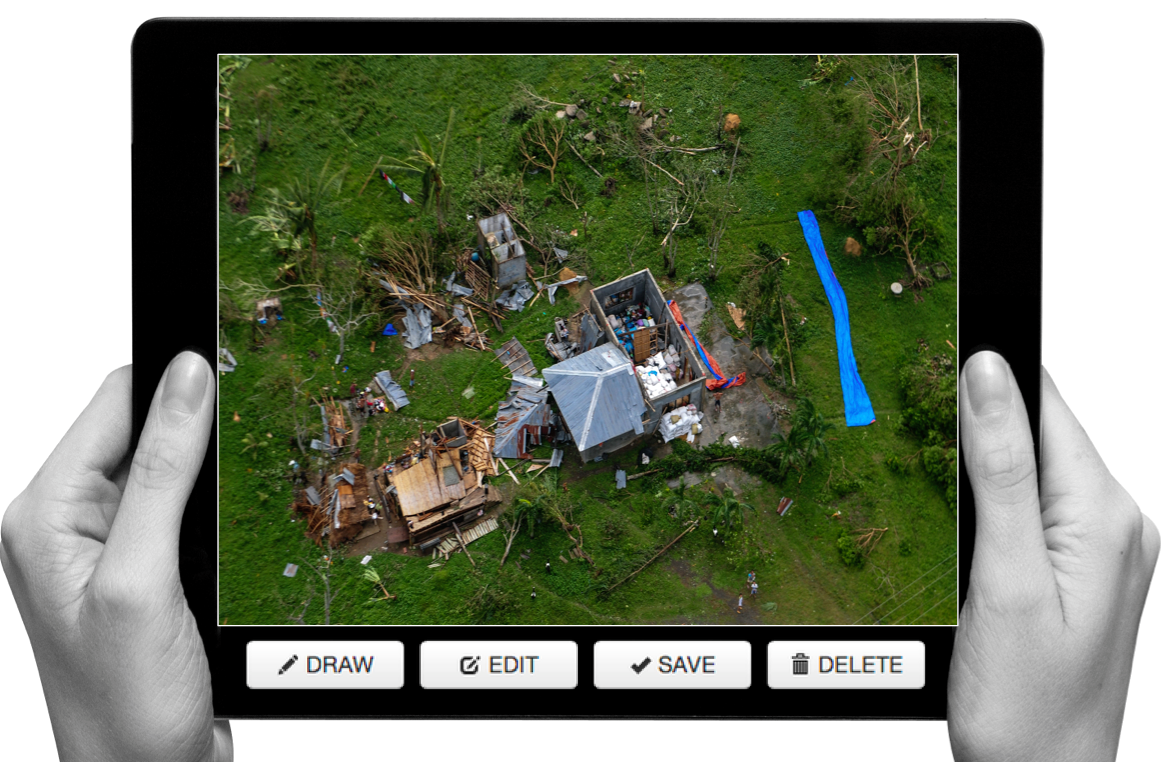
Human computing (or crowdsourcing) can also be used to make sense of Big Data. My team and I at QCRI have partnered with the UN (OCHA) to create the MicroMappers platform, which is a free and open-source tool to make sense of large datasets created during disasters, like aerial data. We have access to thousands of digital volunteers who can rapidly tag and trace aerial imagery; the resulting analysis of this tagging/tracing can be used to increase the situational awareness  of humanitarian organizations in the field.

Screen Shot 2014-06-24 at 2.32.43 PM


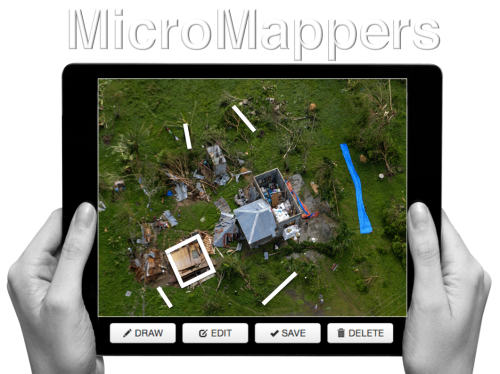
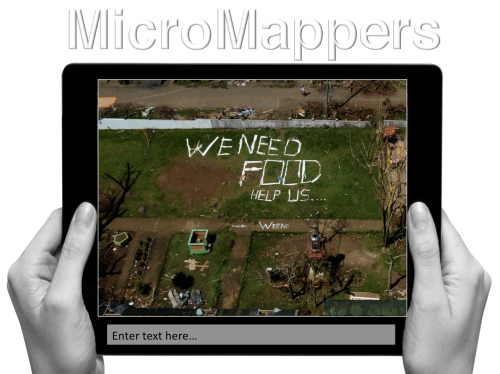
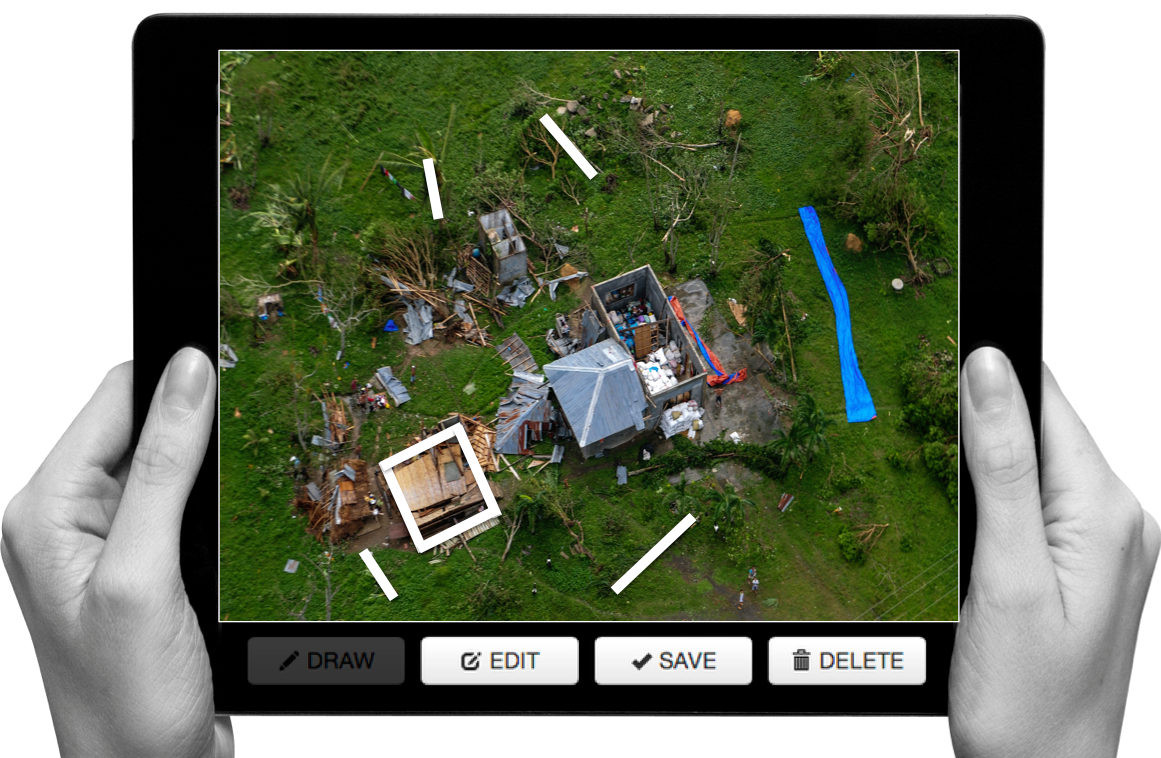
Digital volunteers can trace features of interest such as shelters without roofs. Our plan is to subsequently use these traced features as training data to develop machine learning classifiers that can automatically identify these features in future aerial images. We’re also exploring the second use-case depicted below, ie, the rapid transcription of imagery, which can then be automatically geo-tagged and added to a crisis map.

Screen Shot 2014-06-24 at 2.32.55 PM


The increasing use of UAVs during humanitarian disasters is why UAViators, the Humanitarian UAV Network, was launched. Recall the relief operations in response to Typhoon Yolanda; an unprecedented number of UAV projects were in operation. But most operators didn’t know about each other, so they were not coordinating flights let alone sharing imagery with local communities. Since the launch of UAViators, we’ve developed the first ever Code of Conduct for the use of UAVs in humanitarian settings, which includes guidelines on data protection and privacy. We have also drafted an Operational Check-List to educate those who are new to humanitarian UAVs. We are now in the process of carrying out a comprehensive evaluation of UAV models along with cameras, sensors, payload mechanism and image processing software. The purpose of this evaluation is to identify which are the best fit for use by humanitarians in the field. Since the UN and others are looking for training and certification programs, we are actively seeking partners to provide these services.

Screen Shot 2014-06-24 at 2.34.04 PM

The above goals are all for the medium to long term. More immediately, UAViators is working to educate humanitarian organizations on both the opportunities and challenges of using UAVs in humanitarian settings. UAViators is also working to facilitate the coordinate UAV flights during major disasters, enabling operators to share their flight plans and contact details with each other via the UAViators website. We are also planning to set up an SMS service to enable direct communication between operators and others in the field during UAV flights. Lastly, we are developing an online map for operators to easily share the imagery/videos they are collecting during relief efforts.

Screen Shot 2014-06-24 at 2.34.36 PM

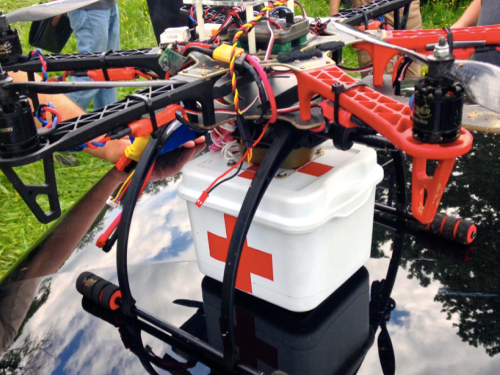
Data collection (imagery capture) is certainly not the only use case for UAVs in humanitarian contexts. The transportation of payloads may play an increasingly important role in the future. To be sure, my colleagues at UNICEF are actively exploring this with a number of partners in Africa.

Screen Shot 2014-06-24 at 2.34.47 PM

Other sensors also present additional opportunities for the use of UAVs in relief efforts. Sensors can be used to assess the impact of disasters on communication infrastructure, such as cell phone towers, for example. Groups are also looking into the use of UAVs to provide temporary communication infrastructure (“aerial cell phone towers”) following major disasters.

Screen Shot 2014-06-24 at 2.34.59 PM

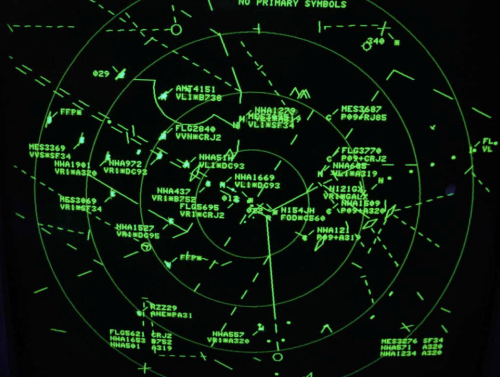
The need for Sense and Avoid systems (a.k.a. Detection & Avoid solutions) has been highlighted in almost every other presentation given at RPAS 2014. We really need this new technology earlier rather than later (and that’s a major  understatement). At the same time, it is important to emphasize that the main added value of UAVs in humanitarian settings is to capture imagery of areas that are overlooked or ignored by mainstream humanitarian relief operations; that is, of areas that are partially or completely disconnected logistically. By definition, disaster-affected communities in these areas are likely to be more vulnerable than others in urban areas. In addition, the airspaces in these disconnected regions are not complex airspaces and thus present fewer challenges around safety and coordination, for example.

Screen Shot 2014-06-24 at 2.35.19 PM

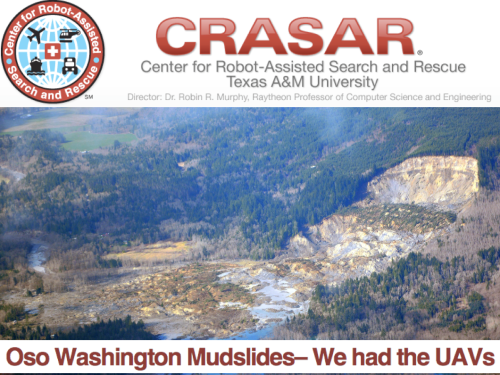
UAVs were ready to go following the mudslides in Oso, Washington back in March of this year. The UAVs were going to be used to look for survivors but the birds were not allowed to fly. The decision to ground UAVs and bar them from supporting relief and rescue efforts will become increasingly untenable when lives are at stake. I genuinely applaud the principle of proportionality applied by the EU and respective RPAS Associations vis-a-vis risks and regulations, but there is one very important variable missing in the proportionality equation: social benefit. Indeed, the cost benefit calculus of UAV risk & regulation in the context of humanitarian use must include the expected benefit of lives saved and suffering alleviated. Let me repeat this to make sure I’m crystal clear: risks must be weighed against potential lives saved.

Screen Shot 2014-06-24 at 2.35.39 PM

At the end of the day, the humanitarian context is different from precision agriculture or other commercial applications of UAVs such as film making. The latter have no relation to the Humanitarian Imperative. Having over-regulation stand in the way of humanitarian principles will simply become untenable. At the same time, the principle of Do No Harm must absolutely be upheld, which is why it features prominently in the Humanitarian UAV Network’s Code of Conduct. In sum, like the Do No Harm principle, the cost benefit analysis of proportionality must include potential or expected benefits as part of the calculus.

Screen Shot 2014-06-24 at 2.35.56 PM

To conclude, a new (forthcoming) policy brief by the UN (OCHA) publicly calls on humanitarian organizations to support initiatives like the Humanitarian UAV Network. This is an important, public endorsement of our work thus far. But we also need support from non-humanitarian organizations like those you represent in this room. For example, we need clarity on existing legislation. Our partners like the UN need to have access to the latest laws by country to inform their use of UAVs following major disasters. We really need your help on this; and we also need your help in identifying which UAVs and related technologies are likely to be a good fit for humanitarians in the field. So if you have some ideas, then please find me during the break, I’d really like to speak with you, thank you!

bio

See Also:

  • Crisis Map of UAV/Aerial Videos for Disaster Response [link]
  • How UAVs are Making a Difference in Disaster Response [link]
  • Humanitarians Using UAVs for Post Disaster Recovery [link]
  • Grassroots UAVs for Disaster Response [link]
  • Using UAVs for Search & Rescue [link]
  • Debrief: UAV/Drone Search & Rescue Challenge [link]
  • Crowdsourcing Analysis of UAV Imagery for Search/Rescue [link]
  • Check-List for Flying UAVs in Humanitarian Settings [link]

Picture Credits:

  • Danoffice IT; Drone Adventures, SkyEye, JRC


Using MicroMappers to Make Sense of UAV Imagery During Disasters

Aerial imagery will soon become a Big Data problem for humanitarian response—particularly oblique imagery. This was confirmed to me by a number of imagery experts in both the US (FEMA) and Europe (JRC). Aerial imagery taken at an angle is referred to as oblique imagery; compared to vertical imagery, which is taken by cameras pointing straight down (like satellite imagery). The team from Humanitarian OpenStreetMap (HOT) is already well equipped to make sense of vertical aerial imagery. They do this by microtasking the tracing of said imagery, as depicted below. So how do we rapidly analyze oblique images, which often provide more detail vis-a-vis infrastructure damage than vertical pictures?

HOTosm PH

One approach is to microtask the tagging of oblique images. This was carried out very successfully after Hurricane Sandy (screenshot below).

This solution did not include any tracing and was not designed to inform the development of machine learning classifiers to automatically identify features of interest, like damaged buildings, for example. Making sense of Big (Aerial) Data will ultimately require the combined use of human computing (microtasking) and machine learning. As volunteers use microtasking to trace features of interest such as damaged buildings pictured in oblique aerial imagery, perhaps machine learning algorithms can learn to detect these features automatically if enough examples of damaged buildings are provided. There is obviously value in doing automated feature detection with vertical imagery as well. So my team and I at QCRI have been collaborating with a local Filipino UAV start-up (SkyEye) to develop a new “Clicker” for our MicroMappers collection. We’ll be testing the “Aerial Clicker” below with our Filipino partners this summer. Incidentally, SkyEye is on the Advisory Board of the Humanitarian UAV Network (UAViators).

Aerial Clicker

Aerial Clicker 2

SkyEye is interested in developing a machine learning classifier to automatically identify coconut trees, for example. Why? Because coconut trees are an important source of livelihood for many Filipinos. Being able to rapidly identify trees that are still standing versus uprooted would enable SkyEye to quickly assess the impact of a Typhoon on local agriculture, which is important for food security & long-term recovery. So we hope to use the Aerial Clicker to microtask the tracing of coconut trees in order to significantly improve the accuracy of the machine learning classifier that SkyEye has already developed.

Will this be successful? One way to find out is by experimenting. I realize that developing a “visual version” of AIDR is anything but trivial. While AIDR was developed to automatically identify tweets (i.e., text) of interest during disasters by using microtasking and machine learning, what if we also had a free and open source platform to microtask and then automatically identify visual features of interest in both vertical and oblique imagery captured by UAVs? To be honest, I’m not sure how feasible this is vis-a-vis oblique imagery. As an imagery analyst at FEMA recently told me, this is still a research question for now. So I’m hoping to take this research on at QCRI but I do not want to duplicate any existing efforts in this space. So I would be grateful for feedback on this idea and any related research that iRevolution readers may recommend.

In the meantime, here’s another idea I’m toying with for the Aerial Clicker:

Aerial Clicker 3

I often see this in the aftermath of major disasters; affected communities turning to “analog social medial” to communicate when cell phone towers are down. The aerial imagery above was taken following Typhoon Yolanda in the Philippines. And this is just one of several dozen images with analog media messages that I came across. So what if our Aerial Clicker were to ask digital volunteers to transcribe or categorize these messages? This would enable us to quickly create a crisis map of needs based on said content since every image is already geo-referenced. Thoughts?

bio

See Also:

  • Welcome to the Humanitarian UAV Network [link]
  • How UAVs are Making a Difference in Disaster Response [link]
  • Humanitarians Using UAVs for Post Disaster Recovery [link]
  • Grassroots UAVs for Disaster Response [link]
  • Using UAVs for Search & Rescue [link]
  • Debrief: UAV/Drone Search & Rescue Challenge [link]
  • Crowdsourcing Analysis of UAV Imagery for Search/Rescue [link]
  • Check-List for Flying UAVs in Humanitarian Settings [link]