
It is said that our planet has a new nervous system; a digital nervous system comprised of digital veins and intertwined sensors that capture the pulse of our planet in near real-time. Next generation humanitarian technologies seek to leverage this new nervous system to detect and diagnose the impact of disasters within minutes rather than hours. To this end, LastQuake may be one of the most impressive humanitarian technologies that I have recently come across. Spearheaded by the European-Mediterranean Seismological Center (EMSC), the technology combines “Flashsourcing” with social media monitoring to auto-detect earthquakes before they’re picked up by seismometers or anyone else.
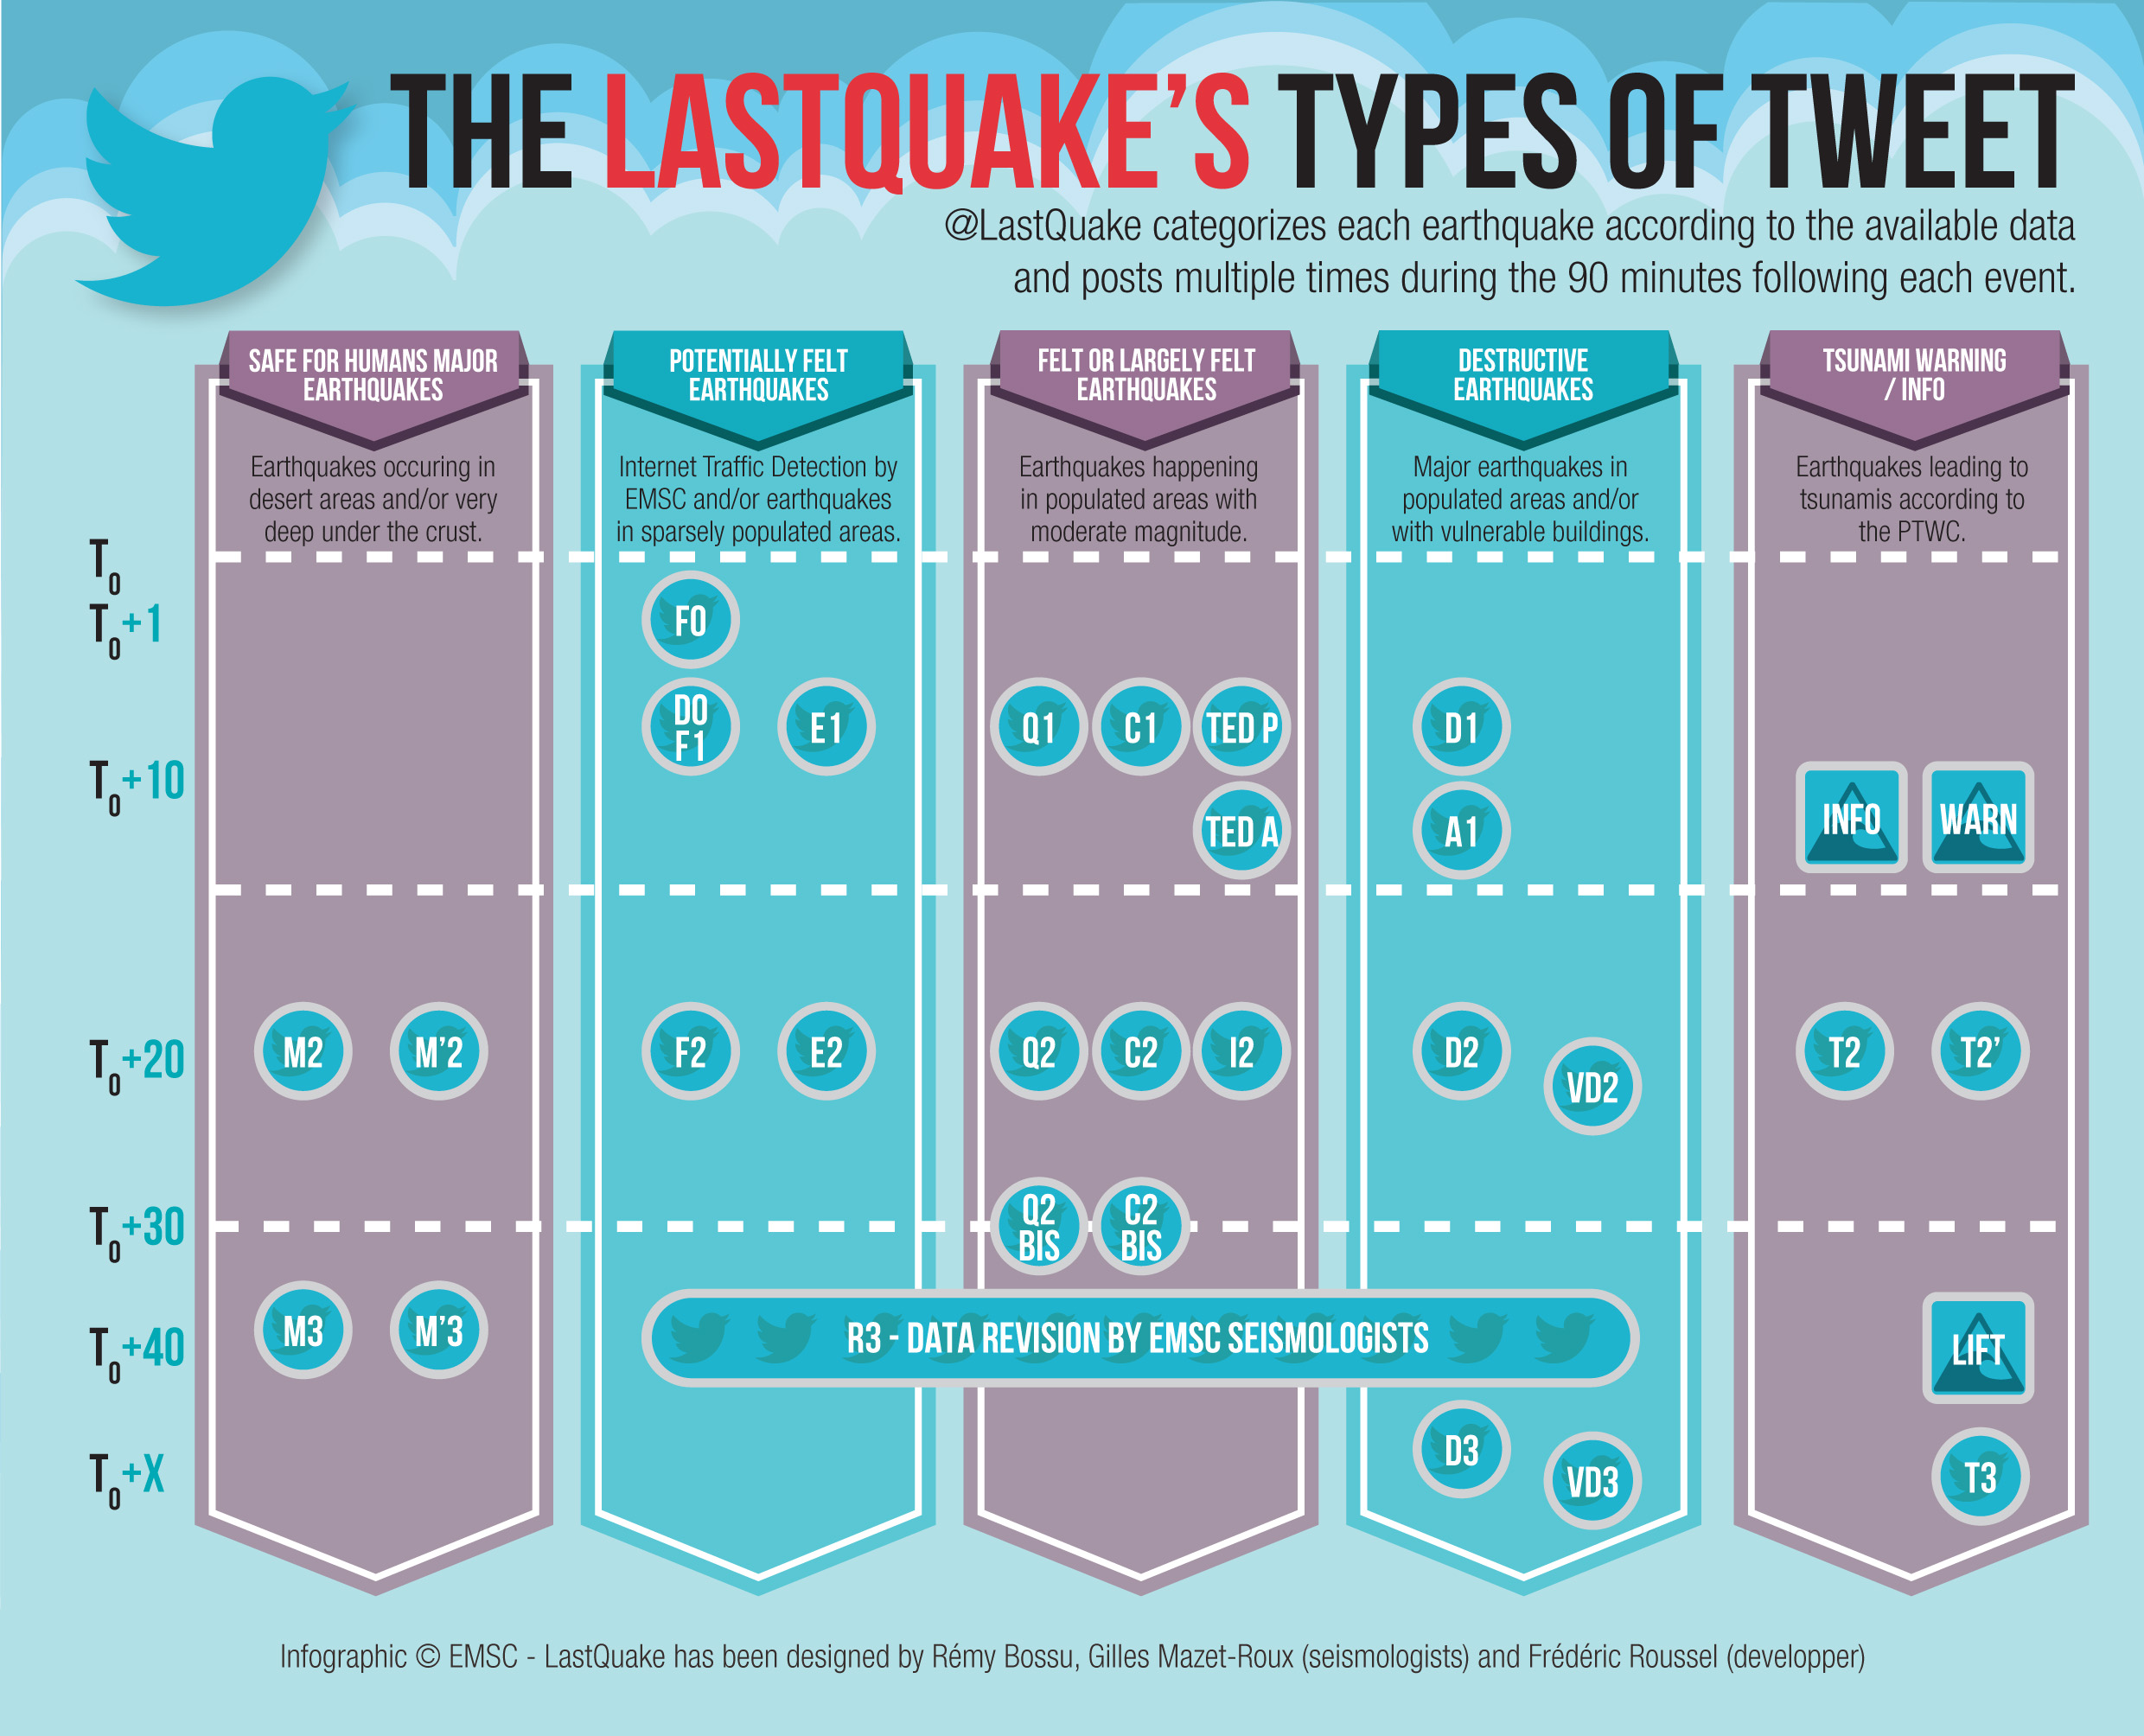
Scientists typically draw on ground-motion prediction algorithms and data on building infrastructure to rapidly assess an earthquake’s potential impact. Alas, ground-motion predictions vary significantly and infrastructure data are rarely available at sufficient resolutions to accurately assess the impact of earthquakes. Moreover, a minimum of three seismometers are needed to calibrate a quake and said seismic data take several minutes to generate. This explains why the EMSC uses human sensors to rapidly collect relevant data on earthquakes as these reduce the uncertainties that come with traditional rapid impact assess-ment methodologies. Indeed, the Center’s important work clearly demonstrates how the Internet coupled with social media are “creating new potential for rapid and massive public involvement by both active and passive means” vis-a-vis earthquake detection and impact assessments. Indeed, the EMSC can automatically detect new quakes within 80-90 seconds of their occurrence while simultaneously publishing tweets with preliminary information on said quakes, like this one:

In reality, the first human sensors (increases in web traffic) can be detected within 15 seconds (!) of a quake. The EMSC’s system continues to auto-matically tweet relevant information (including documents, photos, videos, etc.), for the first 90 minutes after it first detects an earthquake and is also able to automatically create a customized and relevant hashtag for individual quakes.
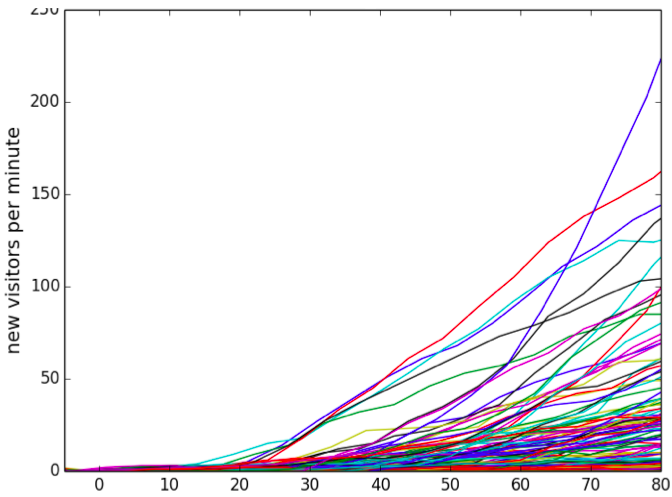
How do they do this? Well, the team draw on two real-time crowdsourcing methods that “indirectly collect information from eyewitnesses on earthquakes’ effects.” The first is TED, which stands for Twitter Earthquake Detection–a system developed by the US Geological Survey (USGS). TED filters tweets by key word, location and time to “rapidly detect sharing events through increases in the number of tweets” related to an earthquake. The second method, called “flashsourcing” was developed by the European-Mediterranean to analyze traffic patterns on its own website, “a popular rapid earthquake information website.” The site gets an average of 1.5 to 2 million visits a month. Flashsourcing allows the Center to detect surges in web traffic that often occur after earthquakes—a detection method named Internet Earthquake Detection (IED). These traffic surges (“flash crowds”) are caused by “eyewitnesses converging on its website to find out the cause of their shaking experience” and can be detected by analyzing the IP locations of website visitors.
It is worth emphasizing that both TED and IED work independently from traditional seismic monitoring systems. Instead, they are “based on real-time statistical analysis of Internet-based information generated by the reaction of the public to the shaking.” As EMSC rightly notes in a forthcoming peer-reviewed scientific study, “Detections of felt earthquakes are typically within 2 minutes for both methods, i.e., considerably faster than seismographic detections in poorly instrumented regions of the world.” TED and IED are highly complementary methods since they are based on two entirely “different types of Internet use that might occur after an earthquake.” TED depends on the popularity of Twitter while IED’s effectiveness depends on how well known the EMSC website is in the area affected by an earthquake. LastQuake automatically publishes real-time information on earthquakes by automatically merging real-time data feeds from both TED and IED as well as non-crowdsourcing feeds.
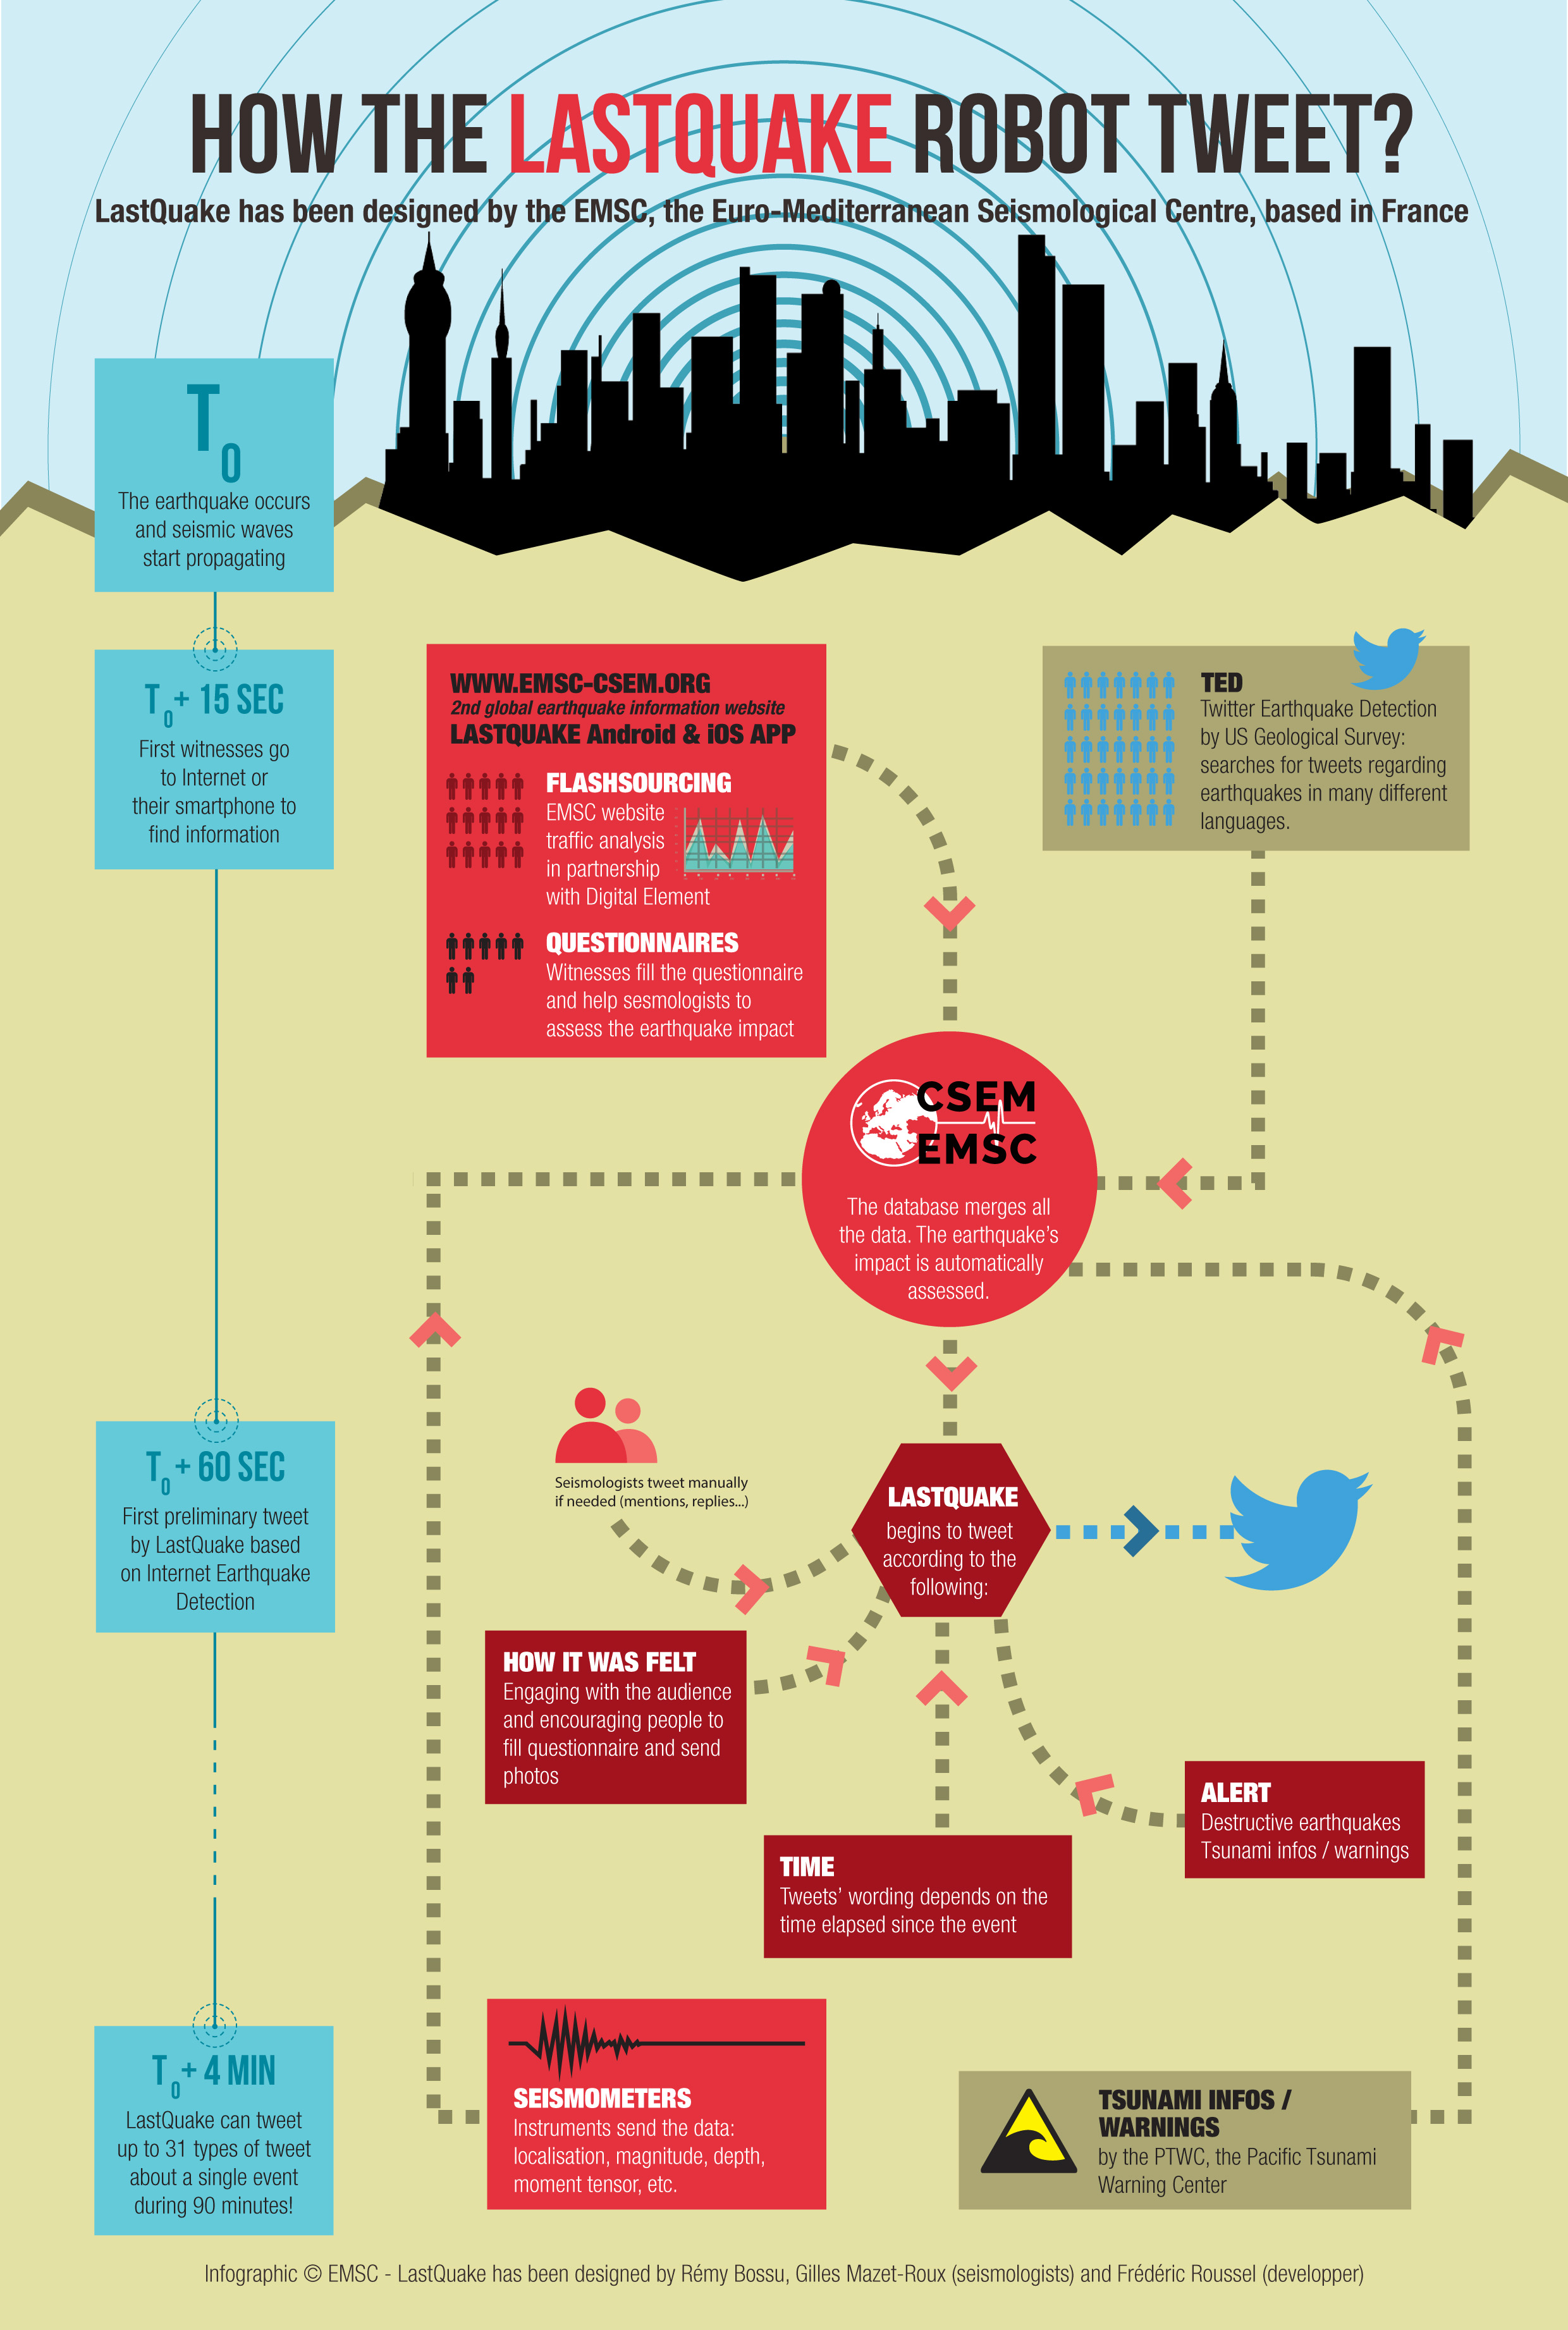
Lets looks into the methodology that powers IED. Flashsourcing can be used to detect felt earthquakes and provide “rapid information (within 5 minutes) on the local effects of earthquakes. More precisely, it can automatically map the area where shaking was felt by plotting the geographical locations of statistically significant increases in traffic […].” In addition, flashsourcing can also “discriminate localities affected by alarming shaking levels […], and in some cases it can detect and map areas affected by severe damage or network disruption through the concomitant loss of Internet sessions originating from the impacted region.” As such, this “negative space” (where there are no signals) is itself an important signal for damage assessment, as I’ve argued before.
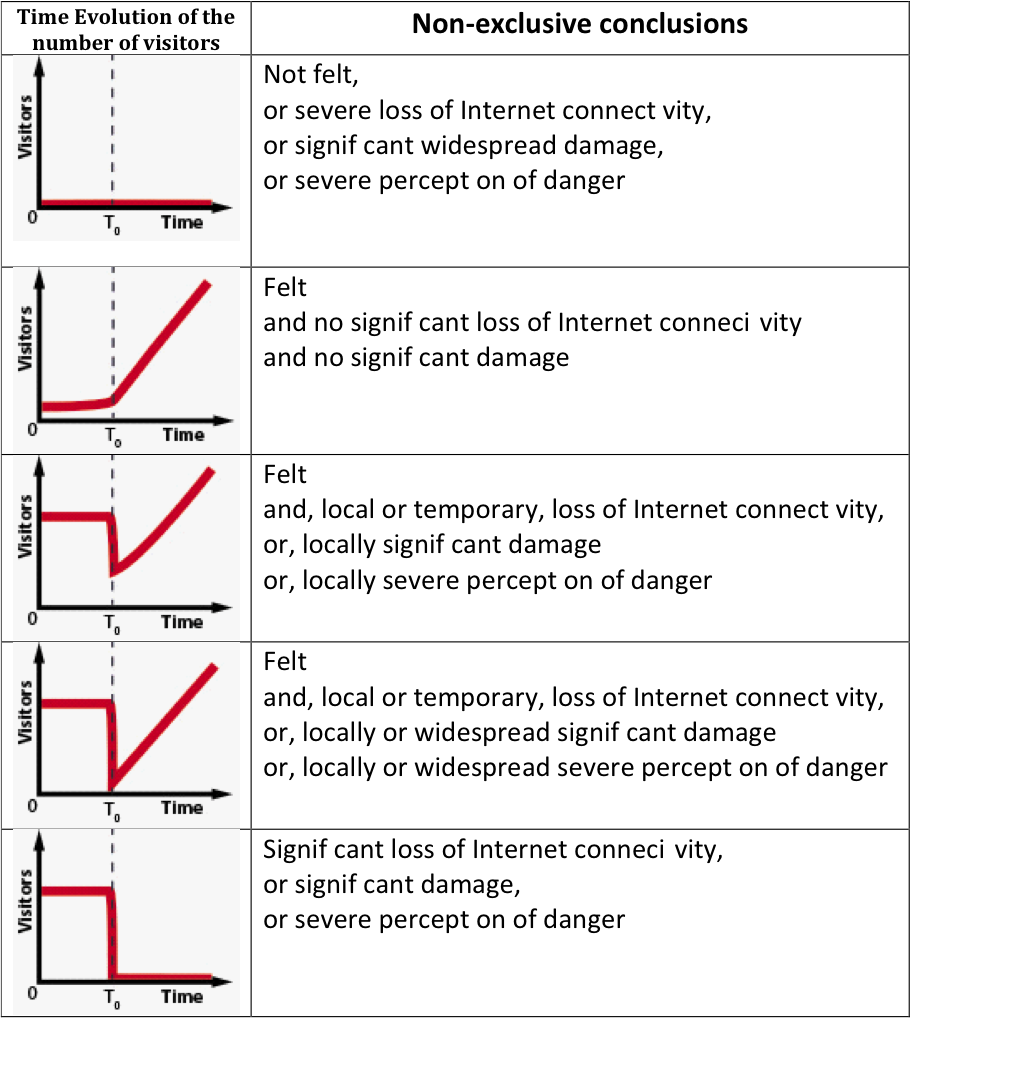 In the future, EMSC’s flashsourcing system may also be able discriminate power cuts between indoor and outdoor Internet connections at the city level since the system’s analysis of web traffic session will soon be based on web sockets rather than webserver log files. This automatic detection of power failures “is the first step towards a new system capable of detecting Internet interruptions or localized infrastructure damage.” Of course, flashsourcing alone does not “provide a full description of earthquake impact, but within a few minutes, independently of any seismic data, and, at little cost, it can exclude a number of possible damage scenarios, identify localities where no significant damage has occurred and others where damage cannot be excluded.”
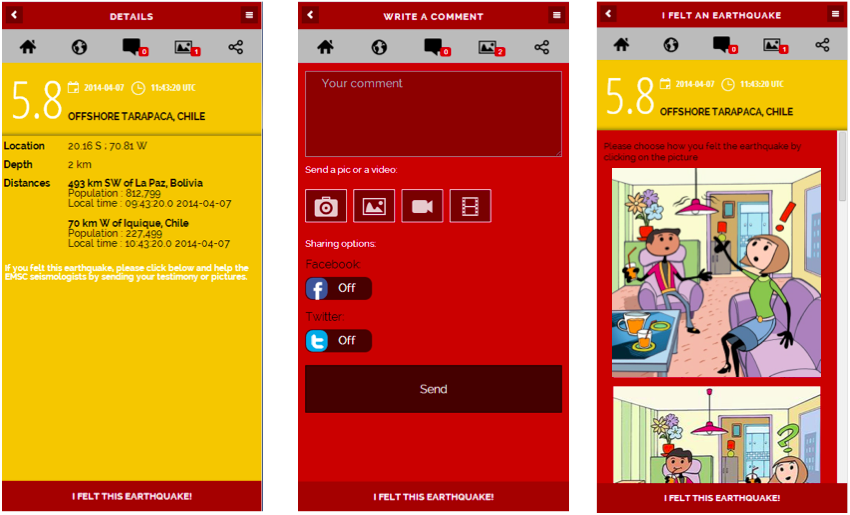
EMSC is complementing their flashsourching methodology with a novel mobile app that quickly enables smartphone users to report about felt earthquakes. Instead of requiring any data entry and written surveys, users simply click on cartoonish-type pictures that best describe the level of intensity they felt when the earthquake (or aftershocks) struck. In addition, EMSC analyzes and manually validates geo-located photos and videos of earthquake effects uploaded to their website (not from social media). The Center’s new app will also make it easier for users to post more pictures more quickly.
What about typical criticisms (by now broken records) that social media is biased and unreliable (and thus useless)? What about the usual theatrics about the digital divide invalidating any kind of crowdsourcing effort given that these will be heavily biased and hardly representative of the overall population? Despite these already well known short-comings and despite the fact that our inchoate digital networks are still evolving into a new nervous system for our planet, the existing nervous system—however imperfect and immature—still adds value. TED and LastQuake demonstrate this empirically beyond any shadow of a doubt. What’s more, the EMSC have found that crowdsourced, user-generated information is highly reliable: “there are very few examples of intentional misuses, errors […].”
My team and I at QCRI are honored to be collaborating with EMSC on integra-ting our AIDR platform to support their good work. AIDR enables uses to automatically detect tweets of interest by using machine learning (artificial intelligence) which is far more effective searching for keywords. I recently spoke with Rémy Bossu, one masterminds behind the EMSC’s LastQuake project about his team’s plans for AIDR:
“For us AIDR could be a way to detect indirect effects of earthquakes, and notably triggered landslides and fires. Landslides can be the main cause of earthquake losses, like during the 2001 Salvador earthquake. But they are very difficult to anticipate, depending among other parameters on the recent rainfalls. One can prepare a susceptibility map but whether there are or nor landslides, where they have struck and their extend is something we cannot detect using geophysical methods. For us AIDR is a tool which could potentially make a difference on this issue of rapid detection of indirect earthquake effects for better situation awareness.”
In other words, as soon as the EMSC system detects an earthquake, the plan is for that detection to automatically launch an AIDR deployment to automatically identify tweets related to landslides. This integration is already completed and being piloted. In sum, EMSC is connecting an impressive ecosystem of smart, digital technologies powered by a variety of methodologies. This explains why their system is one of the most impressive & proven examples of next generation humanitarian technologies that I’ve come across in recent months.

Acknowledgements: Many thanks to Rémy Bossu for providing me with all the material and graphics I needed to write up this blog post.
See also:


