Tag Archives: Vision

Aerial Robotics for Search & Rescue: State of the Art?

WeRobotics is co-creating a global network of labs to transfer robotics solutions to those who need them most. These “Flying Labs” take on different local flavors based on the needs and priorities of local partners. Santiago Flying Labs is one of the labs under consideration. Our local partners in Chile are interested in the application of robotics for disaster preparedness and Search & Rescue (SaR) operations. So what is the state of the art in rescue robotics?

WP0

One answer may lie several thousand miles away in Lushan, China, which experienced a 7.0 magnitude earthquake in 2013. The mountainous area made it near impossible for the Chinese International Search and Rescue Team (CISAR) to implement a rapid search and post-seismic evaluation. So State Key Robotics Lab at Shenyang Institute of Automation offered aerial support to CISAR. They used their aerial robot (UAV) to automatically and accurately detect collapsed buildings for ground rescue guidance. This saved the SaR teams considerable time. Here’s how.

WP5

A quicker SaR response leads to a higher survival rate. The survival rate is around 90% within the first 30 minutes but closer to 20% by day four. “In traditional search methods, ground rescuers are distributed to all possible places, which is time consuming and inefficient.” An aerial inspection of the disaster damage can help accelerate the ground search for survivors by prioritizing which areas to search first.

WP1

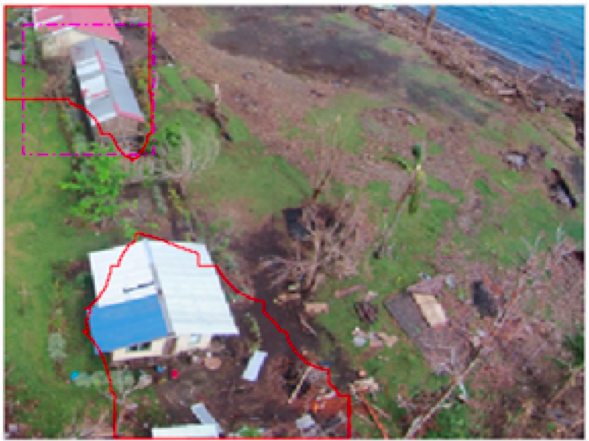
State Key Labs used a ServoHeli aerial robot to capture live video footage of the damaged region. And this is where it gets interesting. “Because the remains of a collapsed building often fall onto the ground in arbitrary directions, their shapes will exhibit random gradients without particular orientations. Thus, in successive aerial images, the random shape of a collapsed building will lead to particular motion features that can be used to discriminate collapsed from non-collapsed buildings.”

WP2

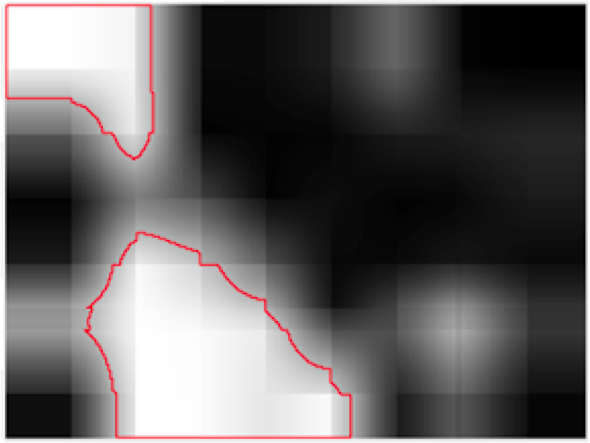
These distinct motion features can be quantified using a histogram of oriented gradient (HOG) as depicted here (click to enlarge):

WP4
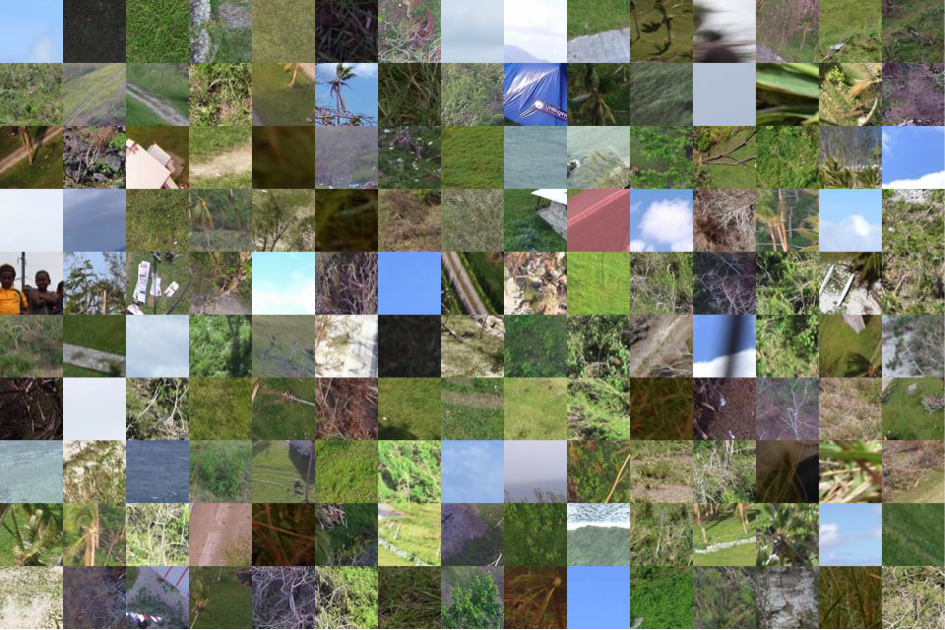
As is clearly evident from the histograms, the “HOG variation of a normal building will be much larger than that of a collapsed one.” The team at State Key Labs had already employed this technique to train and test their automated feature-detection algorithm using aerial video footage from the 2010 Haiti Earthquake. Sample results of this are displayed below. Red rectangles denote where the algorithm was successful in identifying damage. Blue rectangles are false alarms while orange rectangles are missed detections.

Screen Shot 2016-02-07 at 2.55.14 AM

Screen Shot 2016-02-07 at 2.54.14 AM

Screen Shot 2016-02-07 at 2.55.57 AM

While the team achieved increasingly accurate detection rates for Haiti, the initial results for Lushan were not as robust. This was due to the fact that Lushan is far more rural than Port-au-Prince, which tripped up the algorithm. Eventually, the software achieved an accurate rate of 83.4% without any missed collapses, however. The use of aerial robotics and automated feature detection algorithms in Xinglong Village (9.5 sq. km) enabled CISAR to cut their search time in half. In sum, the team concluded that videos are more valuable for SaR operations than static images.

Screen Shot 2016-02-07 at 2.53.05 AM

Screen Shot 2016-02-07 at 2.52.26 AM

To learn more about this deployment, see the excellent write-up “Search and Rescue Rotary-Wing UAV and Its Application to the Lushan Ms 7.0 Earthquake” published in the Journal of Field Robotics. I wish all robotics deployments were this well documented. Another point that I find particularly noteworthy about this operation is that it was conducted three years ago already. In other words, real-time feature detection of disaster damage from live aerial video footage was already used operationally years ago.

WP3
What’s more, this paper published in 2002 (!) used computer vision to detect with a 90% accuracy rate collapsed buildings in aerial footage of the 1995 Kobe earthquake captured by television crews in helicopters. Perhaps in the near future we’ll have automated feature detection algorithms for disaster damage assessments running on live video footage from news channels and aerial robots. These could then be complemented by automated change-detection algorithms running on satellite imagery. In any event, the importance of applied research is clearly demonstrated by the Lushan deployments. This explains why WeRobotics
always aims to have local universities involved in Flying Labs.


Thanks to the ICARUS Team for pointing me to this deployment.

Using Computer Vision to Analyze Aerial Big Data from UAVs During Disasters

Recent scientific research has shown that aerial imagery captured during a single 20-minute UAV flight can take more than half-a-day to analyze. We flew several dozen flights during the World Bank’s humanitarian UAV mission in response to Cyclone Pam earlier this year. The imagery we captured would’ve taken a single expert analyst a minimum 20 full-time workdays to make sense of. In other words, aerial imagery is already a Big Data problem. So my team and I are using human computing (crowdsourcing), machine computing (artificial intelligence) and computer vision to make sense of this new Big Data source.

For example, we recently teamed up with the University of Southampton and EPFL to analyze aerial imagery of the devastation caused by Cyclone Pam in Vanuatu. The purpose of this research is to generate timely answers. Aid groups want more than high-resolution aerial images of disaster-affected areas, they want answers; answers like the number and location of damaged buildings, the number and location of displaced peoples, and which roads are still useable for the delivery of aid, for example. Simply handing over the imagery is not good enough. As demonstrated in my new book, Digital Humanitarians, both aid and development organizations are already overwhelmed by the vast volume and velocity of Big Data generated during and post-disasters. Adding yet another source, Big Aerial Data, may be pointless since these organizations may simply not have the time or capacity to make sense of this new data let alone integrate the results with their other datasets.

We therefore analyzed the crowdsourced results from the deployment of our MicroMappers platform following Cyclone Pam to determine whether those results could be used to train algorithms to automatically detect disaster damage in future disasters in Vanuatu. During this MicroMappers deployment, digital volunteers analyzed over 3,000 high-resolution oblique aerial images, tracing houses that were fully destroyed, partially damaged and largely intact. My colleague Ferda Ofli and I teamed up with Nicolas Rey (a graduate student from EPFL who interned with us over the summer) to explore whether these traces could be used to train our algorithms. The results below were written with Ferda and Nicolas. Our research is not just an academic exercise. Vanuatu is the most disaster-prone country in the world. What’s more, this year’s El Niño is expected to be one of the strongest in half-a-century.

Screen Shot 2015-10-11 at 6.11.04 PM

According to the crowdsourced results, 1,145 of the high-resolution images did not contain any buildings. Above is a simple histogram depicting the number of buildings per image. The aerial images of Vanuatu are very heterogeneous, and vary not only in diversity of features they exhibit but also in the angle of view and the altitude at which the pictures were taken. While the vast majority of the images are oblique, some are almost nadir images, and some were taken very close to the ground or even before take off.

Screen Shot 2015-10-11 at 6.45.15 PM

The heterogeneity of our dataset of images makes the automated analysis of this imagery a lot more difficult. Furthermore, buildings that are under construction, of which there are many in our dataset, represent a major difficulty because they look very similar to damaged buildings. Our first task thus focused on training our algorithms to determine whether or not any given aerial image shows some kind of building. This is an important task given that more than ~30% of the images in our dataset do not contain buildings. As such, if we can develop an accurate algorithm to automatically filter out these irrelevant images (like the “noise” below), this will allows us focus the crowdsourced analysis of relevant images only.

Vanuatu3

While our results are purely preliminary, we are still pleased with our findings thus far. We’ve been able to train our algorithms to determine whether or not an aerial image includes a building with just over 90% accuracy at the tile level. More specifically, our algorithms were able to recognize and filter out 60% of the images that do not contain any buildings (recall rate), and only 10% of the images that contain buildings were mistakingly discarded (precision rate of 90%). The example below is an example. There are still quite a number of major challenges, however, so we want to be sure not to over-promise anything at this stage. In terms of next steps, we would like to explore whether our computer vision algorithms can distinguish between destroyed an intact buildings.

Screen Shot 2015-10-11 at 6.57.05 PMScreen Shot 2015-10-11 at 6.57.15 PM

The UAVs we were flying in Vanuatu required that we landed them in order to get access to the collected imagery. Increasingly, newer UAVs offer the option of broadcasting the aerial images and videos back to base in real time. DJI’s new Phantom 3 UAV (pictured below), for example, allows you to broadcast your live aerial video feed directly to YouTube (assuming you have connectivity). There’s absolutely no doubt that this is where the UAV industry is headed; towards real-time data collection and analysis. In terms of humanitarian applications, and search and rescue, having the data-analysis carried out in real-time is preferable.

WP27

This explains why my team and I recently teamed up with Elliot Salisbury & Sarvapali Ramchurn from the University of Southampton to crowdsource the analysis of live aerial video footage of disaster zones and to combine this crowdsourcing with (hopefully) near real-time machine learning and automated feature detection. In other words, as digital volunteers are busy tagging disaster damage in video footage, we want our algorithms to learn from these volunteers in real-time. That is, we’d like the algorithms to learn what disaster damage looks like so they can automatically identify any remaining disaster damage in a given aerial video.

So we recently carried out a MicroMappers test-deployment using aerial videos from the humanitarian UAV mission to Vanuatu. Close to 100 digital volunteers participated in this deployment. Their task? To click on any parts of the videos that show disaster damage. And whenever 80% or more of these volunteers clicked on the same areas, we would automatically highlight these areas to provide near-real time feedback to the UAV pilot and humanitarian teams.

At one point during the simulations, we had some 30 digital volunteers clicking on areal videos at the same time, resulting in an average of 12 clicks per second for more than 5 minutes. In fact, we collectively clicked on the videos a total of 49,706 times! This provided more than enough real-time data for MicroMappers to act as a human-intelligence sensor for disaster damage assessments. In terms of accuracy, we had about 87% accuracy with the collective clicks. Here’s how the simulations looked like to the UAV pilots as we were all clicking away:

Thanks to all this clicking, we can export only the most important and relevant parts of the video footage while the UAV is still flying. These snippets, such as this one and this one, can then be pushed to MicroMappers for additional verification. These animations are small and quick, and reduce a long aerial video down to just the most important footage. We’re now analyzing the areas that were tagged in order to determine whether we can use this data to train our algorithms accordingly. Again, this is far more than just an academic curiosity. If we can develop robust algorithms during the next few months, we’ll be ready to use them effectively during the next Typhoon season in the Pacific.

In closing, big thanks to my team at QCRI for translating my vision of Micro-Mappers into reality and for trusting me well over a year ago when I said we needed to extend our work to aerial imagery. All of the above research would simply not have been possible without MicroMappers existing. Big thanks as well to our excellent partners at EPFL and Southampton for sharing our vision and for their hard work on our joint projects. Last but certainly not least, sincerest thanks to digital volunteers from SBTF and beyond for participating in these digital humanitarian deployments.

MicroMappers: Towards Next Generation Humanitarian Technology

The MicroMappers platform has come a long way and still has a ways to go. Our vision for MicroMappers is simple: combine human computing (smart crowd-sourcing) with machine computing (artificial intelligence) to filter, fuse and map a variety of different data types such as text, photo, video and satellite/aerial imagery. To do this, we have created a collection of “Clickers” for MicroMappers. Clickers are simply web-based crowdsourcing apps used to make sense of “Big Data”. The “Text Cicker” is used to filter tweets & SMS’s; “Photo Clicker” to filter photos; “Video Clicker” to filter videos and yes the Satellite & Aerial Clickers to filter both satellite and aerial imagery. These are the Data Clickers. We also have a collection of Geo Clickers that digital volunteers use to geo-tag tweets, photos and videos filtered by the Data Clickers. Note that these Geo Clickers auto-matically display the results of the crowdsourced geo-tagging on our MicroMaps like the one below.

MM Ruby Tweet Map

Thanks to our Artificial Intelligence (AI) engine AIDR, the MicroMappers “Text Clicker” already combines human and machine computing. This means that tweets and text messages can be automatically filtered (classified) after some initial crowdsourced filtering. The filtered tweets are then pushed to the Geo Clickers for geo-tagging purposes. We want to do the same (semi-automation) for photos posted to social media as well as videos; although this is still a very active area of research and development in the field of computer vision.

So we are prioritizing our next hybrid human-machine computing efforts on aerial imagery instead. Just like the “Text Clicker” above, we want to semi-automate feature detection in aerial imagery by adding an AI engine to the “Aerial Clicker”. We’ve just starting to explore this with computer vision experts in Switzerland and Canada. Another development we’re eyeing vis-a-vis UAVs is live video streaming. To be sure, UAVs will increasingly be transmitting live video feeds directly to the web. This means we may eventually need to develop a “Streaming Clicker”, which would in some respects resemble our existing “Video Clicker” except that the video would be broadcasting live rather than play back from YouTube, for example. The “Streaming Clicker” is for later, however, or at least until a prospective partner organization approaches us with an immediate and compelling social innovation use-case.

In the meantime, my team & I at QCRI will continue to improve our maps (data visualizations) along with the human computing component of the Clickers. The MicroMappers smartphone apps, for example, need more work. We also need to find partners to help us develop apps for tablets like the iPad. In addition, we’re hoping to create a “Translate Clicker” with Translators Without Borders (TWB). The purpose of this Clicker would be to rapidly crowdsource the translation of tweets, text messages, etc. This could open up rather interesting possibilities for machine translation, which is certainly an exciting prospect.

MM All Map

Ultimately, we want to have one and only one map to display the data filtered via the Data and Geo Clickers. This map, using (Humanitarian) OpenStreetMap as a base layer, would display filtered tweets, SMS’s, photos, videos and relevant features from satellite and UAV imagery. Each data type would simply be a different layer on this fused “Meta-Data Crisis Map”; and end-users would simply turn individual layers on and off as needed. Note also the mainstream news feeds (CNN and BBC) depicted in the above image. We’re working with our partners at UN/OCHA, GDELT & SBTF to create a “3W Clicker” to complement our MicroMap. As noted in my forthcoming book, GDELT is the ultimate source of data for the world’s digitized news media. The 3Ws refers to Who, What, Where; an important spreadsheet that OCHA puts together and maintains in the aftermath of major disasters to support coordination efforts.

In response to Typhoon Ruby in the Philippines, Andrej Verity (OCHA) and I collaborated with Kalev Leetaru from GDELT to explore how the MicroMappers “3W Clicker” might work. The result is the Google Spreadsheet below (click to enlarge) that is automatically updated every 15 minutes with the latest news reports that refer to one or more humanitarian organizations in the Philippines. GDELT includes the original URL of the news article as well as the list of humanitarian organizations referenced in the article. In addition, GDELT automatically identifies the locations referred to in the articles, key words (tags) and the date of the news article. The spreadsheet below is already live and working. So all we need now is the “3W Clicker” to crowdsource the “What”.

MM GDELT output

The first version of the mock-up we’ve created for the “3W Clicker” is displayed below. Digital volunteers are presented with an interface that includes an news article with the names of humanitarian organizations highlighted in red for easy reference. GDELT auto-populates the URL, the organization name (or names if there are more than one) and the location. Note that both the “Who” & “Where” information can be edited directly by the volunteer incase GDELT’s automated algorithm gets those wrong. The main role of digital volunteers, however, would simply be to identify the “What” by quickly skimming the article.

MM 3W Clicker v2

The output of the “3W Clicker” would simply be another MicroMap layer. As per Andrej’s suggestion, the resulting data could also be automatically pushed to another Google Spreadsheet in HXL format. We’re excited about the possibilities and plan to move forward on this sooner rather than later. In addition to GDELT, pulling in feeds from CrisisNET may be worth exploring. I’m also really keen on exploring ways to link up with the Global Disaster Alert & Coordination System (GDACS) as well as GeoFeedia.

In the meantime, we’re hoping to pilot our “Satellite Clicker” thanks to recent conversations with Planet Labs and SkyBox Imaging. Overlaying user-generated content such as tweets and images on top of both satellite and aerial imagery can go a long way to helping verify (“ground truth”) social media during disasters and other events. This is evidenced by recent empirical studies such as this one in Germany and this one in the US. On this note, as my QCRI colleague Heather Leson recently pointed out, the above vision for MicroMappers is still missing one important data feed; namely sensors—the Internet of Things. She is absolutely spot on, so we’ll be sure to look for potential pilot projects that would allow us to explore this new data source within MicroMappers.

The above vision is a tad ambitious (understatement). We really can’t do this alone. To this end, please do get in touch if you’re interested in joining the team and getting MicroMappers to the next level. Note that MicroMappers is free and open source and in no way limited to disaster response applications. Indeed, we recently used the Aerial Clicker for this wildlife protection project in Namibia. This explains why our friends over at National Geographic have also expressed an interest in potentially piloting the MicroMappers platform for some of their projects. And of course, one need not use all the Clickers for a project, simply the one(s) that make sense. Another advantage of MicroMappers is that the Clickers (and maps) can be deployed very rapidly (since the platform was initially developed for rapid disaster response purposes). In any event, if you’d like to pilot the platform, then do get in touch.

bio

See also: Digital Humanitarians – The Book