Tag Archives: Vanuatu

Increasing the Reliability of Aerial Imagery Analysis for Damage Assessments

In March 2015, I was invited by the World Bank to spearhead an ambitious humanitarian aerial robotics (UAV) mission to Vanuatu following Cyclone Pam, a devastating Category 5 Cyclone. This mission was coordinated with Heliwest and X-Craft, two outstanding UAV companies who were identified through the Humanitarian UAV Network (UAViators) Roster of Pilots. You can learn more about the mission and see pictures here. Lessons learned from this mission (and many others) are available here.

Screen Shot 2016-02-22 at 6.12.21 PM

The World Bank and partners were unable to immediately analyze the aerial imagery we had collected because they faced a Big Data challenge. So I suggested the Bank activate the Digital Humanitarian Network (DHN) to request digital volunteer assistance. As a result, Humanitarian OpenStreetMap (HOT) analyzed some of the orthorectified mosaics and MicroMappers focused on analyzing the oblique images (more on both here).

This in turn produced a number of challenges. To cite just one, the Bank needed digital humanitarians to identify which houses or buildings were completely destroyed, versus partially damaged versus largely intact. But there was little guidance on how to determine what constituted fully destroyed versus partially damaged or what such structures in Vanuatu look like when damaged by a Cyclone. As a result, data quality was not as high as it could have been. In my capacity as consultant for the World Bank’s UAVs for Resilience Program, I decided to do something about this lack of guidelines for imagery interpretation.

I turned to my colleagues at the Harvard Humanitarian Initiative (where I had previously co-founded and co-directed the HHI Program on Crisis Mapping) and invited them to develop a rigorous guide that could inform the consistent interpretation of aerial imagery of disaster damage in Vanuatu (and nearby Island States). Note that Vanuatu is number one on the World Bank’s Risk Index of most disaster-prone countries. The imagery analysis guide has just published (PDF) by the Signal Program on Human Security and Technology at HHI.

Big thanks to the HHI team for having worked on this guide and for my Bank colleagues and other reviewers for their detailed feedback on earlier drafts. The guide is another important step towards improving data quality for satellite and aerial imagery analysis in the context of damage assessments. Better data quality is also important for the use of Artificial Intelligence (AI) and computer vision as explained here. If a humanitarian UAV mission does happen in response to the recent disaster in Fiji, then the guide may also be of assistance there depending on how similar the building materials and architecture is. For now, many thanks to HHI for having produced this imagery guide.

Using Computer Vision to Analyze Aerial Big Data from UAVs During Disasters

Recent scientific research has shown that aerial imagery captured during a single 20-minute UAV flight can take more than half-a-day to analyze. We flew several dozen flights during the World Bank’s humanitarian UAV mission in response to Cyclone Pam earlier this year. The imagery we captured would’ve taken a single expert analyst a minimum 20 full-time workdays to make sense of. In other words, aerial imagery is already a Big Data problem. So my team and I are using human computing (crowdsourcing), machine computing (artificial intelligence) and computer vision to make sense of this new Big Data source.

For example, we recently teamed up with the University of Southampton and EPFL to analyze aerial imagery of the devastation caused by Cyclone Pam in Vanuatu. The purpose of this research is to generate timely answers. Aid groups want more than high-resolution aerial images of disaster-affected areas, they want answers; answers like the number and location of damaged buildings, the number and location of displaced peoples, and which roads are still useable for the delivery of aid, for example. Simply handing over the imagery is not good enough. As demonstrated in my new book, Digital Humanitarians, both aid and development organizations are already overwhelmed by the vast volume and velocity of Big Data generated during and post-disasters. Adding yet another source, Big Aerial Data, may be pointless since these organizations may simply not have the time or capacity to make sense of this new data let alone integrate the results with their other datasets.

We therefore analyzed the crowdsourced results from the deployment of our MicroMappers platform following Cyclone Pam to determine whether those results could be used to train algorithms to automatically detect disaster damage in future disasters in Vanuatu. During this MicroMappers deployment, digital volunteers analyzed over 3,000 high-resolution oblique aerial images, tracing houses that were fully destroyed, partially damaged and largely intact. My colleague Ferda Ofli and I teamed up with Nicolas Rey (a graduate student from EPFL who interned with us over the summer) to explore whether these traces could be used to train our algorithms. The results below were written with Ferda and Nicolas. Our research is not just an academic exercise. Vanuatu is the most disaster-prone country in the world. What’s more, this year’s El Niño is expected to be one of the strongest in half-a-century.

Screen Shot 2015-10-11 at 6.11.04 PM

According to the crowdsourced results, 1,145 of the high-resolution images did not contain any buildings. Above is a simple histogram depicting the number of buildings per image. The aerial images of Vanuatu are very heterogeneous, and vary not only in diversity of features they exhibit but also in the angle of view and the altitude at which the pictures were taken. While the vast majority of the images are oblique, some are almost nadir images, and some were taken very close to the ground or even before take off.

Screen Shot 2015-10-11 at 6.45.15 PM

The heterogeneity of our dataset of images makes the automated analysis of this imagery a lot more difficult. Furthermore, buildings that are under construction, of which there are many in our dataset, represent a major difficulty because they look very similar to damaged buildings. Our first task thus focused on training our algorithms to determine whether or not any given aerial image shows some kind of building. This is an important task given that more than ~30% of the images in our dataset do not contain buildings. As such, if we can develop an accurate algorithm to automatically filter out these irrelevant images (like the “noise” below), this will allows us focus the crowdsourced analysis of relevant images only.

Vanuatu3

While our results are purely preliminary, we are still pleased with our findings thus far. We’ve been able to train our algorithms to determine whether or not an aerial image includes a building with just over 90% accuracy at the tile level. More specifically, our algorithms were able to recognize and filter out 60% of the images that do not contain any buildings (recall rate), and only 10% of the images that contain buildings were mistakingly discarded (precision rate of 90%). The example below is an example. There are still quite a number of major challenges, however, so we want to be sure not to over-promise anything at this stage. In terms of next steps, we would like to explore whether our computer vision algorithms can distinguish between destroyed an intact buildings.

Screen Shot 2015-10-11 at 6.57.05 PMScreen Shot 2015-10-11 at 6.57.15 PM

The UAVs we were flying in Vanuatu required that we landed them in order to get access to the collected imagery. Increasingly, newer UAVs offer the option of broadcasting the aerial images and videos back to base in real time. DJI’s new Phantom 3 UAV (pictured below), for example, allows you to broadcast your live aerial video feed directly to YouTube (assuming you have connectivity). There’s absolutely no doubt that this is where the UAV industry is headed; towards real-time data collection and analysis. In terms of humanitarian applications, and search and rescue, having the data-analysis carried out in real-time is preferable.

WP27

This explains why my team and I recently teamed up with Elliot Salisbury & Sarvapali Ramchurn from the University of Southampton to crowdsource the analysis of live aerial video footage of disaster zones and to combine this crowdsourcing with (hopefully) near real-time machine learning and automated feature detection. In other words, as digital volunteers are busy tagging disaster damage in video footage, we want our algorithms to learn from these volunteers in real-time. That is, we’d like the algorithms to learn what disaster damage looks like so they can automatically identify any remaining disaster damage in a given aerial video.

So we recently carried out a MicroMappers test-deployment using aerial videos from the humanitarian UAV mission to Vanuatu. Close to 100 digital volunteers participated in this deployment. Their task? To click on any parts of the videos that show disaster damage. And whenever 80% or more of these volunteers clicked on the same areas, we would automatically highlight these areas to provide near-real time feedback to the UAV pilot and humanitarian teams.

At one point during the simulations, we had some 30 digital volunteers clicking on areal videos at the same time, resulting in an average of 12 clicks per second for more than 5 minutes. In fact, we collectively clicked on the videos a total of 49,706 times! This provided more than enough real-time data for MicroMappers to act as a human-intelligence sensor for disaster damage assessments. In terms of accuracy, we had about 87% accuracy with the collective clicks. Here’s how the simulations looked like to the UAV pilots as we were all clicking away:

Thanks to all this clicking, we can export only the most important and relevant parts of the video footage while the UAV is still flying. These snippets, such as this one and this one, can then be pushed to MicroMappers for additional verification. These animations are small and quick, and reduce a long aerial video down to just the most important footage. We’re now analyzing the areas that were tagged in order to determine whether we can use this data to train our algorithms accordingly. Again, this is far more than just an academic curiosity. If we can develop robust algorithms during the next few months, we’ll be ready to use them effectively during the next Typhoon season in the Pacific.

In closing, big thanks to my team at QCRI for translating my vision of Micro-Mappers into reality and for trusting me well over a year ago when I said we needed to extend our work to aerial imagery. All of the above research would simply not have been possible without MicroMappers existing. Big thanks as well to our excellent partners at EPFL and Southampton for sharing our vision and for their hard work on our joint projects. Last but certainly not least, sincerest thanks to digital volunteers from SBTF and beyond for participating in these digital humanitarian deployments.

How Digital Jedis Are Springing to Action In Response To Cyclone Pam

Digital Humanitarians sprung to action just hours after the Category 5 Cyclone collided with Vanuatu’s many islands. This first deployment focused on rapidly assessing the damage by analyzing multimedia content posted on social media and in the mainstream news. This request came directly from the United Nations (OCHA), which activated the Digital Humanitarian Network (DHN) to carry out the rapid damage assessment. So the Standby Task Force (SBTF), a founding member of the DHN, used QCRI′s MicroMappers platform to produce a digital, interactive Crisis Map of some 1,000+ geo-tagged pictures of disaster damage (screenshot below).

MM_ImageMap_Vanuatu

Within days of Cyclone Pam making landfall, the World Bank (WB) activated the Humanitarian UAV Network (UAViators) to quickly deploy UAV pilots to the affected islands. UAViators has access to a global network of 700+ professional UAV pilots is some 70+ countries worldwide. The WB identified two UAV teams from the Humanitarian UAV Network and deployed them to capture very high-resolution aerial photographs of the damage to support the Government’s post-disaster damage assessment efforts. Pictures from these early UAV missions are available here. Aerial images & videos of the disaster damage were also posted to the UAViators Crowdsourced Crisis Map.

Last week, the World Bank activated the DHN (for the first time ever) to help analyze the many, many GigaBytes of aerial imagery from Vanuatu. So Digital Jedis from the DHN are now using Humanitarian OpenStreetMap (HOT) and MicroMappers (MM) to crowdsource the search for partially damaged and fully destroyed houses in the aerial imagery. The OSM team is specifically looking at the “nadir imagery” captured by the UAVs while MM is exclusively reviewing the “oblique imagery“. More specifically, digital volunteers are using MM to trace destroyed houses red, partially damaged houses orange, and using blue to denote houses that appear to have little to no damage. Below is an early screenshot of the Aerial Crisis Map for the island of Efate. The live Crisis Map is available here.

Screen Shot 2015-04-06 at 10.56.09 AM

Clicking on one of these markers will open up the high resolution aerial pictures taken at that location. Here, two houses are traced in blue (little to no damage) and two on the upper left are traced in orange (partial damage expected).

Screen Shot 2015-04-06 at 10.57.17 AM

The cameras on the UAVs captured the aerial imagery in very high resolution, as you can see from the close up below. You’ll note two traces for the house. These two traces were done by two independent volunteers (for the purposes of quality control). In fact, each aerial image is shown to at least 3 different Digital Jedis.

Screen Shot 2015-04-06 at 10.58.31 AM

Once this MicroMappers deployment is over, we’ll be using the resulting traces to create automated featured detection algorithms; just like we did here for the MicroMappers Namibia deployment. This approach, combining crowdsourcing with Artificial Intelligence (AI), is explored in more detail here vis-a-vis disaster response. The purpose of taking this hybrid human-machine computing solution is to accelerate (semi-automate) future damage assessment efforts.

Meanwhile, back in Vanuatu, the HOT team has already carried out some tentative, preliminary analysis of the damage based on the aerial imagery provided. They are also up-dating their OSM maps of the affected islands thanks this imagery. Below is an initial damage assessment carried out by HOT for demonstration purposes only. Please visit their deployment page on the Vanuatu response for more information.

2015-04-04_18h04_00

So what’s next? Combining both the nadir and oblique imagery to interpret disaster damage is ultimately what is needed, so we’re actually hoping to make this happen (today) by displaying the nadir imagery directly within the Aerial Crisis Map produced by MicroMappers. (Many thanks to the MapBox team for their assistance on this). We hope this integration will help HOT and our World Bank partners better assess the disaster damage. This is the first time that we as a group are doing anything like this, so obviously lots of learning going on, which should improve future deployments. Ultimately, we’ll need to create 3D models (point clouds) of disaster affected areas (already easy to do with high-resolution aerial imagery) and then simply use MicroMappers to crowdsource the analysis of these 3D models.

And here’s a 3D model of a village in Vanuatu constructed using 2D aerial photos taken by UAV:

For now, though, Digital Jedis will continue working very closely with the World Bank to ensure that the latter have the results they need in the right format to deliver a comprehensive damage assessment to the Government of Vanuatu by the end of the week. In the meantime, if you’re interested in learning more about digital humanitarian action, then please check out my new book, which features UAViators, HOT, MM and lots more.

Pictures: Humanitarian UAV Mission to Vanuatu in Response to Cyclone Pam

Aéroport de Port Vila – Bauerfield International Airport. As we land, thousands of uprooted trees could be seen in almost every direction.

WP1

Massive roots were not enough to save these trees from Cyclone Pam. The devastation reminds us how powerful nature is.

WP2

WP3

WP4

After getting clearance from the Australian Defense Force (ADF), we pack up our UAVs and head over to La Lagune for initial tests. Close collaboration with the military is an absolute must for humanitarian UAV missions. UAVs cannot operate in Restricted Operations Zones without appropriate clearance.

WP5

We’re in Vanuatu by invitation of the Government’s National Disaster Risk Management Office (NDMO). So we’re working very closely with our hosts to assess disaster damage and resulting needs. The government and donors need the damage quantified to assess how much funding is necessary for the recovery efforts; and where geographically that funding should be targeted.

WP6

Ceci n’est pas un drone; what we found at La Lagune, where the ADF has set up camp. At 2200 every night we send the ADF our flight plan clearance requests for the following day. For obvious safety reasons, we never deviate from these plans after they’ve been approved.

WP6b

Unpacking and putting together the hexacopters can take a long time. The professional and certified UAV team from New Zealand (X-Craft) follows strict operational check lists to ensure safety and security. We also have a professional and certified team from Australia, Heliwest, which will be flying quadcopters. The UAV team from SPC is also joining our efforts. I’m proud to report that both the Australian & New Zealand teams were recruited directly from the pilot roster of the Humanitarian UAV Network.

WP7

WP8

WP11

WP9

WP10

The payload (camera) attached to our hexacopters; not exactly a GoPro. We also have other sensors for thermal imaging, etc.

WP12

Programming the test flights. Here’s a quick video intro on how to program UAVs for autonomous flights.

WP13

Night falls fast in Vanuatu…

WP14

WP14b

… So our helpful drivers kindly light up our work area.

WP15

After flawless test flights; we’re back at “HQ” to program the flight paths for tomorrow morning’s humanitarian UAV missions. The priority survey areas tend to change on a daily basis as the government gets more information on which outlying islands have been hardest hit. Our first mission will focus on an area comprised of informal settlements.

WP16

WP16b

Dawn starts to break at 0500. We haven’t gotten much sleep.

WP17

At 0600, we arrive at the designated meeting point, the Beach Bar. This will be our base of operations for this morning’s mission.

WP18

WP19

The flight plans for the hexacopters are ready to go. We have clearance from Air Traffic Control (ATC) to fly until 0830 as manned aircraft start operating extensively after 0900. So in complex airspaces like this one in Vanuatu’s Port Vila, we only fly very early in the morning and after 1700 in the evening. We have ATC’s direct phone number and are in touch with the tower at all times.

WP20

Could this be the one and only SXSW 2015 bag in Vanuatu?

WP20b

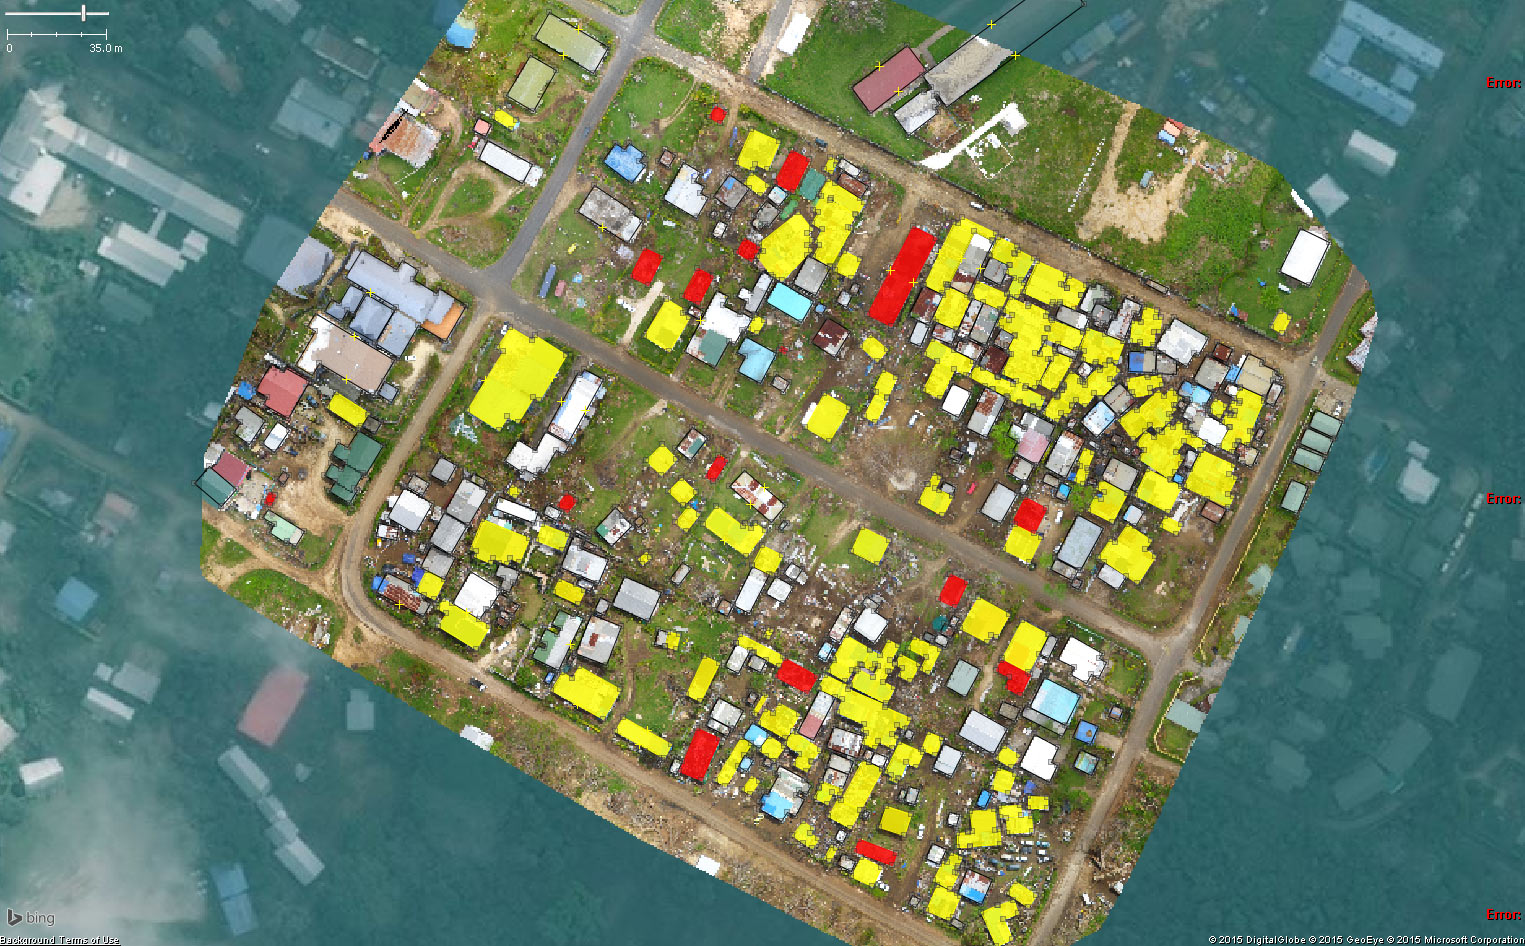
All our multirotor UAVs have been tested once again and are now ready to go. The government has already communicated to nearby villages that UAVs will be operating between 0630-0830. We aim to collect aerial imagery at a resolution of 4cm-6cm throughout our missions.

WP22

WP21

An old basketball court; perfect for take-off & landing.

WP23

And of course, when we’re finally ready to fly, it starts to pour. Other challenges include an ash cloud from a nearby volcano. We’ve also been told that kids here are pro’s with slingshots (which is one reason why the government informed local villagers of the mission; i.e., to request that kids not use the UAVs for target practice).

WP24

After some delays, we are airborne at last.

WP26

Operating the UAViators DJI Phantom…

WP26b

… Which I’m using purely for documentary purposes. In coming days, we’ll be providing our government partners with a hands-on introduction on how to operate Phantom II’s. Building local capacity is key; which is why this action item is core to the Humanitarian UAV Network’s Code of Conduct.

WP27

WP27b

WP27c

Can you spot the hexacopter? While there’s only one in the picture below, we actually have two in the air at different altitudes which we are operating by Extended Line of Site and First Person View as a backup.

WP27a

More aerial shots I took using the Phantom (not for damage assessment; simply for documentary purposes).

Screen Shot 2015-03-28 at 9.55.11 PM

Can you spot the basketball court?

WP28

Large clouds bring back the rain; visibility is reduced. We have to suspend our flights; will try again after 1700.

WP30

WP31

WP29

Meanwhile, my Phantom’s GoPro snaps this close up picture on landing.

WP32

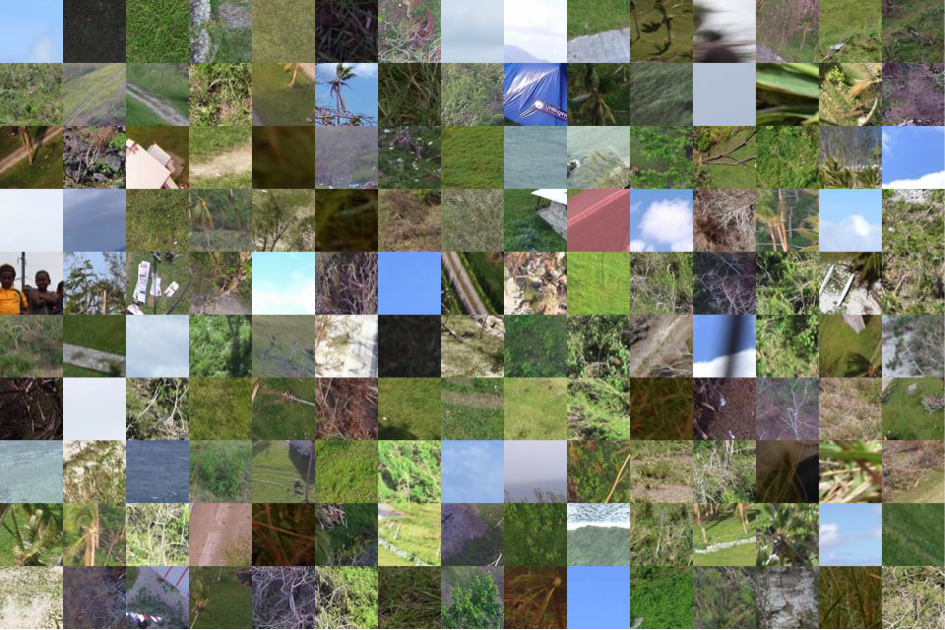
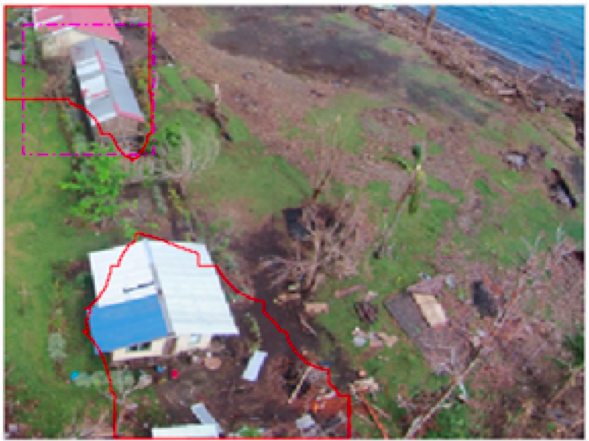
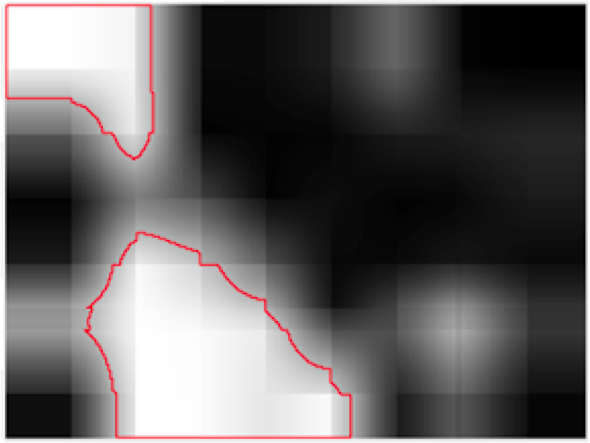
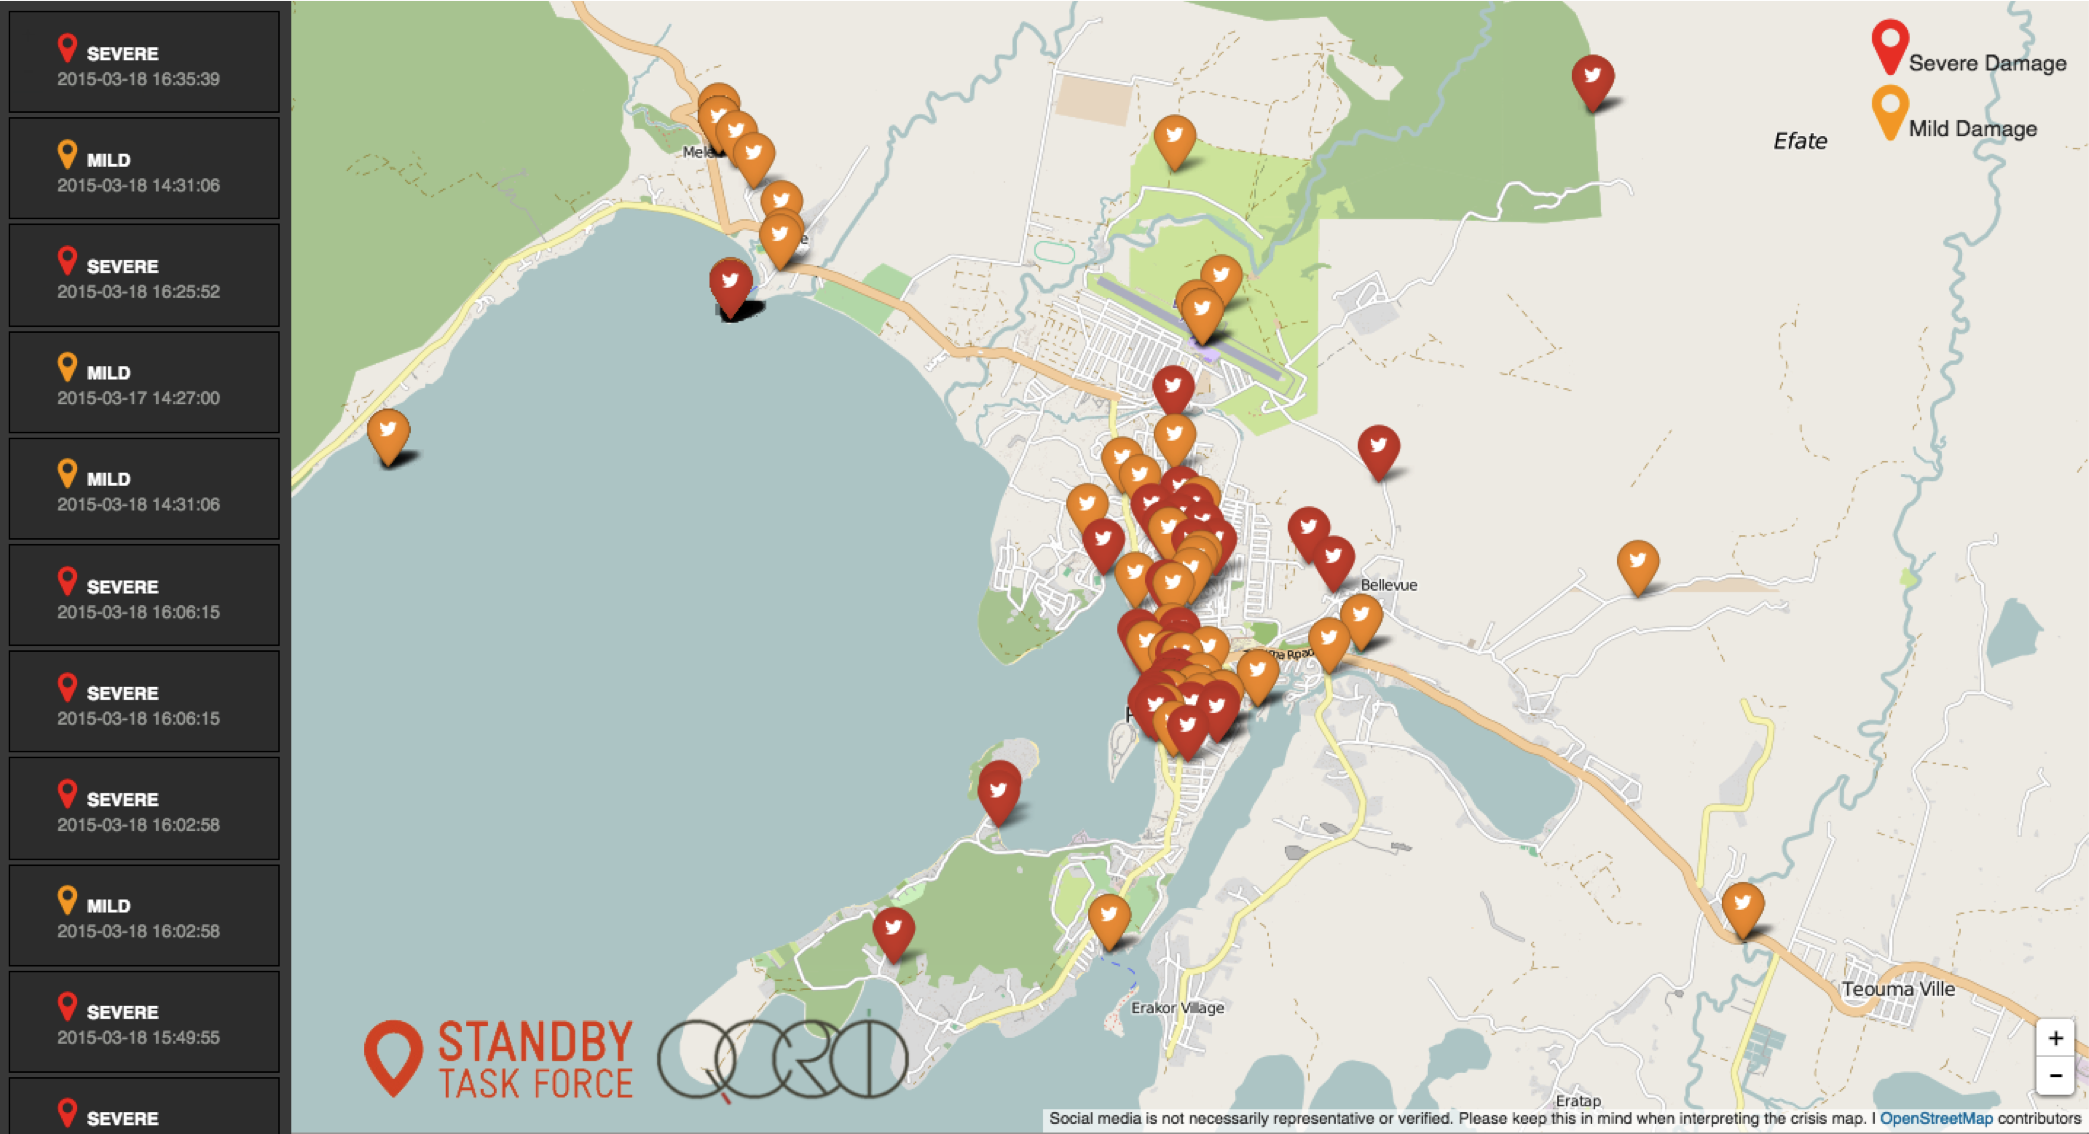
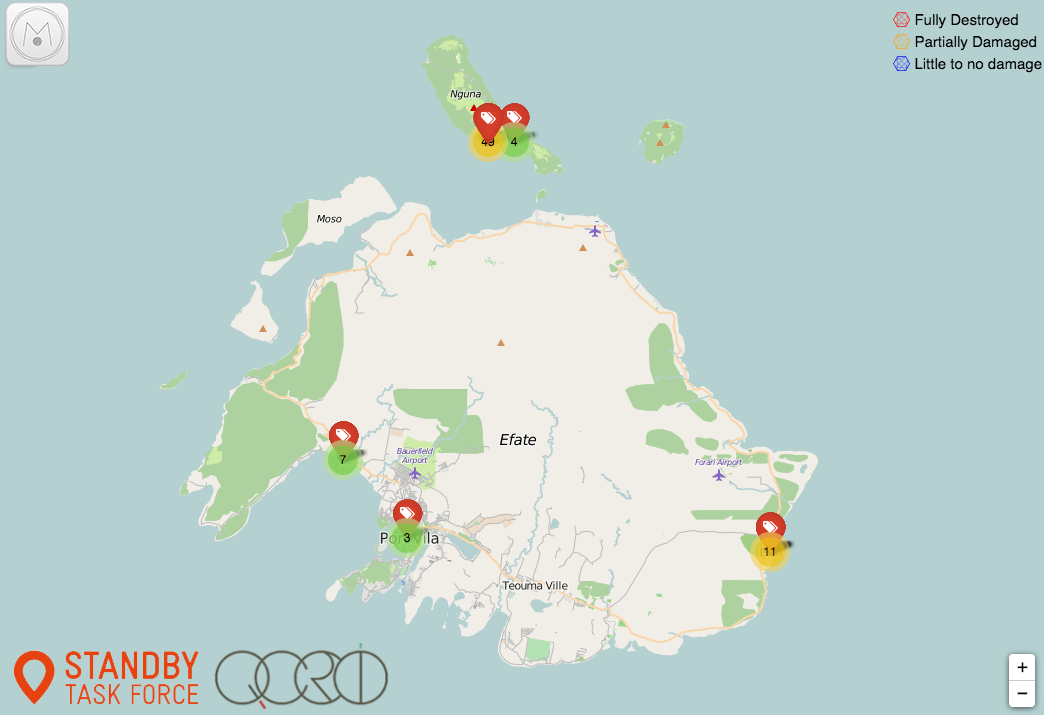
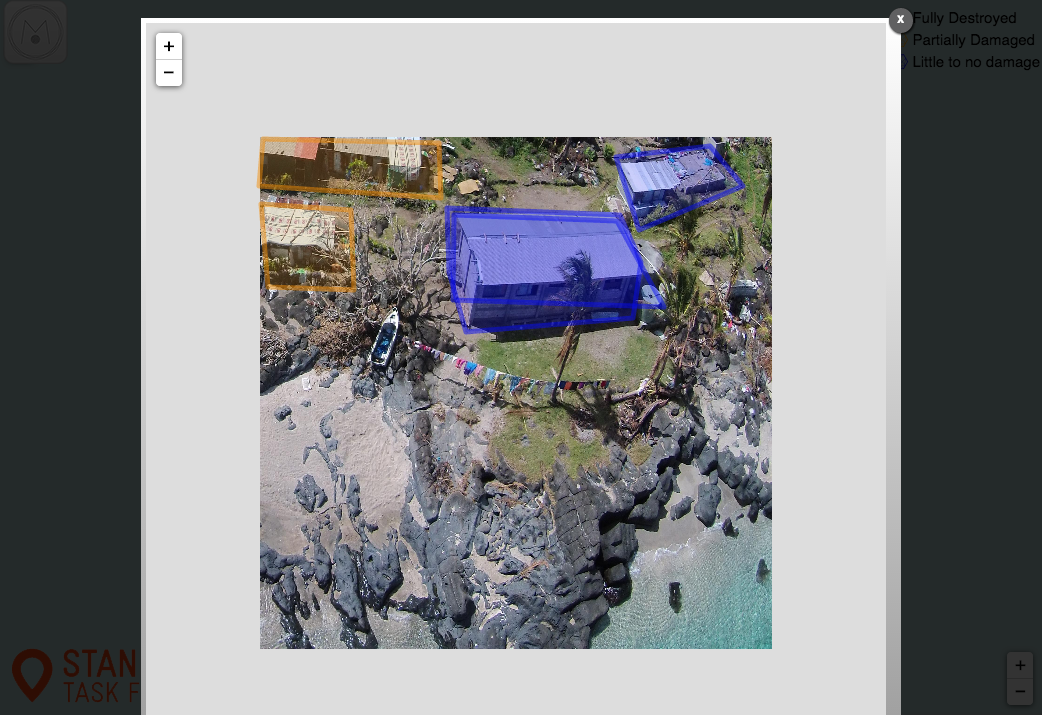
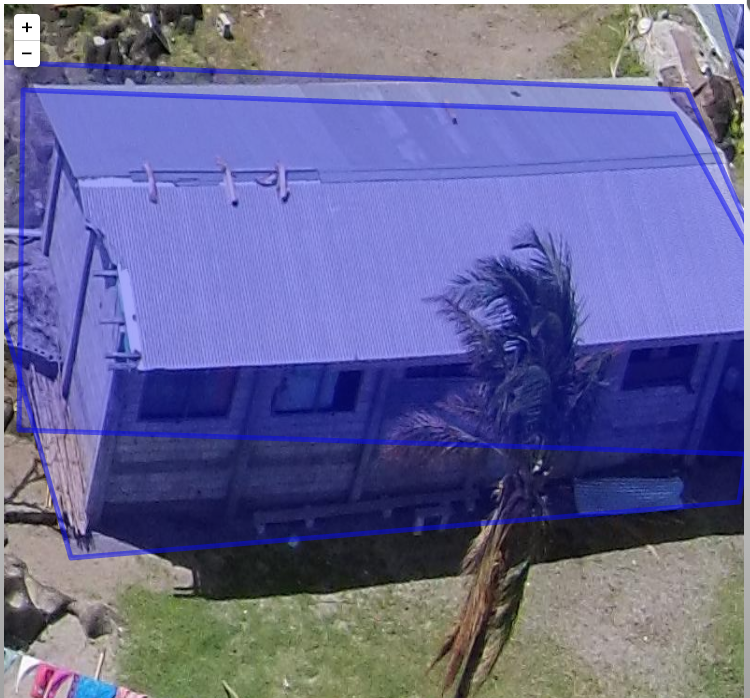
Stay tuned for updates and in particular the very high resolution aerial imagery that we’ll be posting to MapBox in coming days; along with initial analysis carried out by multiple partners including Humanitarian OpenStreetMap (HOT) and QCRI‘s MicroMappers. Many thanks to MapBox for supporting our efforts. We will also be overlaying the aerial imagery analysis over this MicroMappers crisis map of ground-based pictures of disaster damage in order to triangulate the damage assessment results. Check out the latest update here.

In the meantime, more information on this Humanitarian UAV Mission to Vanuatu–spearheaded by the World Bank in very close collaboration with the Government and SPC–can be found on the Humanitarian UAV Network (UAViators) Ops page here. UAViators is an initiative I launched at QCRI following Typhoon Haiyan in the Philippines in 2013. More on UAViators and the use of humanitarian UAVs in my new book Digital Humanitarians.

Important: this blog post is a personal update written in my personal capacity; none of the above is in any way shape or form a formal communique or press release by any of the partners. Official updates will be provided by the Government of Vanuatu and World Bank directly. Please contact me here for official media requests; kindly note that my responses will need to be cleared by the Government & Bank first.