Tag Archives: Disaster

Back to the Future: Drones in Humanitarian Action

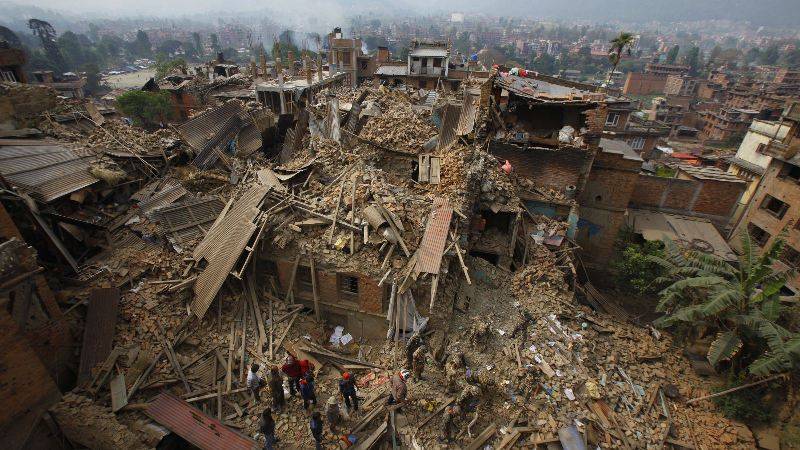
A devastating earthquake struck Nepal on April 25th, 2015. The humanitarian drone response to the earthquake was almost entirely foreign-led, top-down and techno-centric. International drone teams self-deployed and largely ignored the humanitarian drone code of conduct. Many had never heard of humanitarian principles and most had no prior experience in disaster response. Some were arrested by local authorities. At best, these foreign drone teams had little to no impact. At worse, they violated the principle of Do No Harm. Nepal Flying Labs was co-created five months after the earthquake, on September 25th, 2015, to localize the responsible and effective use of drones for positive social impact. Today, Flying Labs are operational in 25 countries across Asia, Africa and Latin America.

This month, on behalf of the World Food Program (WFP), WeRobotics teamed up with Nepal Flying Labs and WFP Nepal to run a 5-day hands-on training and disaster simulation to improve the rapid deployment and coordination of drones in humanitarian action. WeRobotics previously designed and ran similar humanitarian drone trainings and simulations on behalf of WFP (and others) in the Dominican Republic, Peru, Myanmar, Malawi and Mozambique, for example. In fact, WeRobotics has been running humanitarian drone trainings since 2015 both in-person and online.

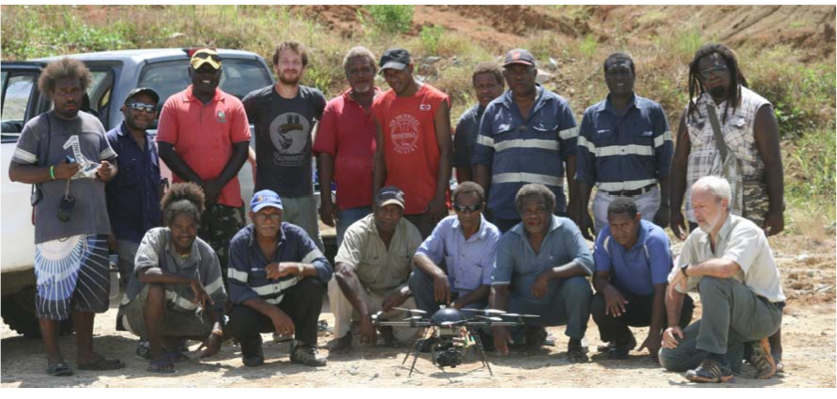
All 25 Flying Labs typically run their trainings in local languages. As such, the 5-day training in Nepal was largely led by Nepal Flying Labs and run in Nepali. Over 40 participants from 16 Nepali organizations took the training, which included an introduction to drone technologies,  drone photogrammetry, imagery processing, lessons learned and best practices from past humanitarian drone missions, and overviews of codes of conduct, data protection protocols and coordination mechanisms, all drawn from direct operational experience. The training also comprised a series of excellent talks given by Nepali experts who are already engaged in the use of drones in disaster management and other sectors in Nepal. This featured important talks by several officials from the Civil Aviation Authority of Nepal (CAAN). In addition, the training included a co-creation session using design thinking methods during which local experts identified the most promising humanitarian applications of drone technology in Nepal.

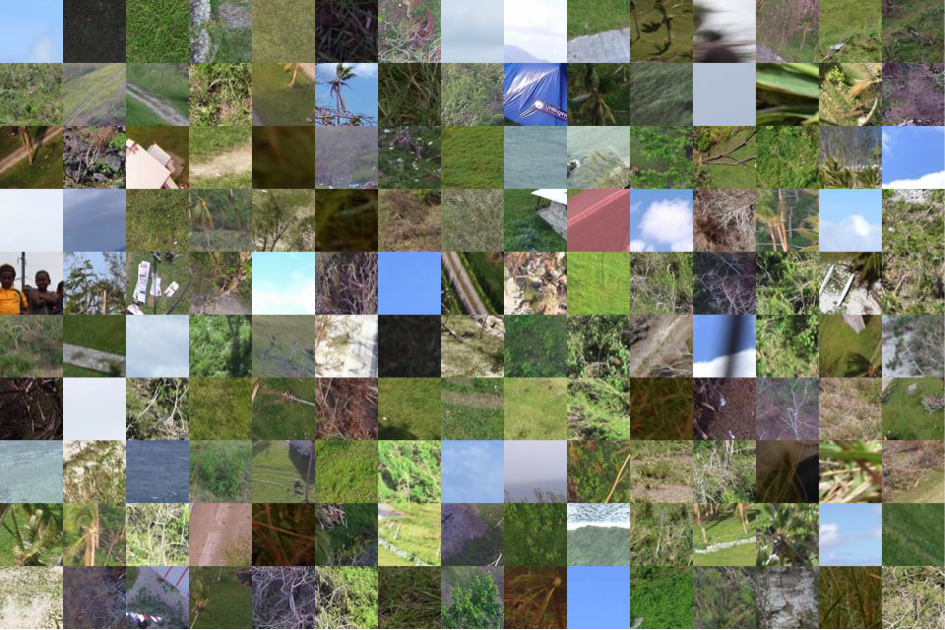
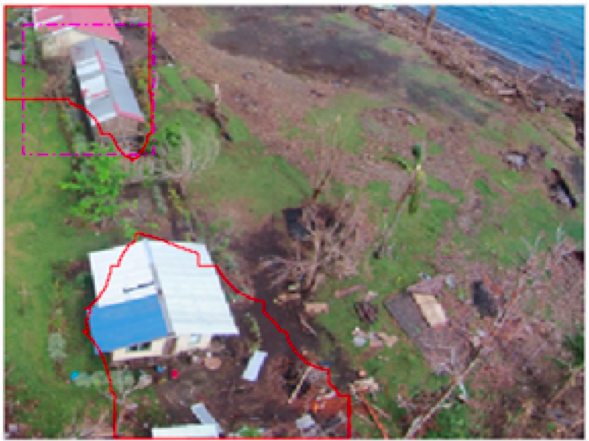
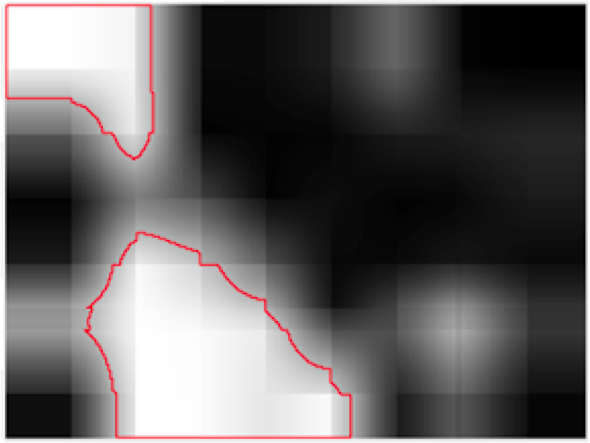
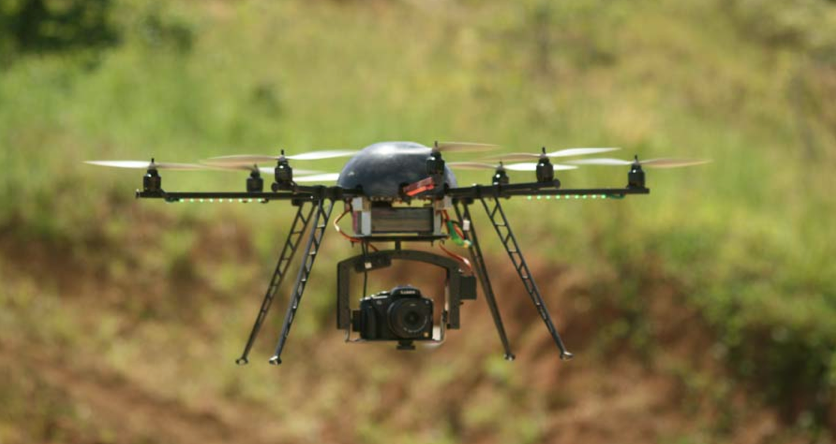
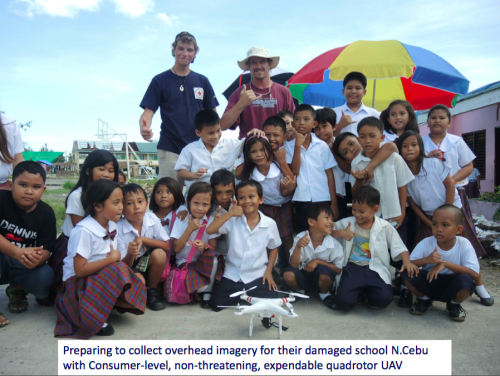
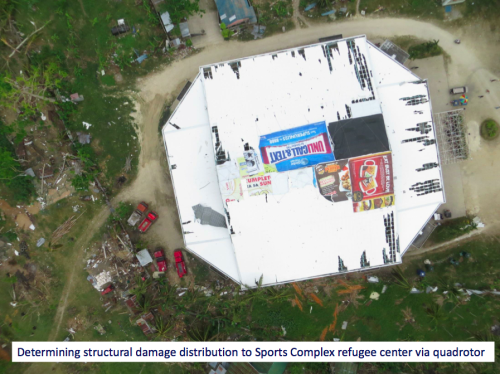
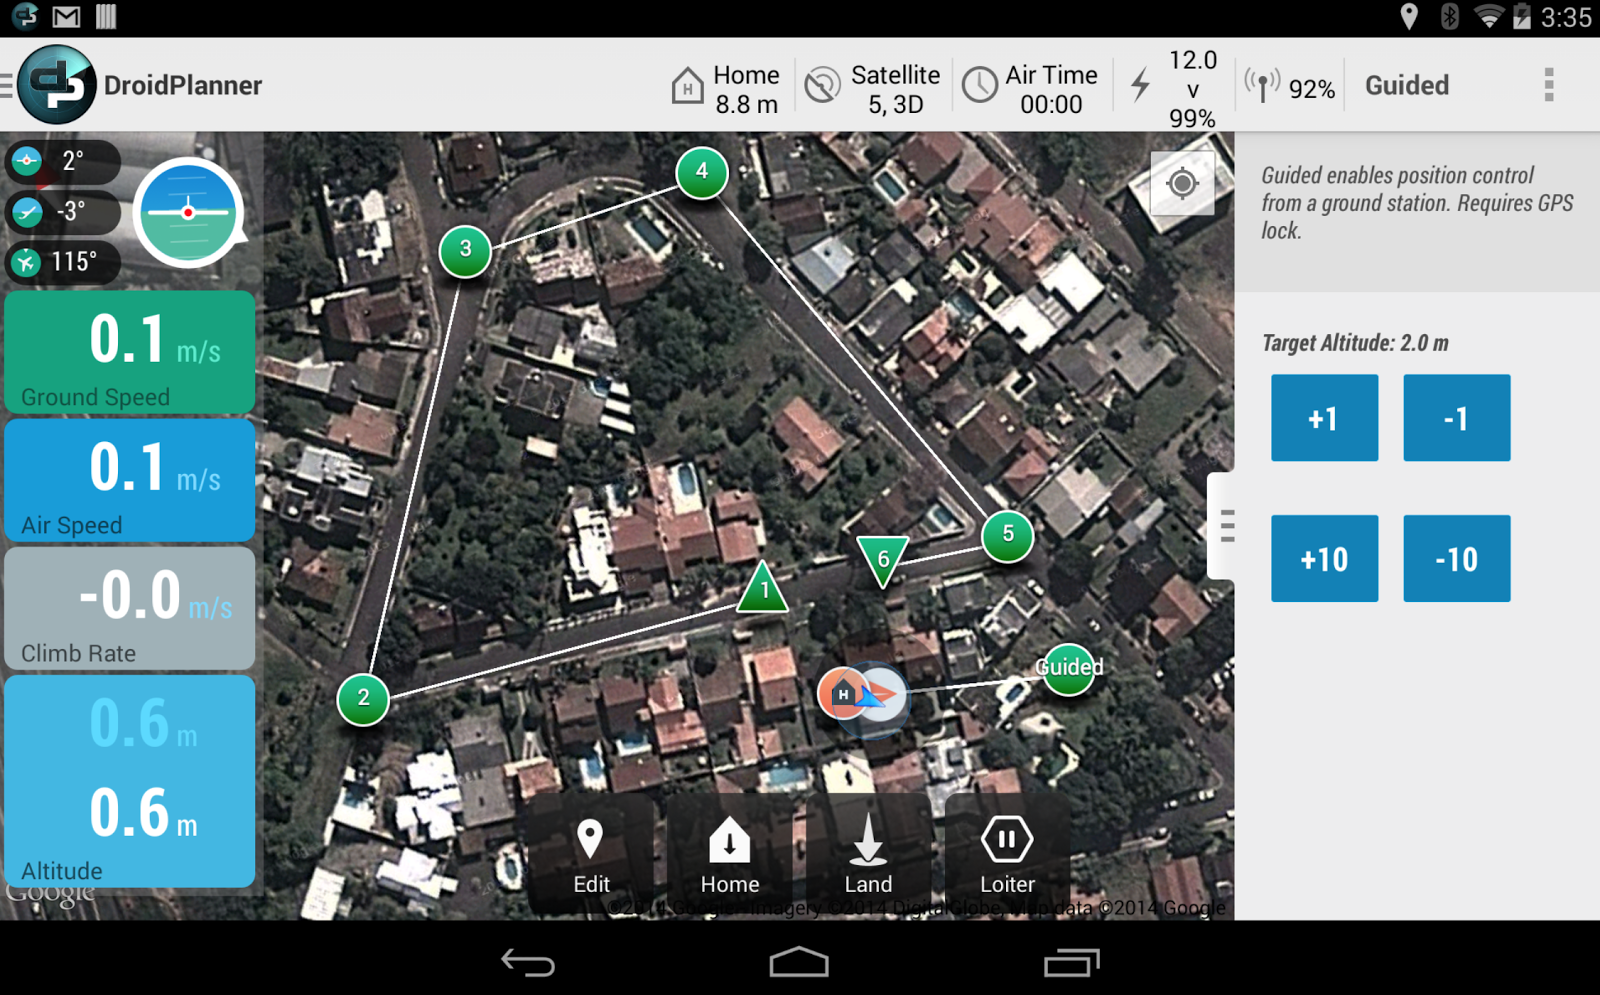
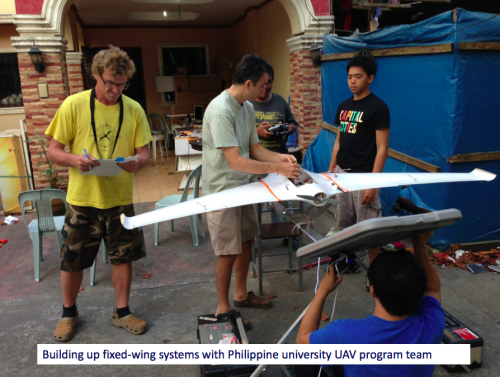
Nepal Flying Labs also trained participants on how to fly drones and program drone flights. The drones were rented locally from the Flying Labs and their partners. This hands-on session, kindly hosted by Kathmandu University, was followed by another hands-on session on how to process and analyze aerial imagery. In this session, Nepal Flying Labs introduced participants to Pix4Dreact and Picterra. Pix4Dreact provides an ultra-rapid solution to data processing, allowing humanitarian drone teams to process 1,000 high-resolution aerial images in literally minutes, which is invaluable as this used to take hours. Picterra enables drone teams to quickly analyze aerial imagery by automatically identifying features of interest to disaster responders such as damaged buildings, for example. While Picterra uses deep learning and transfer learning to automate feature detection, users don’t need any background or prior experience in artificial intelligence to make full use of the platform. During the hands on-session, trainers used Picterra to automatically detect buildings in aerial (orthophoto) map of an earthquake-affected area.

After completing a full day of hands-on training, Nepal Flying Labs gave a briefing on the disaster simulation scheduled for the following day. The simulation is the centerpiece of the humanitarian drone trainings run by WeRobotics and Flying Labs. It requires participants to put into practice everything they’ve learned in the training. The simulation consolidates their learning and provides them with important insights on how to streamline their coordination efforts. It is often said that disaster responders train the way they respond and respond they way they train. This is why simulations are absolutely essential.

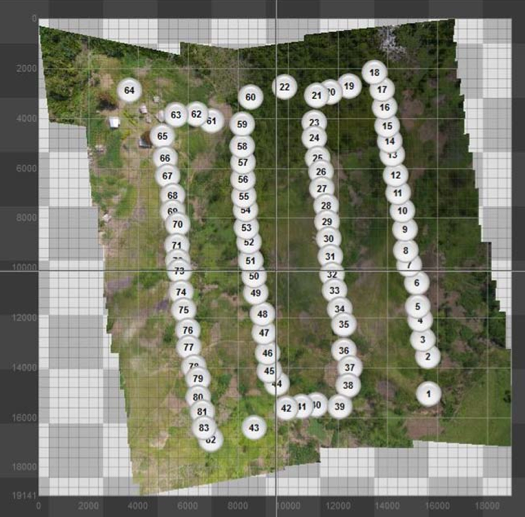
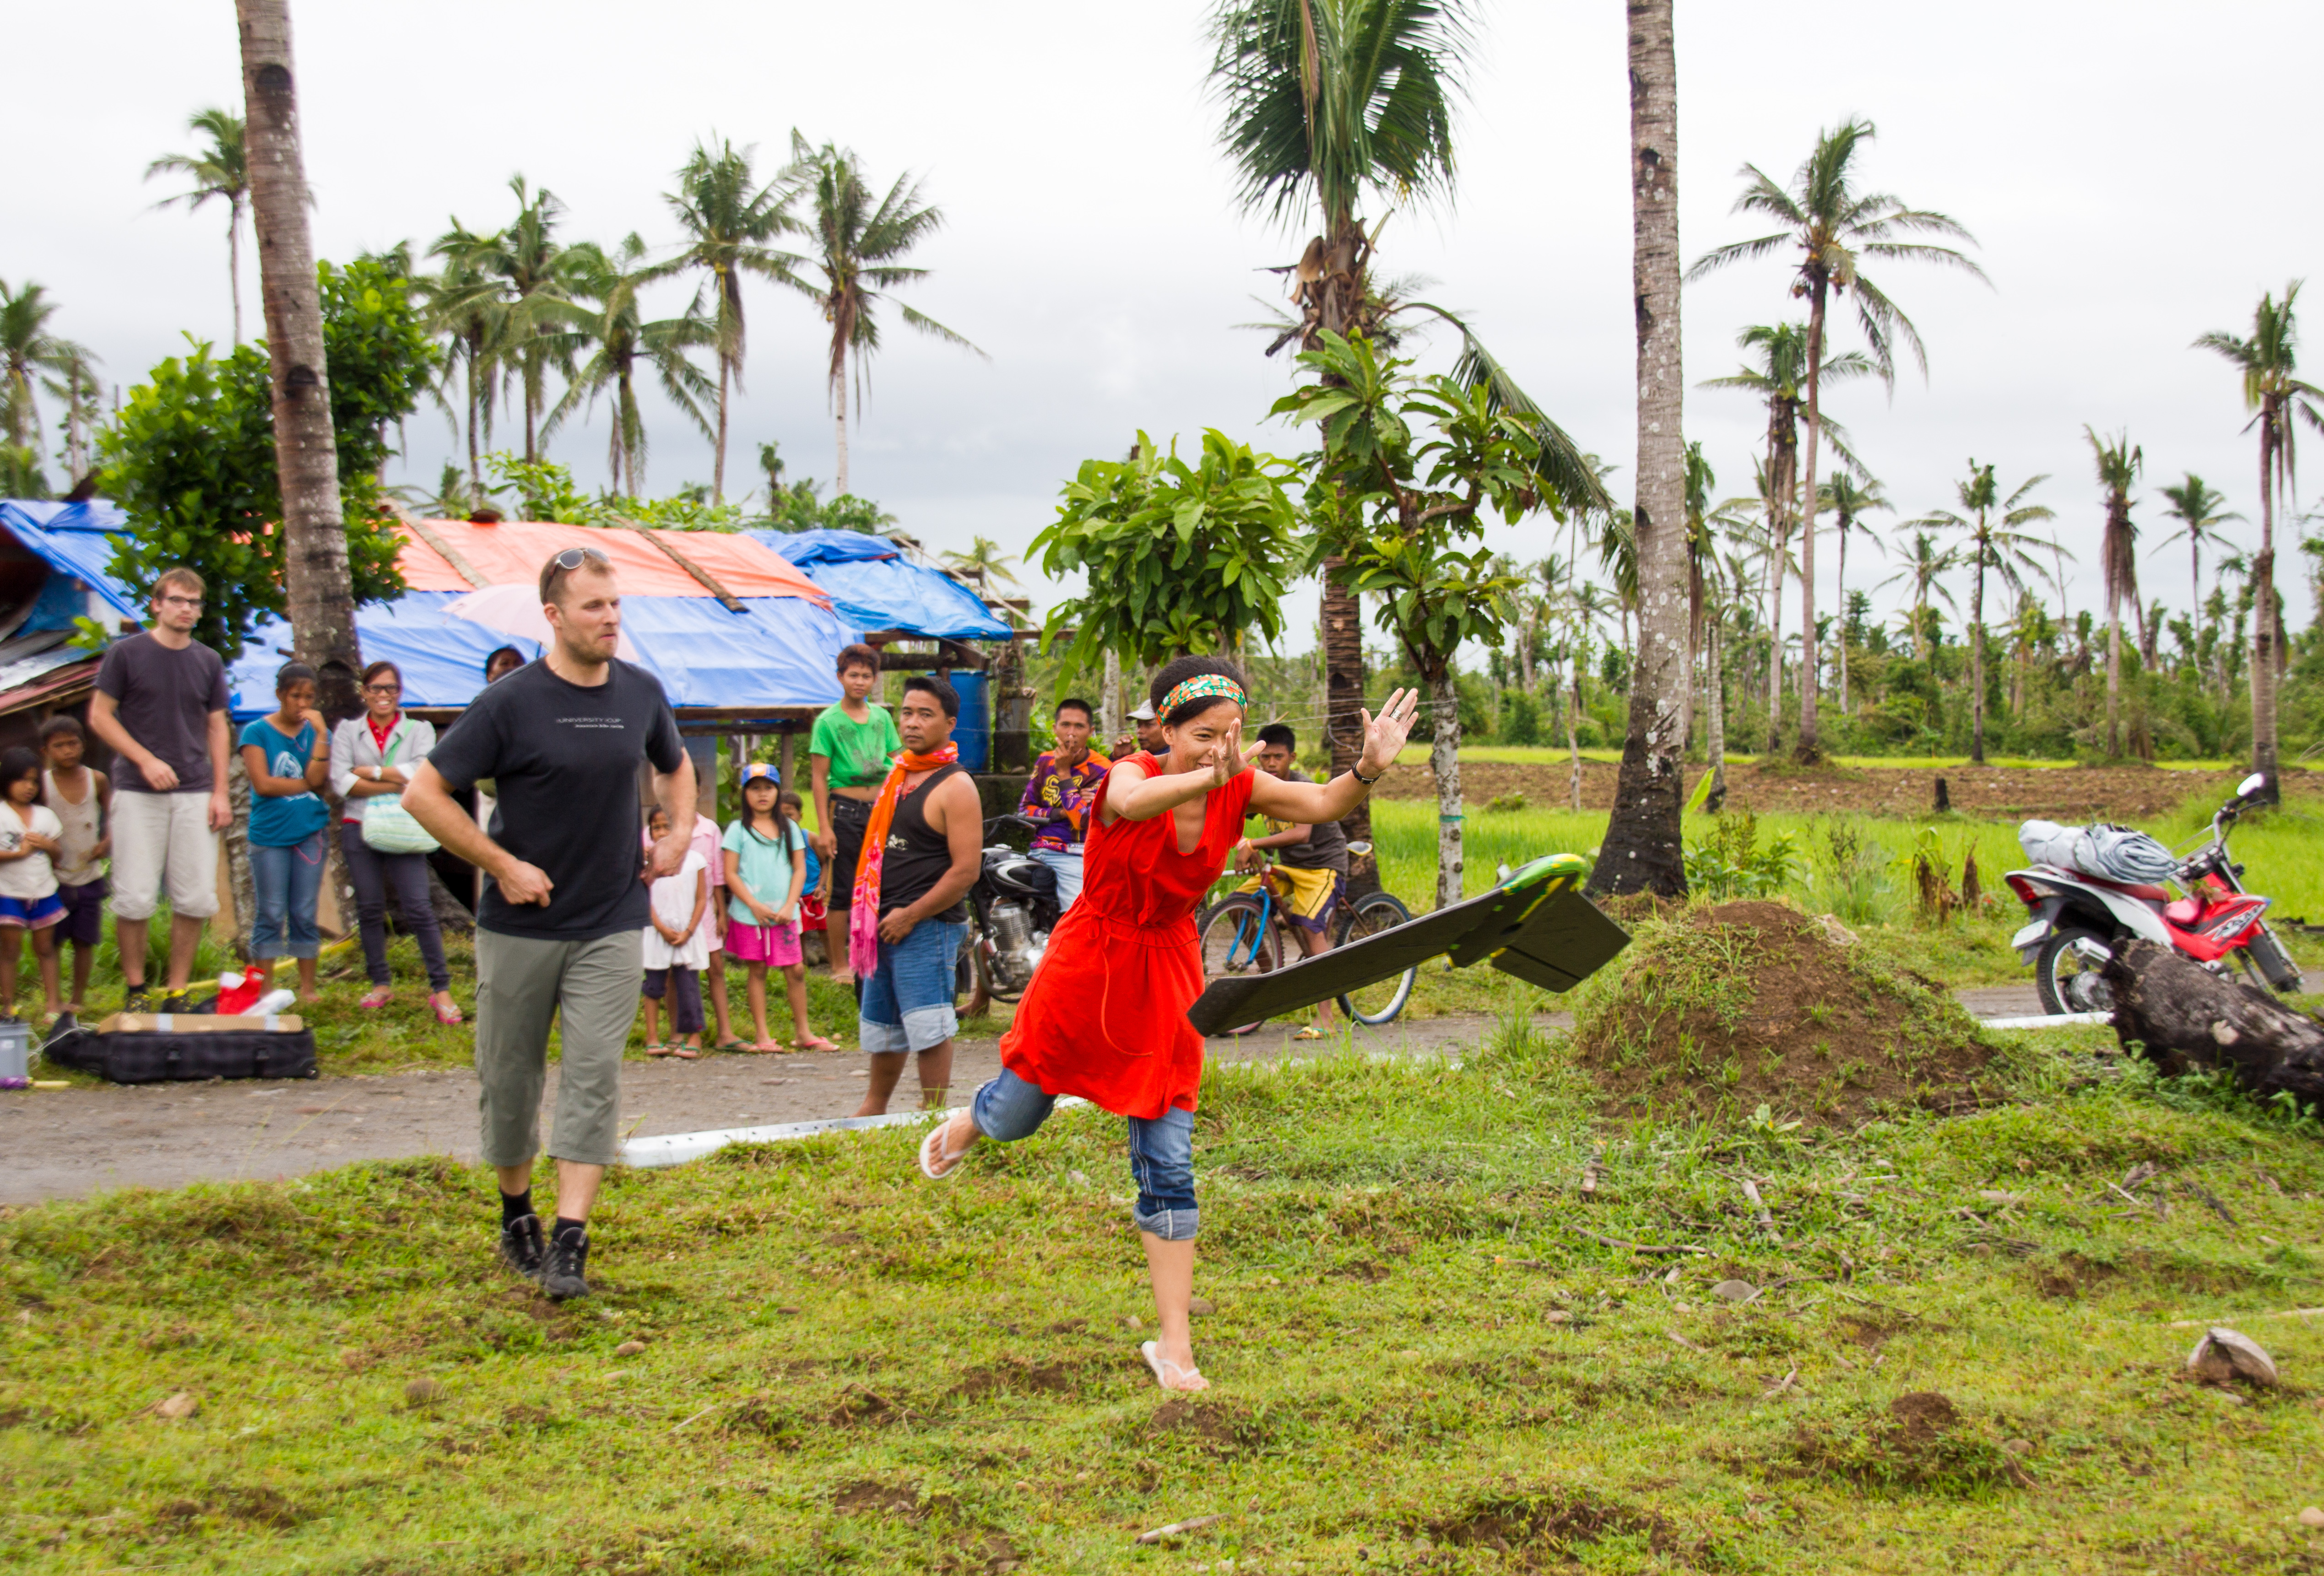
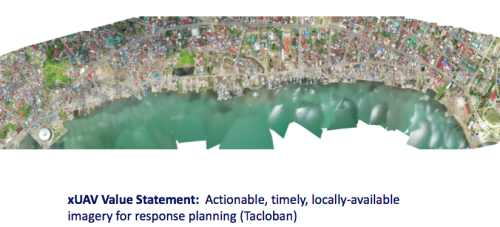
The simulation was held at Bhumlu Rural Municipality, a 3+ hour drive from Kathmandu. Bhumlu is highly prone to flooding and landslides, which is why it was selected for the simulation and why the Government of Nepal was particularly keen to get high-resolution maps of the area. The disaster simulation was run by Nepal Flying Labs in Nepali. The simulation, first designed by WeRobotics in 2015, consists of three teams (Authorities, Pilots and Analysts) who must work together to identify and physically retrieve colored markers as quickly and safely as possible. The markers, which were placed across Bhumlu prior to participants’ arrival, are typically 1 meter by 1 meter in size, and each color represents an indicator of interest to humanitarians, e.g., Yellow = survivor; Blue = landslide; and Red = disaster damage. Both the colors and the number of different markers are customized based on the local priorities. Below, Nepal Flying Labs Coordinator Uttam Pudasaini hides a yellow marker under a tree prior to the arrival of participants.

Myanmar has held the record for the fastest completion of the simulation since 2017. As such, they’ve held the number one spot and been the gold standard for two years now. The teams in Myanmar, who were trained by WeRobotics, retrieved all markers in just over 4 hours. As such, WeRobotics challenged the teams in Nepal to beat that record and take over the number one spot. They duly obliged and retrieved all markers in a very impressive time of 3 hours and 4 minutes, clenching the number one spot from Myanmar.

On the following and final day of the workshop, Nepal Flying Labs and WeRobotics facilitated an all-hands session to debrief on the simulation, inviting each team and trainee to reflect on lessons learned and share their insights. For example, a feedback loop between the Pilots and Analysis Teams is important so pilots can plan further flights based on the maps produced by the analysts. Like a number of previous simulations run by WeRobotics, the Analysis Team noted that having a portal printer on hand would be ideal. The Pilots Team also suggested that having different colored visibility vests would’ve enabled more rapid field coordination between and within teams by enabling individuals to more quickly identify who is who.

When asked which individuals or group had the most challenging job in the simulation, the consensus was the retrieval group who are part of the Authorities Team and responsible for retrieving the markers after they’ve been geo-located by the Analysis Team. This was particularly interesting given that in all previous simulations run by WeRobotics, the consensus had always been that the Analysis Team had the hardest task. In coming weeks, these insights together with the many others gained from the simulation in Nepal will be added to this document on best practices in humanitarian drone missions.

After the full simulation debrief, Nepal Flying Labs facilitated the final session of the training: a panel discussion on the development of drone regulations to save lives and reduce suffering in Nepal. The panelists included senior officials from Civil Aviation, Home Ministry and Nepal Police. The session was run in Nepali and presented participants with an excellent opportunity to engage with and inform key policymakers. In preparation for this session, Nepal Flying Labs and partners prepared this 3-page policy document (PDF) with priority questions and recommendations, which served as the basis for the Q&A with the panel. This discussion and policy document created a roadmap for next steps which Nepal Flying Labs and partners have pledged to take forward with all stakeholders.


Acknowledgements: WeRobotics and Nepal Flying Labs would like to sincerely thank WFP HQ and WPF Nepal for the kind invitation to run this training and for providing the superb coordination and logistics that made this training so fruitful. WeRobotics and Nepal Flying Labs would also like to express sincere thanks to DroNepal for co-leading the training with Nepal Flying Labs. Sincere thanks to the local communities we worked with during the simulation and to the CAA and local police for granting flight permissions. To all 40+ participants, sincerest thanks for all the energy you brought to the training and for your high levels of engagement throughout each of the 5 days, which significantly enriched the training. Last but certainly not least, sincere thanks to the Belgium Government for funding this training.

Increasing the Reliability of Aerial Imagery Analysis for Damage Assessments

In March 2015, I was invited by the World Bank to spearhead an ambitious humanitarian aerial robotics (UAV) mission to Vanuatu following Cyclone Pam, a devastating Category 5 Cyclone. This mission was coordinated with Heliwest and X-Craft, two outstanding UAV companies who were identified through the Humanitarian UAV Network (UAViators) Roster of Pilots. You can learn more about the mission and see pictures here. Lessons learned from this mission (and many others) are available here.

Screen Shot 2016-02-22 at 6.12.21 PM

The World Bank and partners were unable to immediately analyze the aerial imagery we had collected because they faced a Big Data challenge. So I suggested the Bank activate the Digital Humanitarian Network (DHN) to request digital volunteer assistance. As a result, Humanitarian OpenStreetMap (HOT) analyzed some of the orthorectified mosaics and MicroMappers focused on analyzing the oblique images (more on both here).

This in turn produced a number of challenges. To cite just one, the Bank needed digital humanitarians to identify which houses or buildings were completely destroyed, versus partially damaged versus largely intact. But there was little guidance on how to determine what constituted fully destroyed versus partially damaged or what such structures in Vanuatu look like when damaged by a Cyclone. As a result, data quality was not as high as it could have been. In my capacity as consultant for the World Bank’s UAVs for Resilience Program, I decided to do something about this lack of guidelines for imagery interpretation.

I turned to my colleagues at the Harvard Humanitarian Initiative (where I had previously co-founded and co-directed the HHI Program on Crisis Mapping) and invited them to develop a rigorous guide that could inform the consistent interpretation of aerial imagery of disaster damage in Vanuatu (and nearby Island States). Note that Vanuatu is number one on the World Bank’s Risk Index of most disaster-prone countries. The imagery analysis guide has just published (PDF) by the Signal Program on Human Security and Technology at HHI.

Big thanks to the HHI team for having worked on this guide and for my Bank colleagues and other reviewers for their detailed feedback on earlier drafts. The guide is another important step towards improving data quality for satellite and aerial imagery analysis in the context of damage assessments. Better data quality is also important for the use of Artificial Intelligence (AI) and computer vision as explained here. If a humanitarian UAV mission does happen in response to the recent disaster in Fiji, then the guide may also be of assistance there depending on how similar the building materials and architecture is. For now, many thanks to HHI for having produced this imagery guide.

Using Computer Vision to Analyze Aerial Big Data from UAVs During Disasters

Recent scientific research has shown that aerial imagery captured during a single 20-minute UAV flight can take more than half-a-day to analyze. We flew several dozen flights during the World Bank’s humanitarian UAV mission in response to Cyclone Pam earlier this year. The imagery we captured would’ve taken a single expert analyst a minimum 20 full-time workdays to make sense of. In other words, aerial imagery is already a Big Data problem. So my team and I are using human computing (crowdsourcing), machine computing (artificial intelligence) and computer vision to make sense of this new Big Data source.

For example, we recently teamed up with the University of Southampton and EPFL to analyze aerial imagery of the devastation caused by Cyclone Pam in Vanuatu. The purpose of this research is to generate timely answers. Aid groups want more than high-resolution aerial images of disaster-affected areas, they want answers; answers like the number and location of damaged buildings, the number and location of displaced peoples, and which roads are still useable for the delivery of aid, for example. Simply handing over the imagery is not good enough. As demonstrated in my new book, Digital Humanitarians, both aid and development organizations are already overwhelmed by the vast volume and velocity of Big Data generated during and post-disasters. Adding yet another source, Big Aerial Data, may be pointless since these organizations may simply not have the time or capacity to make sense of this new data let alone integrate the results with their other datasets.

We therefore analyzed the crowdsourced results from the deployment of our MicroMappers platform following Cyclone Pam to determine whether those results could be used to train algorithms to automatically detect disaster damage in future disasters in Vanuatu. During this MicroMappers deployment, digital volunteers analyzed over 3,000 high-resolution oblique aerial images, tracing houses that were fully destroyed, partially damaged and largely intact. My colleague Ferda Ofli and I teamed up with Nicolas Rey (a graduate student from EPFL who interned with us over the summer) to explore whether these traces could be used to train our algorithms. The results below were written with Ferda and Nicolas. Our research is not just an academic exercise. Vanuatu is the most disaster-prone country in the world. What’s more, this year’s El Niño is expected to be one of the strongest in half-a-century.

Screen Shot 2015-10-11 at 6.11.04 PM

According to the crowdsourced results, 1,145 of the high-resolution images did not contain any buildings. Above is a simple histogram depicting the number of buildings per image. The aerial images of Vanuatu are very heterogeneous, and vary not only in diversity of features they exhibit but also in the angle of view and the altitude at which the pictures were taken. While the vast majority of the images are oblique, some are almost nadir images, and some were taken very close to the ground or even before take off.

Screen Shot 2015-10-11 at 6.45.15 PM

The heterogeneity of our dataset of images makes the automated analysis of this imagery a lot more difficult. Furthermore, buildings that are under construction, of which there are many in our dataset, represent a major difficulty because they look very similar to damaged buildings. Our first task thus focused on training our algorithms to determine whether or not any given aerial image shows some kind of building. This is an important task given that more than ~30% of the images in our dataset do not contain buildings. As such, if we can develop an accurate algorithm to automatically filter out these irrelevant images (like the “noise” below), this will allows us focus the crowdsourced analysis of relevant images only.

Vanuatu3

While our results are purely preliminary, we are still pleased with our findings thus far. We’ve been able to train our algorithms to determine whether or not an aerial image includes a building with just over 90% accuracy at the tile level. More specifically, our algorithms were able to recognize and filter out 60% of the images that do not contain any buildings (recall rate), and only 10% of the images that contain buildings were mistakingly discarded (precision rate of 90%). The example below is an example. There are still quite a number of major challenges, however, so we want to be sure not to over-promise anything at this stage. In terms of next steps, we would like to explore whether our computer vision algorithms can distinguish between destroyed an intact buildings.

Screen Shot 2015-10-11 at 6.57.05 PMScreen Shot 2015-10-11 at 6.57.15 PM

The UAVs we were flying in Vanuatu required that we landed them in order to get access to the collected imagery. Increasingly, newer UAVs offer the option of broadcasting the aerial images and videos back to base in real time. DJI’s new Phantom 3 UAV (pictured below), for example, allows you to broadcast your live aerial video feed directly to YouTube (assuming you have connectivity). There’s absolutely no doubt that this is where the UAV industry is headed; towards real-time data collection and analysis. In terms of humanitarian applications, and search and rescue, having the data-analysis carried out in real-time is preferable.

WP27

This explains why my team and I recently teamed up with Elliot Salisbury & Sarvapali Ramchurn from the University of Southampton to crowdsource the analysis of live aerial video footage of disaster zones and to combine this crowdsourcing with (hopefully) near real-time machine learning and automated feature detection. In other words, as digital volunteers are busy tagging disaster damage in video footage, we want our algorithms to learn from these volunteers in real-time. That is, we’d like the algorithms to learn what disaster damage looks like so they can automatically identify any remaining disaster damage in a given aerial video.

So we recently carried out a MicroMappers test-deployment using aerial videos from the humanitarian UAV mission to Vanuatu. Close to 100 digital volunteers participated in this deployment. Their task? To click on any parts of the videos that show disaster damage. And whenever 80% or more of these volunteers clicked on the same areas, we would automatically highlight these areas to provide near-real time feedback to the UAV pilot and humanitarian teams.

At one point during the simulations, we had some 30 digital volunteers clicking on areal videos at the same time, resulting in an average of 12 clicks per second for more than 5 minutes. In fact, we collectively clicked on the videos a total of 49,706 times! This provided more than enough real-time data for MicroMappers to act as a human-intelligence sensor for disaster damage assessments. In terms of accuracy, we had about 87% accuracy with the collective clicks. Here’s how the simulations looked like to the UAV pilots as we were all clicking away:

Thanks to all this clicking, we can export only the most important and relevant parts of the video footage while the UAV is still flying. These snippets, such as this one and this one, can then be pushed to MicroMappers for additional verification. These animations are small and quick, and reduce a long aerial video down to just the most important footage. We’re now analyzing the areas that were tagged in order to determine whether we can use this data to train our algorithms accordingly. Again, this is far more than just an academic curiosity. If we can develop robust algorithms during the next few months, we’ll be ready to use them effectively during the next Typhoon season in the Pacific.

In closing, big thanks to my team at QCRI for translating my vision of Micro-Mappers into reality and for trusting me well over a year ago when I said we needed to extend our work to aerial imagery. All of the above research would simply not have been possible without MicroMappers existing. Big thanks as well to our excellent partners at EPFL and Southampton for sharing our vision and for their hard work on our joint projects. Last but certainly not least, sincerest thanks to digital volunteers from SBTF and beyond for participating in these digital humanitarian deployments.

A Force for Good: How Digital Jedis are Responding to the Nepal Earthquake (Updated)

Digital Humanitarians are responding in full force to the devastating earthquake that struck Nepal. Information sharing and coordination is taking place online via CrisisMappers and on multiple dedicated Skype chats. The Standby Task Force (SBTF), Humanitarian OpenStreetMap (HOT) and others from the Digital Humanitarian Network (DHN) have also deployed in response to the tragedy. This blog post provides a quick summary of some of these digital humanitarian efforts along with what’s coming in terms of new deployments.

Update: A list of Crisis Maps for Nepal is available below.

Credit: http://www.thestar.com/content/dam/thestar/uploads/2015/4/26/nepal2.jpg

At the request of the UN Office for the Coordination of Humanitarian Affairs (OCHA), the SBTF is using QCRI’s MicroMappers platform to crowdsource the analysis of tweets and mainstream media (the latter via GDELT) to rapidly 1) assess disaster damage & needs; and 2) Identify where humanitarian groups are deploying (3W’s). The MicroMappers CrisisMaps are already live and publicly available below (simply click on the maps to open live version). Both Crisis Maps are being updated hourly (at times every 15 minutes). Note that MicroMappers also uses both crowdsourcing and Artificial Intelligence (AIDR).

Update: More than 1,200 Digital Jedis have used MicroMappers to sift through a staggering 35,000 images and 7,000 tweets! This has so far resulted in 300+ relevant pictures of disaster damage displayed on the Image Crisis Map and over 100 relevant disaster tweets on the Tweet Crisis Map.

Live CrisisMap of pictures from both Twitter and Mainstream Media showing disaster damage:

MM Nepal Earthquake ImageMap

Live CrisisMap of Urgent Needs, Damage and Response Efforts posted on Twitter:

MM Nepal Earthquake TweetMap

Note: the outstanding Kathmandu Living Labs (KLL) team have also launched an Ushahidi Crisis Map in collaboration with the Nepal Red Cross. We’ve already invited invited KLL to take all of the MicroMappers data and add it to their crisis map. Supporting local efforts is absolutely key.

WP_aerial_image_nepal

The Humanitarian UAV Network (UAViators) has also been activated to identify, mobilize and coordinate UAV assets & teams. Several professional UAV teams are already on their way to Kathmandu. The UAV pilots will be producing high resolution nadir imagery, oblique imagery and 3D point clouds. UAViators will be pushing this imagery to both HOT and MicroMappers for rapid crowdsourced analysis (just like was done with the aerial imagery from Vanuatu post Cyclone Pam, more on that here). A leading UAV manufacturer is also donating several UAVs to UAViators for use in Nepal. These UAVs will be sent to KLL to support their efforts. In the meantime, DigitalGlobePlanet Labs and SkyBox are each sharing their satellite imagery with CrisisMappers, HOT and others in the Digital Humanitarian Network.

There are several other efforts going on, so the above is certainly not a complete list but simply reflect those digital humanitarian efforts that I am involved in or most familiar with. If you know of other major efforts, then please feel free to post them in the comments section. Thank you. More on the state of the art in digital humanitarian action in my new book, Digital Humanitarians.


List of Nepal Crisis Maps

Please add to the list below by posting new links in this Google Spreadsheet. Also, someone should really create 1 map that pulls from each of the listed maps.

Code for Nepal Casualty Crisis Map:
http://bit.ly/1IpUi1f 

DigitalGlobe Crowdsourced Damage Assessment Map:
http://goo.gl/bGyHTC

Disaster OpenRouteService Map for Nepal:
http://www.openrouteservice.org/disaster-nepal

ESRI Damage Assessment Map:
http://arcg.is/1HVNNEm

Harvard WorldMap Tweets of Nepal:
http://worldmap.harvard.edu/maps/nepalquake 

Humanitarian OpenStreetMap Nepal:
http://www.openstreetmap.org/relation/184633

Kathmandu Living Labs Crowdsourced Crisis Map: http://www.kathmandulivinglabs.org/earthquake

MicroMappers Disaster Image Map of Damage:
http://maps.micromappers.org/2015/nepal/images/#close

MicroMappers Disaster Damage Tweet Map of Needs:
http://maps.micromappers.org/2015/nepal/tweets

NepalQuake Status Map:
http://www.nepalquake.org/status-map

UAViators Crisis Map of Damage from Aerial Pics/Vids:
http://uaviators.org/map (takes a while to load)

Visions SDSU Tweet Crisis Map of Nepal:
http://vision.sdsu.edu/ec2/geoviewer/nepal-kathmandu#

Low-Cost UAV Applications for Post-Disaster Assessments: A Streamlined Workflow

Colleagues Matthew Cua, Charles Devaney and others recently co-authored this excellent study on their latest use of low-cost UAVs/drones for post-disaster assessments, environmental development and infrastructure development. They describe the “streamlined workflow—flight planning and data acquisition, post-processing, data delivery and collaborative sharing,” that they created “to deliver acquired images and orthorectified maps to various stakeholders within [their] consortium” of partners in the Philippines. They conclude from direct hands-on experience that “the combination of aerial surveys, ground observations and collaborative sharing with domain experts results in richer information content and a more effective decision support system.”

Screen Shot 2014-10-03 at 11.26.12 AM

UAVs have become “an effective tool for targeted remote sensing operations in areas that are inaccessible to conventional manned aerial platforms due to logistic and human constraints.” As such, “The rapid development of unmanned aerial vehicle (UAV) technology has enabled greater use of UAVs as remote sensing platforms to complement satellite and manned aerial remote sensing systems.” The figure above (click to enlarge) depicts the aerial imaging workflow developed by the co-authors to generate and disseminate post-processed images. This workflow, the main components of which are “Flight Planning & Data Acquisition,” “Data Post-Processing” and “Data Delivery,” will “continuously be updated, with the goal of automating more activities in order to increase processing speed, reduce cost and minimize human error.”

Screen Shot 2014-10-03 at 11.27.02 AM

Flight Planning simply means developing a flight plan based on clearly defined data needs. The screenshot above (click to enlarge) is a “UAV flight plan of the coastal section of Tacloban city, Leyte generated using APM Mission Planner. The [flight] plan involved flying a small UAV 200 meters above ground level. The raster scan pattern indicated by the yellow line was designed to take images with 80% overlap & 75% side overlap. The waypoints indicating a change in direction of the UAV are shown as green markers.” The purpose of the overlapping is to stitch and accurately geo-referenced the images during post-processing. A video on how to program UAV flight is available here.  This video specifically focuses on post-disaster assessments in the Philippines.

“Once in the field, the team verifies the flight plans before the UAV is flown by performing a pre-flight survey [which] may be done through ground observations of the area, use of local knowledge or short range aerial observations with a rotary UAV to identify launch/recovery sites and terrain characteristics. This may lead to adjustment in the flight plans. After the flight plans have been verified, the UAV is deployed for data acquisition.”

Screen Shot 2014-10-03 at 11.27.33 AM

Matthew, Charles and team initially used a Micropilot MP-Vision UAV for data acquisition. “However, due to increased cost of maintenance and significant skill requirements of setting up the MP-Vision,” they developed their own custom UAV instead, which “uses semi-professional and hobby- grade components combined with open-source software” as depicted in the above figure (click to enlarge). “The UAV’s airframe is the Super SkySurfer fixed-wing EPO foam frame.” The team used the “ArduPilot Mega (APM) autopilot system consisting of an Arduino-based microprocessor board, airspeed sensor, pressure and tem-perature sensor, GPS module, triple-axis gyro and other sensors. The firmware for navigation and control is open-source.”

The custom UAV, which costs approximately $2,000, has “an endurance of about 30-50 minutes, depending on payload weight and wind conditions, and is able to survey an area of up to 4 square kilometers.” The custom platform was “easier to assemble, repair, maintain, modify & use. This allowed faster deploy-ability of the UAV. In addition, since the autopilot firmware is open-source, with a large community of developers supporting it, it became easier to identify and address issues and obtain software updates.” That said, the custom UAV was “more prone to hardware and software errors, either due to assembly of parts, wiring of electronics or bugs in the software code.” Despite these drawbacks, “use of the custom UAV turned out to be more feasible and cost effective than use of a commercial-grade UAV.”

In terms of payloads (cameras), three different kinds were used: Panasonic Lumix LX3, Canon S100, and GoPro Hero 3. These cameras come with both advantages and disadvantages for aerial mapping. The LX3 has better image quality but the servo triggering the shutter would often fail. The S100 is GPS-enabled and does not require mechanical triggering. The Hero-3 was used for video reconnaissance specifically.

Screen Shot 2014-10-04 at 5.31.47 AM

“The workflow at [the Data-Processing] stage focuses on the creation of an orthomosaic—an orthorectified, georeferenced and stitched map derived from aerial images and GPS and IMU (inertial measurement unit values, particularly yaw, pitch and roll) information.” In other words, “orthorectification is the process of stretching the image to match the spatial accuracy of a map by considering location, elevation, and sensor information.”

Transforming aerial images into orthomosaics involves: (1) manually removing take-off/landing, burry & oblique images; (2) applying contrast enhancement to images that are either over- or under-exposed using commercial image-editing software; (3) geo-referencing the resulting images; (4) creating an orthomosaic from the geo-tagged images. The geo-referencing step is not needed if the images are already geo-referenced (i.e., have GPS coordinates, like those taken with the Cannon S100. “For non-georeferenced images, georeferencing is done by a custom Python script that generates a CSV file containing the mapping between images and GPS/IMU information. In this case, the images are not embedded with GPS coordinates.” The sample orthomosaic above uses 785 images taken during two UAV flights (click to enlarge).

Matthew, Charles and team used the “Pix4Dmapper photomapping software developed by Pix4D to render their orthomosaics. “The program can use either geotagged or non-geotagged images. For non-geotagged images, the software accepts other inputs such as the CSV file generated by the custom Python script to georeference each image and generate the photomosaic. Pix4D also outputs a report containing information about the output, such as total area covered and ground resolution. Quantum GIS, an open-source GIS software, was used for annotating and viewing the photomosaics, which can sometimes be too large to be viewed using common photo viewing software.”

Screen Shot 2014-10-03 at 11.28.20 AM

Data Delivery involves uploading the orthomosaics to a common, web-based platform that stakeholders can access. Orthomosaics “generally have large file sizes (e.g around 300MB for a 2 sq. km. render),” so the team created a web-based geographic information systems (GIS) to facilitate sharing of aerial maps. “The platform, named VEDA, allows viewing of rendered maps and adding metadata. The key advantage of using this platform is that the aerial imagery data is located in one place & can be accessed from any computer with a modern Internet browser. Before orthomosaics can be uploaded to the VEDA platform, they need to be converted into an approprate format supported by the platform. The current format used is MBTiles developed by Mapbox. The MBTiles format specifies how to partition a map image into smaller image tiles for web access. Once uploaded, the orthomosaic map can then be annotated with additional information, such as markers for points of interest.” The screenshot above (click to enlarge) shows the layout of a rendered orthomosaic in VEDA.

Matthew, Charles and team have applied the above workflow in various mission-critical UAV projects in the Philippines including damage assessment work after Typhoon Haiyan in 2013. This also included assessing the impact of the Typhoon on agriculture, which was an ongoing concern for local government during the recovery efforts. “The coconut industry, in particular, which plays a vital role in the Philippine economy, was severely impacted due to millions of coconut trees being damaged or flattened after the storm hit. In order to get an accurate assessment of the damage wrought by the typhoon, and to make a decision on the scale of recovery assistance from national government, aerial imagery coupled with a ground survey is a potentially promising approach.”

So the team received permission from local government to fly several missions over areas in Eastern Visayas that [were] devoted to coconut stands prior to Typhoon Haiyan.” (As such, “The UAV field team operated mostly in rural areas and wilderness, which reduced the human risk factor in case of aircraft failure. Also, as a safety guideline, the UAV was not flown within 3 miles from an active airport”). The partners in the Philippines are developing image processing techniques to distinguish “coconut trees from wild forest and vegetation for land use assessment and carbon source and sink estimates. One technique involved use of superpixel classification, wherein the image pixels are divided into homogeneous regions (i.e. collection of similar pixels) called superpixels which serve as the basic unit for classification.”

Screen Shot 2014-10-03 at 11.29.07 AM

The image below shows the “results of the initial test run where areas containing coconut trees [above] have been segmented.”

Screen Shot 2014-10-03 at 11.29.23 AM

“Similar techniques could also be used for crop damage assessment after a disaster such as Typhoon Haiyan, where for example standing coconut trees could be distinguished from fallen ones in order to determine capacity to produce coconut-based products.” This is an area that my team and I at QCRI are exploring in partnership with Matthew, Charles and company. In particular, we’re interested in assessing whether crowdsourcing can be used to facilitate the development of machine learning classifiers for image feature detection. More on this herehere and on CNN here. In addition, since “aerial imagery augmented with ground observations would provide a richer source of informa-tion than either one could provide alone,” we are also exploring the integration of social media data with aerial imagery (as described here).

In conclusion, Matthew, Charles and team are looking to further develop the above framework by automating more processes, “such as image filtering and image contrast enhancement. Autonomous take-off & landing will be configured for the custom UAV in order to reduce the need for a skilled pilot. A catapult system will be created for the UAV to launch in areas with a small clearing and a parachute system will be added in order to reduce the risk of damage due to belly landings.” I very much look forward to following the team’s progress and to collaborating with them on imagery analysis for disaster response.

bio

See Also:

  • Official UN Policy Brief on Humanitarian UAVs [link]
  • Common Misconceptions About Humanitarian UAVs [link]
  • Humanitarians in the Sky: Using UAVs for Disaster Response [link]
  • Humanitarian UAVs Fly in China After Earthquake [link]
  • Humanitarian UAV Missions During Balkan Floods [link]
  • Humanitarian UAVs in the Solomon Islands [link]
  • UAVs, Community Mapping & Disaster Risk Reduction in Haiti [link]

Humanitarian UAVs in the Solomon Islands

The Solomon Islands experienced heavy rains and flash floods following Tropical Cyclone Ita earlier this year. Over 50,000 people were affected and dozens killed, according to ReliefWeb. Infrastructure damage was extensive; entire houses were washed away and thousands lost their food gardens.

solomonfloods

Disaster responders used a rotary-wing UAV (an “Oktocopter”) to assist with the damage assessment efforts. More specifically, the UAV was used to assess the extent of the flood damage in the most affected area along Mataniko River.

Solomons UAV

The UAV was also used to map an area proposed for resettlement. In addition, the UAV was flown over a dam to assess potential damage. These flights were pre-programmed and thus autonomous. (Here’s a quick video demo on how to program UAV flights for disaster response). The UAV was flown at 110 meters altitude in order to capture very high-resolution imagery. “The altitude of 110m also allowed for an operation below the traditional air space and ensured a continuous visibility of the UAV from the starting / landing position.”

Screen Shot 2014-09-25 at 4.04.49 AM

While responders faced several challenges with the UAV, they nevertheless stated that “The UAV was extremely useful for the required mapping” (PDF). Some of these challenges included the limited availability of batteries, which limited the number of UAV flights. The wind also posed a challenge.

Solomons Analysis

Responders took more than 800 pictures (during one 17 minute flight) over the above area which was proposed for resettlement. About 10% of these images were then stitched together to form the mosaic displayed above. The result below depicts flooded areas along Mataniko River. According to responders, “This image data can be utilized to demonstrate the danger of destruction to people who start to resettle in the Mataniko River Valley. These very high resolution images (~ 3 to 5 cm) show details such as destroyed cars, parts of houses, etc. which demonstrate the force of the high water.” In sum, “The maps together with the images of the river could be utilized to raise awareness not to settle again in these areas.”

Screen Shot 2014-09-25 at 4.14.33 AM

Images taken of the dam were used to create the Digital Terrain Model (DTM) below. This enables responders to determine areas where the dam is most likely to overflow due to damage or future floods.

Screen Shot 2014-09-25 at 4.15.40 AM

The result of this DTM analysis enables responders to target the placement of rubber mats fixed with sand bags around the damn’s most vulnerable points.

Solomons Dam

In conclusion, disaster responders write that the use of “UAVs for data acquisition can be highly recommended. The flexibility of an UAV can be of high benefit for mapping purposes, especially in cases where fast data acquisition is desired, e.g. natural hazards. An important advantage of a UAV as platform is that image data recording is performed at low height and not disturbed by cloud cover. In theory a fixed-wing UAV might be more efficient for rapid mapping. However, the DTM applications would not be possible in this resolution with a fixed wing UAV. Notably due to the flexibility for potential starting and landing areas and the handling of the topography characterized by step valleys and obstacles such as power lines between mountain tops within the study area. Especially within the flooded areas a spatially sufficient start and land area for fixed wing UAVs would have been hard to identify.”

Bio

See Also:

  • Official UN Policy Brief on Humanitarian UAVs [link]
  • Common Misconceptions About Humanitarian UAVs [link]
  • Humanitarians in the Sky: Using UAVs for Disaster Response [link]
  • Crisis Map of UAV Videos for Disaster Response [link]
  • Humanitarian UAV Missions During Balkan Floods [link]
  • UAVs, Community Mapping & Disaster Risk Reduction in Haiti [link]

Humanitarian UAVs Fly in China After Earthquake (updated)

A 6.1 magnitude earthquake struck Ludian County in Yunnan, China earlier this month. Some 600 people lost their lives; over 2,400 were injured and another 200,000 were forced to relocate. In terms of infrastructure damage, about 30,000 buildings were damaged and more than 12,000 homes collapsed. To rapidly search for survivors and assess this damage, responders in China turned to DJI’s office in Hong Kong. DJI is one of leading manufacturers of commercial UAVs in the world.

Rescuers search for survivors as they walk among debris of collapsed buildings after an earthquake hit Longtoushan township of Ludian county

DJI’s team of pilots worked directly with the China Association for Disaster and Emergency Response Medicine (CADERM). According to DJI, “This was the first time [the country] used [UAVs] in its relief efforts and as a result many of the cooperating agencies and bodies working on site have approached us for training / using UAS technology in the future […].” DJI flew two types of quadcopters, the DJI S900 and DJI Phantom 2 Vision+ pictured below (respectively):

DJI S900

Phantom 2

As mentioned here, The DJI Phantom 2 is the same one that the UN Office for the Coordination of Humanitarian Affairs (OCHA) is experimenting with:

Screen Shot 2014-06-24 at 2.22.05 PM

Given the dense rubble and vegetation in the disaster affected region of Ludian County in China, ground surveys were particularly challenging to carry out. So UAVs provided disaster responders with an unimpeded bird’s eye view of the damage, helping them prioritize their search and rescue efforts. DJI reports that the UAVs “were able to relay images back to rescue workers, who used them to determine which roads needed to be cleared first and which areas of the rubble to search for possible survivors. […].”

The video above shows some striking aerial footage of the disaster damage. This is the not first time that UAVs have been used for search and rescue or road clearance operations. Transporting urgent supplies to disaster areas requires that roads be cleared as quickly as possible, which is why UAVs were used for this and other purposes after Typhoon Haiyan in the Philippines. In Ludian, “Aerial images captured by the team were [also] used by workers in the epicenter area […] where most of the traditional buildings in the area collapsed.”

DJI was not the only group to fly UAVs in response to the quake in Yunnan. The Chinese government itself deployed UAVs (days before DJI). As the Associated Press reported several weeks ago already, “A novel part of the Yunnan response was the use of drones to map and monitor a quake-formed lake that threatened to flood areas downstream. China has rapidly developed drone use in recent years, and they helped save time and money while providing highly reliable data, said Xu Xiaokun, an engineer with the army reserves.”

Working with UAV manufacturers directly may prove to be the preferred route for humanitarian organizations requiring access to aerial imagery following major disasters. At the same time, having the capacity and skills in-house to rapidly deploy these UAVs affords several advantages over the partnership model. So combining in-house capacity with a partnership model may ultimately be the way to go but this will depend heavily on the individual mandates and needs of humanitarian organizations.

Bio

See Also:

  • Humanitarians in the Sky: Using UAVs for Disaster Response [link]
  • Live Crisis Map of UAV Videos for Disaster Response [link]
  • Humanitarian UAV Missions During Balkan Floods [link]
  • UAVs, Community Mapping & Disaster Risk Reduction in Haiti [link]
  • “TripAdvisor” for International UAV/Drone Travel [link]

Live: Crowdsourced Crisis Map of UAV/Aerial Photos & Videos for Disaster Response (Updated)

Update: Crisis Map now includes features to post photos in addition to videos!

The latest version of the Humanitarian UAV Network’s Crisis Map of UAV/aerial photos & videos is now live on the Network’s website. The crowdsourced map already features dozens of aerial videos of recent disasters. Now, users can also post aerial photographs areas. Like the use of social media for emergency management, this new medium—user-generated (aerial) content—can be used by humanitarian organizations to complement their damage assessments and thus improve situational awareness.

UAViators Map

The purpose of this Humanitarian UAV Network (UAViators) map is not only to provide humanitarian organizations and disaster-affected communities with an online repository of aerial information on disaster damage to augment their situational awareness; this crisis map also serves to raise awareness on how to safely & responsibly use small UAVs for rapid damage assessments. This explains why users who upload new content to the map must confirm that they have read the UAViator‘s Code of Conduct. They also have to confirm that the photos & videos conform to the Network’s mission and that they do not violate privacy or copyrights. In sum, the map seeks to crowdsource both aerial footage and critical thinking for the responsible use of UAVs in humanitarian settings.

UAViators Map 4

As noted above, this is the first version of the map, which means several other features are currently in the works. These new features will be rolled out incrementally over the next weeks and months. In the meantime, feel free to suggest any features you’d like to see in the comments section below. Thank you.

Bio

  • Humanitarian UAV Network: Strategy for 2014-2015 [link]
  • Humanitarians in the Sky: Using UAVs for Disaster Response [link]
  • Humanitarian UAV Missions During Balkan Floods [link]
  • Using UAVs for Disaster Risk Reduction in Haiti [link]
  • Using MicroMappers to Make Sense of UAV/Aerial Imagery During Disasters [link]

Humanitarians Using UAVs for Post Disaster Recovery

I recently connected with senseFly’s Adam Klaptocz who founded the non-profit group DroneAdventures to promote humanitarian uses of UAVs. I first came across Adam’s efforts last year when reading about his good work in Haiti, which demonstrated the unique role that UAV technology & imagery can play in post-disaster contexts. DroneAdventures has also been active in Japan and Peru. In the coming months, the team will also be working on “aerial archeology” projects in Turkey and Egypt. When Adam emailed me last week, he and his team had just returned from yet another flying mission, this time in the Philippines. I’ll be meeting up with Adam in a couple weeks to learn more about their recent adventures. In the meantime, here’s a quick recap of what they were up to in the Philippines this month.

MedAir

Adam and team snapped hundreds of aerial images using their “eBee drones” to create a detailed set of 2D maps and 3D terrain models of the disaster-affected areas where partner Medair works. This is the first time that the Swiss humanitarian organization Medair is using UAVs to inform their recovery and rehabilitation programs. They plan to use the UAV maps & models of Tacloban and hard-hit areas in Leyte to assist in assessing “where the greatest need is” and what level of “assistance should be given to affected families as they continue to recover” (1). To this end, having accurate aerial images of these affected areas will allow the Swiss organization to “address the needs of individual households and advocate on their behalf when necessary” (2). 

ebee

An eBee Drone also flew over Dulag, north of Leyte, where more than 80% of the homes and croplands were destroyed following Typhoon Yolanda. Medair is providing both materials and expertise to build new shelters in Dulag. As one Medair representative noted during the UAV flights, “Recovery from a disaster of this magnitude can be complex. The maps produced from the images taken by the drones will give everyone, including community members themselves, an opportunity to better understand not only where the greatest needs are, but also their potential solutions” (3). The partners are also committed to Open Data: “The images will be made public for free online, enabling community leaders and humanitarian organizations to use the information to coordinate reconstruction efforts” (4). The pictures of the Philippines mission below were very kindly shared by Adam who asked that they be credited to DroneAdventures.

Credit: DroneAdventures

At the request of the local Mayor, DroneAdventures and MedAir also took aerial images of a relatively undamaged area some 15 kilometers north of Tacloban, which is where the city government is looking to relocate families displaced by Typhoon Yolanda. During the deployment, Adam noted that “Lightweight drones such as the eBee are safe and easy to operate and can provide crucial imagery at a precision and speed unattainable by satellite imagery. Their relatively low cost of deployment make the technology attainable even by small communities throughout the developing world. Not only can drones be deployed immediately following a disaster in order to assess damage and provide detailed information to first-responders like Medair, but they can also assist community leaders in planning recovery efforts” (5). As the Medair rep added, “You can just push a button or launch them by hand to see them fly, and you don’t need a remote anymore—they are guided by GPS and are inherently safe” (6).

Credit: DroneAdventures

I really look forward to meeting up with Adam and the DroneAdventures team at the senseFly office in Lausanne next month to learn more about their recent work and future plans. I will also be asking the team for their feedback and guidance on the Humanitarian UAV Network (UAViators) that I am launching. So stay tuned for updates!

Bio

See also:

  • Calling All UAV Pilots: Want to Support Humanitarian Efforts? [link]
  • How UAVs are Making a Difference in Disaster Response [link]
  • Grassroots UAVs for Disaster Response (in the Philippines) [link]


Grassroots UAVs for Disaster Response

I was recently introduced to a new initiative that seeks to empower grassroots communities to deploy their own low-cost xUAVs. The purpose of this initiative? To support locally-led disaster response efforts and in so doing transfer math, science and engineering skills to local communities. The “x” in xUAV refers to expendable. The initiative is a partnership between California State University (Long Beach), University of Hawaii, Embry Riddle, The Philippine Council for Industry, Energy & Emerging Technology Research & Development, Skyeye, Aklan State University and Ateneo de Manila University in the Philippines. The team is heading back to the Philippines next week for their second field mission. This blog post provides a short overview of the project’s approach and the results from their first mission, which took place during December 2013-February 2014.

xUAV1

The xUAV team is specifically interested in a new category of UAVs, those that are locally available, locally deployable, low-cost, expendable and extremely easy to use. Their first field mission to the Philippines focused on exploring the possibilities. The pictures above/below (click to enlarge) were kindly shared by the Filipinos engaged in the project—I am very grateful to them for allowing me to share these publicly. Please do not reproduce these pictures without their written permission, thank you.

xUAV2

I spoke at length with one of the xUAV team leads, Ted Ralston, who is heading back to the Philippines the second field mission. The purpose of this follow up visit is to shift the xUAV concept from experimental to deployable. One area that his students will be focusing on with the University of Manila is the development of a very user-friendly interface (using a low-cost tablet) to pilot the xUAVs so that local communities can simply tag way-points on a map that the xUAV will then automatically fly to. Indeed, this is where civilian UAVs are headed, full automation. A good example of this trend towards full automation is the new DroidPlanner 2.0 App just released by 3DRobotics. This free app provides powerful features to very easily plan autonomous flights. You can even create new flight plans on the fly and edit them onsite.

DroidPlanner.png

So the xUAV team will focus on developing software for automated take-off and landing as well as automated adjustments for wind conditions when the xUAV is airborne, etc. The software will also automatically adjust the xUAV’s flight parameters for any added payloads. Any captured imagery would then be made easily viewable via touch-screen directly from the low-cost tablet.

xUAV3

One of the team’s top priorities throughout this project is to transfer their skills to young Filipinos, given them hands on training in science, math and engineering. An equally important, related priority, is their focus on developing local partnerships with multiple partners. We’re familiar with ideas behind Public Participatory GIS (PPGIS) vis-a-vis the participatory use of geospatial information systems and technologies. The xUAV team seeks to extend this grassroots approach to Public Participatory UAVs.

xUAV4

I’m supporting this xUAV initiative in a number of ways and will be uploading the team’s UAV imagery (videos & still photos) from their upcoming field mission to MicroMappers for some internal testing. I’m particularly interested in user-generated (aerial) content that is raw and not pre-processed or stitched together, however. Why? Because I expect this type of imagery to grow in volume given the very rapid growth of the personal micro-UAV market. For more professionally produced and stitched-together aerial content, an ideal platform is Humanitarian OpenStreetMap’s Tasking Server, which is tried and tested for satellite imagery and which was recently used to trace processed UAV imagery of Tacloban.

Screen Shot 2014-03-12 at 1.03.20 PM

I look forward to following the xUAV team’s efforts and hope to report on the outcome of their second field mission. The xUAV initiative fits very nicely with the goals of the Humanitarian UAV Network (UAViators). We’ll be learning a lot in the coming weeks and months from our colleagues in the Philippines.

bio