
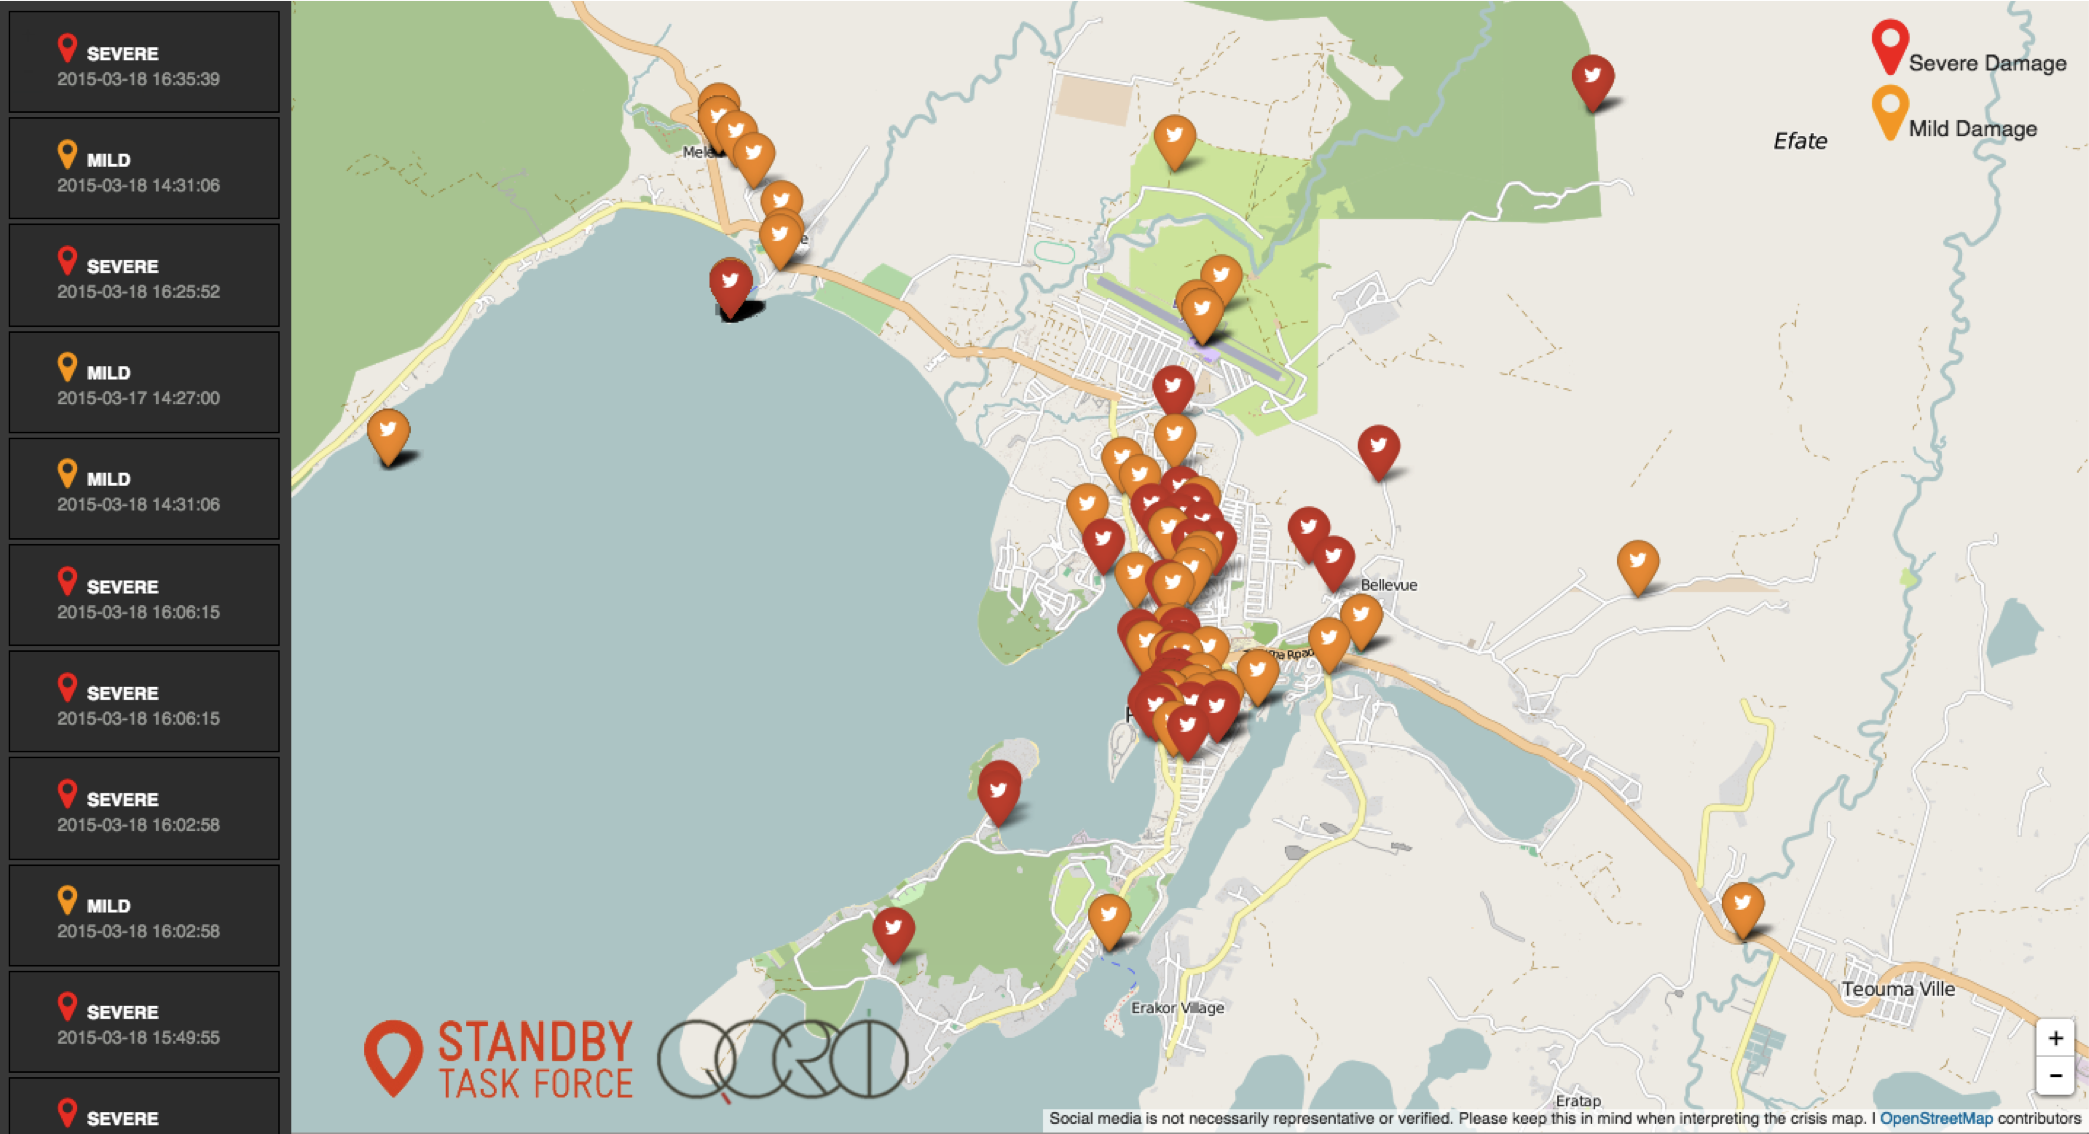
Digital Humanitarians sprung to action just hours after the Category 5 Cyclone collided with Vanuatu’s many islands. This first deployment focused on rapidly assessing the damage by analyzing multimedia content posted on social media and in the mainstream news. This request came directly from the United Nations (OCHA), which activated the Digital Humanitarian Network (DHN) to carry out the rapid damage assessment. So the Standby Task Force (SBTF), a founding member of the DHN, used QCRI′s MicroMappers platform to produce a digital, interactive Crisis Map of some 1,000+ geo-tagged pictures of disaster damage (screenshot below).
Within days of Cyclone Pam making landfall, the World Bank (WB) activated the Humanitarian UAV Network (UAViators) to quickly deploy UAV pilots to the affected islands. UAViators has access to a global network of 700+ professional UAV pilots is some 70+ countries worldwide. The WB identified two UAV teams from the Humanitarian UAV Network and deployed them to capture very high-resolution aerial photographs of the damage to support the Government’s post-disaster damage assessment efforts. Pictures from these early UAV missions are available here. Aerial images & videos of the disaster damage were also posted to the UAViators Crowdsourced Crisis Map.
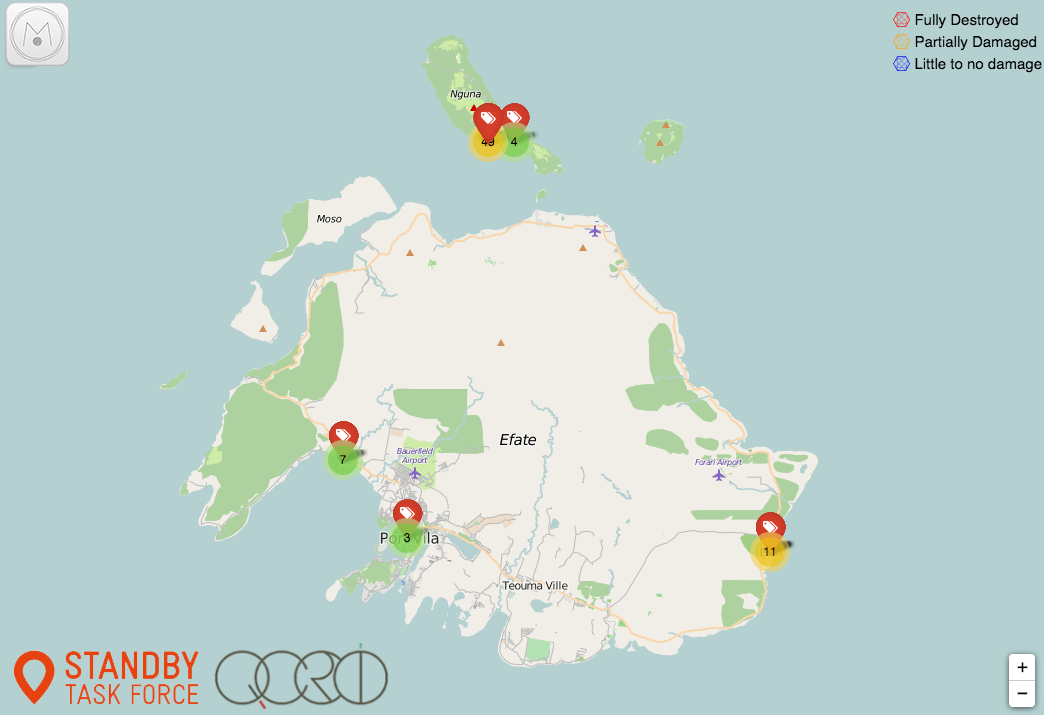
Last week, the World Bank activated the DHN (for the first time ever) to help analyze the many, many GigaBytes of aerial imagery from Vanuatu. So Digital Jedis from the DHN are now using Humanitarian OpenStreetMap (HOT) and MicroMappers (MM) to crowdsource the search for partially damaged and fully destroyed houses in the aerial imagery. The OSM team is specifically looking at the “nadir imagery” captured by the UAVs while MM is exclusively reviewing the “oblique imagery“. More specifically, digital volunteers are using MM to trace destroyed houses red, partially damaged houses orange, and using blue to denote houses that appear to have little to no damage. Below is an early screenshot of the Aerial Crisis Map for the island of Efate. The live Crisis Map is available here.
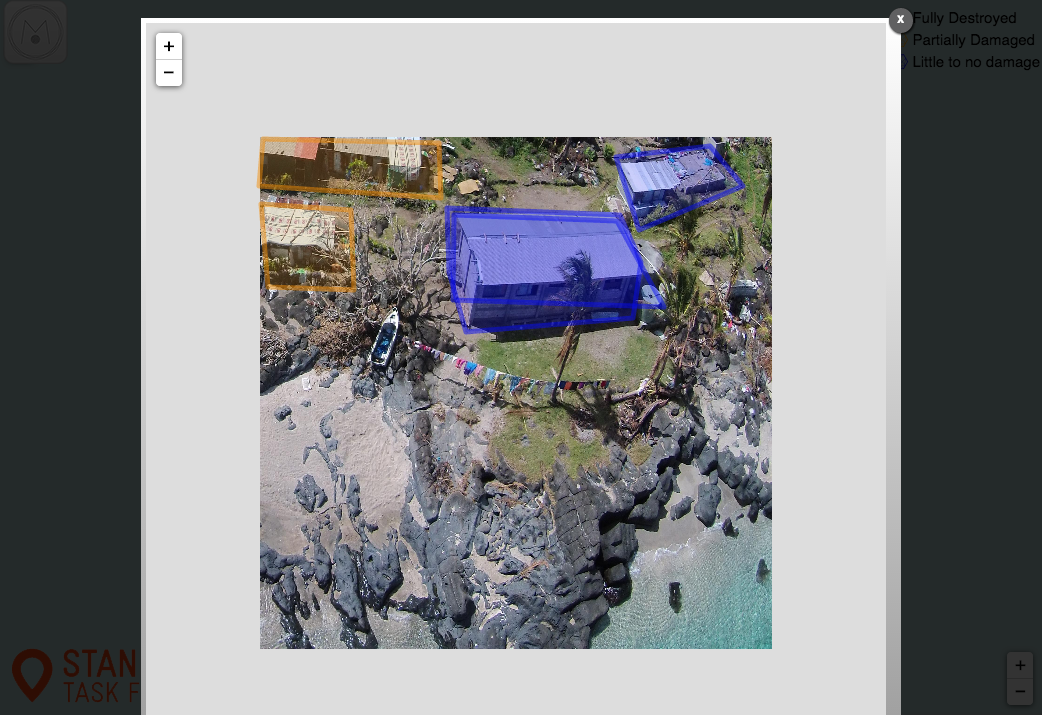
Clicking on one of these markers will open up the high resolution aerial pictures taken at that location. Here, two houses are traced in blue (little to no damage) and two on the upper left are traced in orange (partial damage expected).
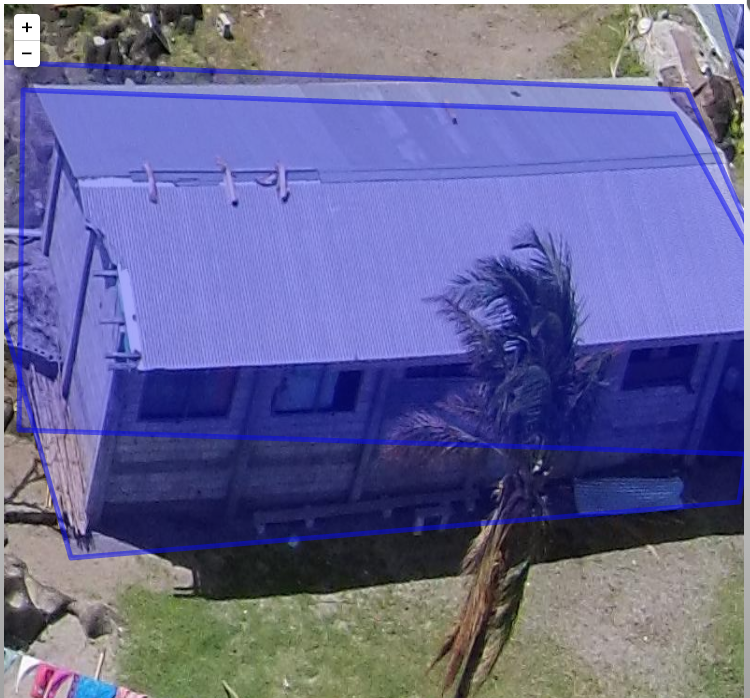
The cameras on the UAVs captured the aerial imagery in very high resolution, as you can see from the close up below. You’ll note two traces for the house. These two traces were done by two independent volunteers (for the purposes of quality control). In fact, each aerial image is shown to at least 3 different Digital Jedis.
Once this MicroMappers deployment is over, we’ll be using the resulting traces to create automated featured detection algorithms; just like we did here for the MicroMappers Namibia deployment. This approach, combining crowdsourcing with Artificial Intelligence (AI), is explored in more detail here vis-a-vis disaster response. The purpose of taking this hybrid human-machine computing solution is to accelerate (semi-automate) future damage assessment efforts.
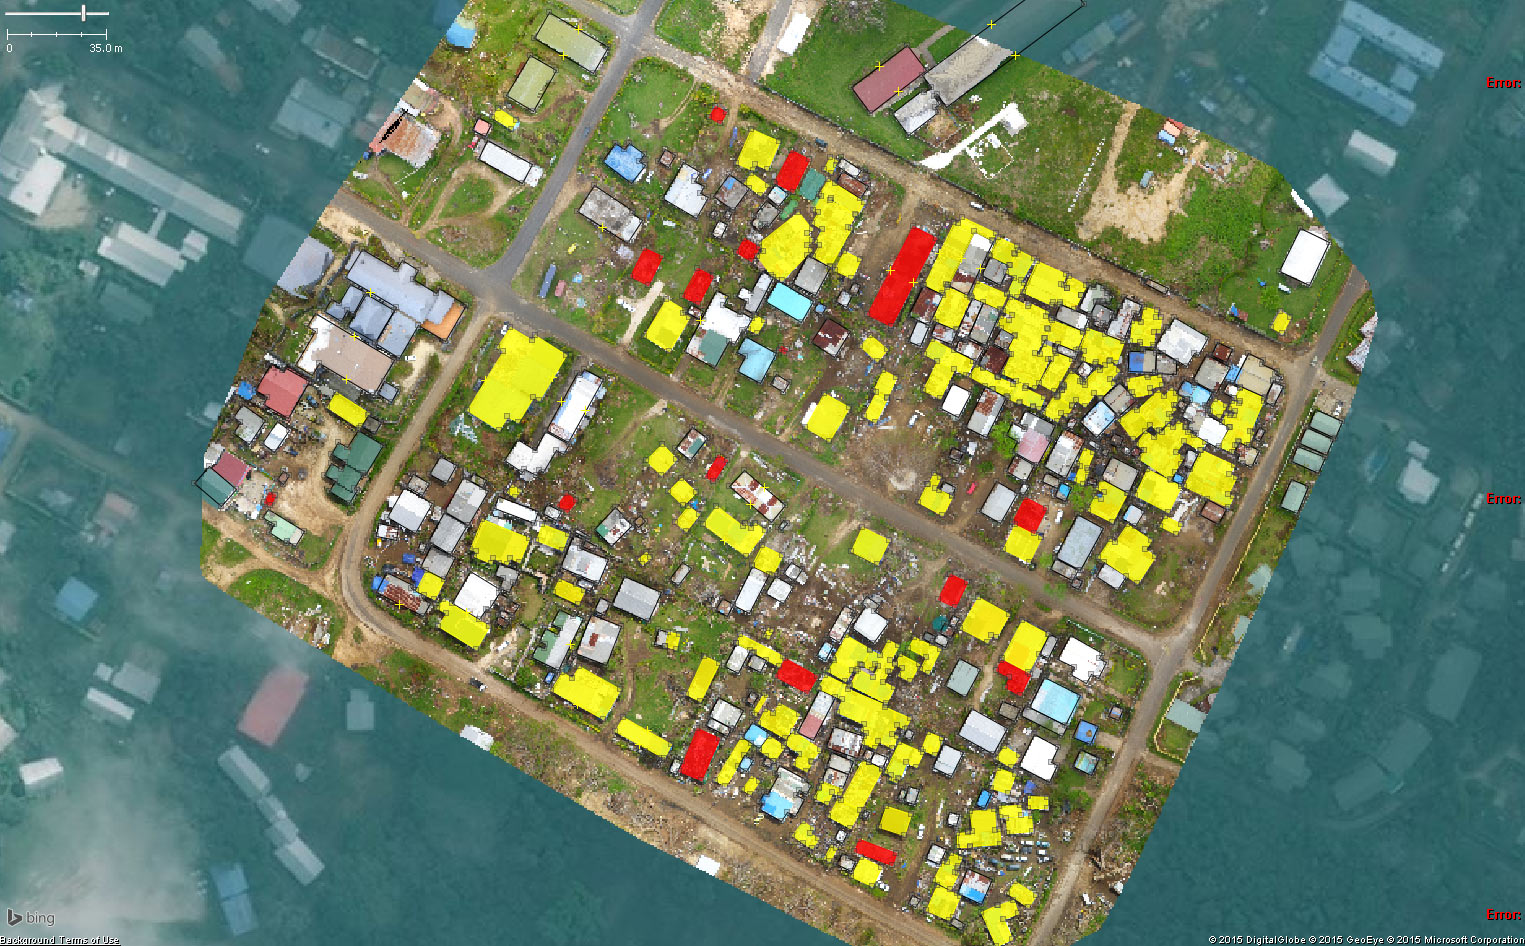
Meanwhile, back in Vanuatu, the HOT team has already carried out some tentative, preliminary analysis of the damage based on the aerial imagery provided. They are also up-dating their OSM maps of the affected islands thanks this imagery. Below is an initial damage assessment carried out by HOT for demonstration purposes only. Please visit their deployment page on the Vanuatu response for more information.
So what’s next? Combining both the nadir and oblique imagery to interpret disaster damage is ultimately what is needed, so we’re actually hoping to make this happen (today) by displaying the nadir imagery directly within the Aerial Crisis Map produced by MicroMappers. (Many thanks to the MapBox team for their assistance on this). We hope this integration will help HOT and our World Bank partners better assess the disaster damage. This is the first time that we as a group are doing anything like this, so obviously lots of learning going on, which should improve future deployments. Ultimately, we’ll need to create 3D models (point clouds) of disaster affected areas (already easy to do with high-resolution aerial imagery) and then simply use MicroMappers to crowdsource the analysis of these 3D models.
And here’s a 3D model of a village in Vanuatu constructed using 2D aerial photos taken by UAV:
For now, though, Digital Jedis will continue working very closely with the World Bank to ensure that the latter have the results they need in the right format to deliver a comprehensive damage assessment to the Government of Vanuatu by the end of the week. In the meantime, if you’re interested in learning more about digital humanitarian action, then please check out my new book, which features UAViators, HOT, MM and lots more.

Pingback: Update #2 on Vanuatu (second deployment) | Standby Task Force
Pingback: Drone companies are wisely borrowing from Apple’s advertising playbook - The Washington Post
Very interesting article, i wonder if you found some similar idea about Satellite Image Analysis in here http://www.imagesatintl.com/services/satellite-image-analysis/
Pingback: Drone Companies Are Wisely Borrowing From Apple’s Advertising Playbook | UAV Expert News
Pingback: Crowdsourcing Point Clouds for Disaster Response - dronespain.es
Pingback: Crowdsourcing Point Clouds for Disaster Response - Quadcopter Blog
Pingback: Increasing the Reliability of Aerial Imagery Analysis for Damage Assessments | iRevolutions