In March 2015, I was invited by the World Bank to spearhead an ambitious humanitarian aerial robotics (UAV) mission to Vanuatu following Cyclone Pam, a devastating Category 5 Cyclone. This mission was coordinated with Heliwest and X-Craft, two outstanding UAV companies who were identified through the Humanitarian UAV Network (UAViators) Roster of Pilots. You can learn more about the mission and see pictures here. Lessons learned from this mission (and many others) are available here.
The World Bank and partners were unable to immediately analyze the aerial imagery we had collected because they faced a Big Data challenge. So I suggested the Bank activate the Digital Humanitarian Network (DHN) to request digital volunteer assistance. As a result, Humanitarian OpenStreetMap (HOT) analyzed some of the orthorectified mosaics and MicroMappers focused on analyzing the oblique images (more on both here).
This in turn produced a number of challenges. To cite just one, the Bank needed digital humanitarians to identify which houses or buildings were completely destroyed, versus partially damaged versus largely intact. But there was little guidance on how to determine what constituted fully destroyed versus partially damaged or what such structures in Vanuatu look like when damaged by a Cyclone. As a result, data quality was not as high as it could have been. In my capacity as consultant for the World Bank’s UAVs for Resilience Program, I decided to do something about this lack of guidelines for imagery interpretation.
I turned to my colleagues at the Harvard Humanitarian Initiative (where I had previously co-founded and co-directed the HHI Program on Crisis Mapping) and invited them to develop a rigorous guide that could inform the consistent interpretation of aerial imagery of disaster damage in Vanuatu (and nearby Island States). Note that Vanuatu is number one on the World Bank’s Risk Index of most disaster-prone countries. The imagery analysis guide has just published (PDF) by the Signal Program on Human Security and Technology at HHI.
Big thanks to the HHI team for having worked on this guide and for my Bank colleagues and other reviewers for their detailed feedback on earlier drafts. The guide is another important step towards improving data quality for satellite and aerial imagery analysis in the context of damage assessments. Better data quality is also important for the use of Artificial Intelligence (AI) and computer vision as explained here. If a humanitarian UAV mission does happen in response to the recent disaster in Fiji, then the guide may also be of assistance there depending on how similar the building materials and architecture is. For now, many thanks to HHI for having produced this imagery guide.
Analyzing satellite and aerial imagery to assess disaster damage is fraught with challenges. This is true for both digital humanitarians and professional imagery analysts alike. Why? Because distinguishing between infrastructure that is fully destroyed and partially damaged can be particularly challenging. Professional imagery analysts with years of experience have readily admitted that trained analysts regularly interpret the same sets of images differently. Consistency in the interpretation of satellite and aerial imagery is clearly no easy task. My colleague Joel Kaiser from Medair recently suggested another approach.
Joel and I both serve on the “Core Team” of the Humanitarian UAV Network (UAViators). It is in this context that we’ve been exploring ways to render aerial imagery more actionable for rapid disaster damage assessments and tactical decision making. To overcome some of the challenges around the consistent analysis of aerial imagery, Joel suggested we take a rank-order approach. His proposal is quite simple: display two geo-tagged aerial images side by side with the following question: “Which of the two images shows more disaster damage?” Each combination of images could be shown to multiple individuals. Images that are voted as depicting more damage would “graduate” to the next display stage and in turn be compared to each other, and so on and so forth along with those images voted as showing less damage.
In short, a dedicated algorithm would intelligently select the right combination of images to display side by side. The number and type of votes could be tabulated to compute reliability and confidence scores for the rankings. Each image would have a unique damage score which could potentially be used to identify thresholds for fully destroyed versus partially damaged versus largely intact infrastructure. Much of this could be done on MicroMappers or similar microtasking solutions. Such an approach would do away with the need for detailed imagery interpretation guides. As noted above, consistent analysis is difficult even when such guides are available. The rank-order approach could help quickly identify and map the most severely affected areas to prioritize tactical response efforts. Note that this approach could be used with both crowd-sourced analysis and professional analysis. Note also that the GPS coordinates for each image would not be made publicly available for data privacy reasons.
Is this strategy worth pursuing? What are we missing? Joel and I would be keen to get some feedback. So please feel free to use the comments section below to share your thoughts or to send an email here.
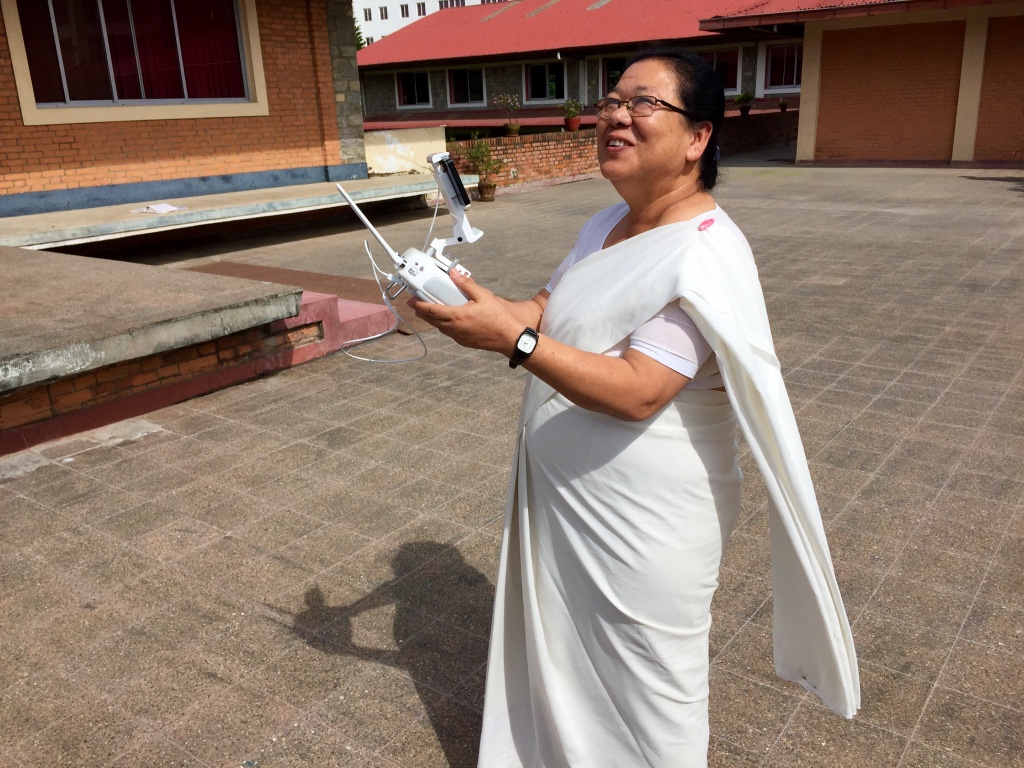
I had the honor of spearheading this disaster recovery UAV mission in Nepal a few weeks ago as part of Kathmandu Flying Labs. I’ve been working on this new initiative (in my own time) with Kathmandu Living Labs (KLL), Kathmandu University (KU), DJI and Pix4D. This Flying Lab is the first of several local UAV innovation labs that I am setting up (in my personal capacity and during my holiday time) with friends and colleagues in disaster-prone countries around the world. The short film documentary above was launched just minutes ago by DJI and describes how we teamed up with local partners in Kathmandu to make use of aerial robotics (UAVs) to map Nepal’s recovery efforts.
Here are some of the 3D results, courtesy of Pix4D (click to enlarge):
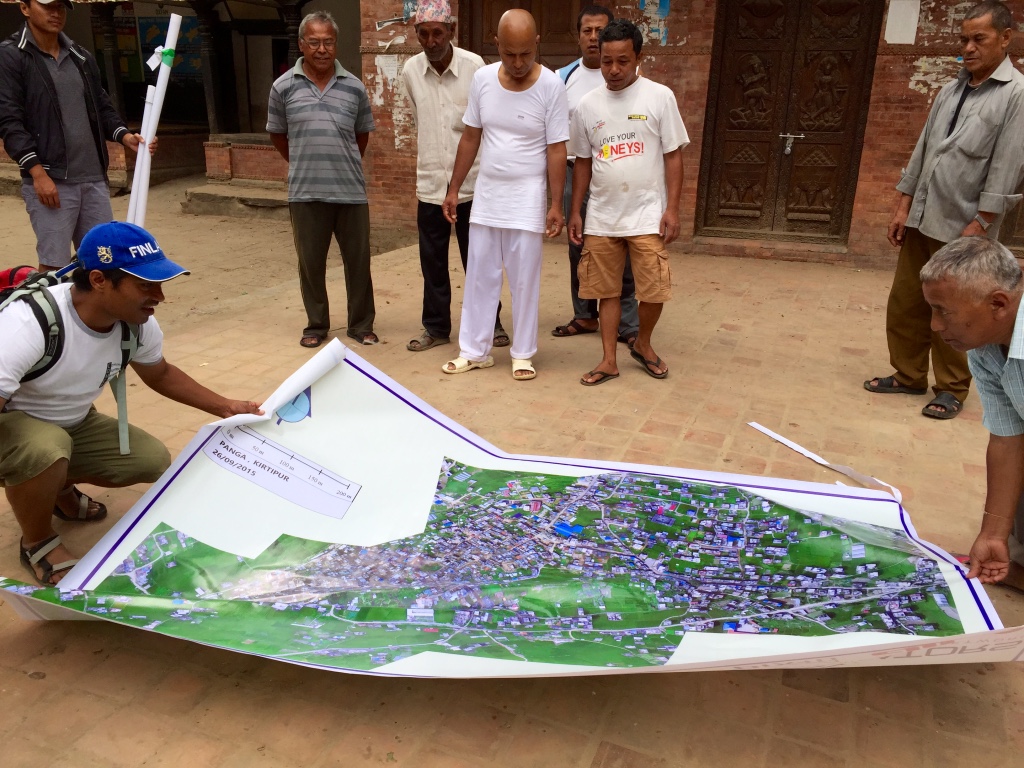
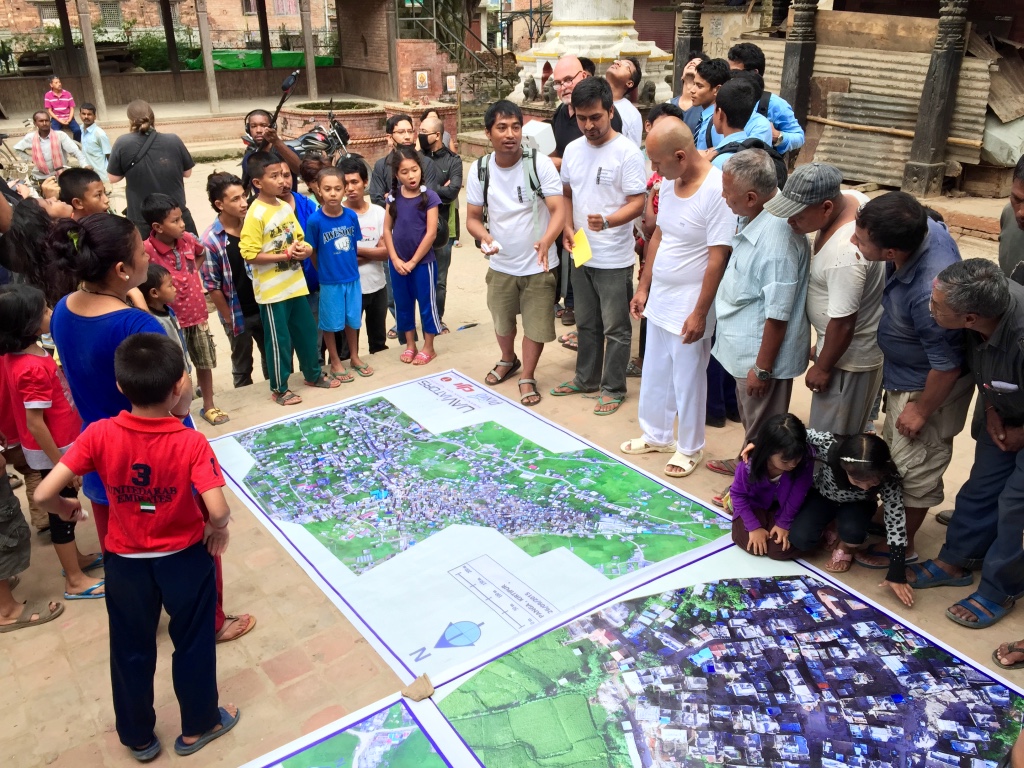
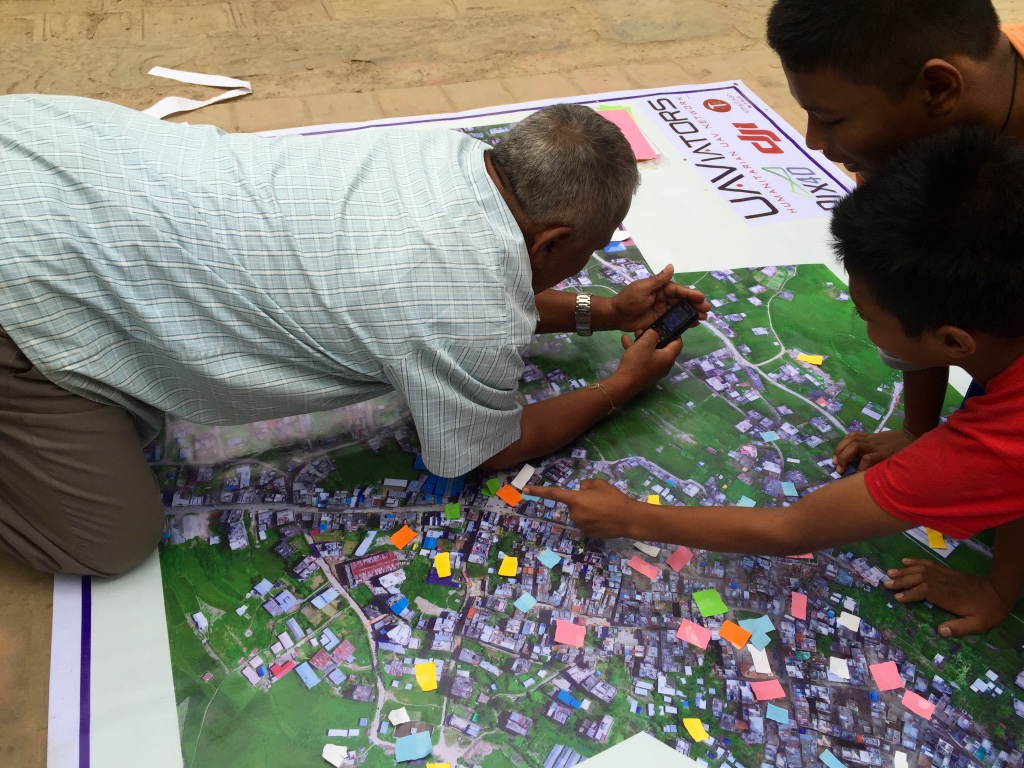
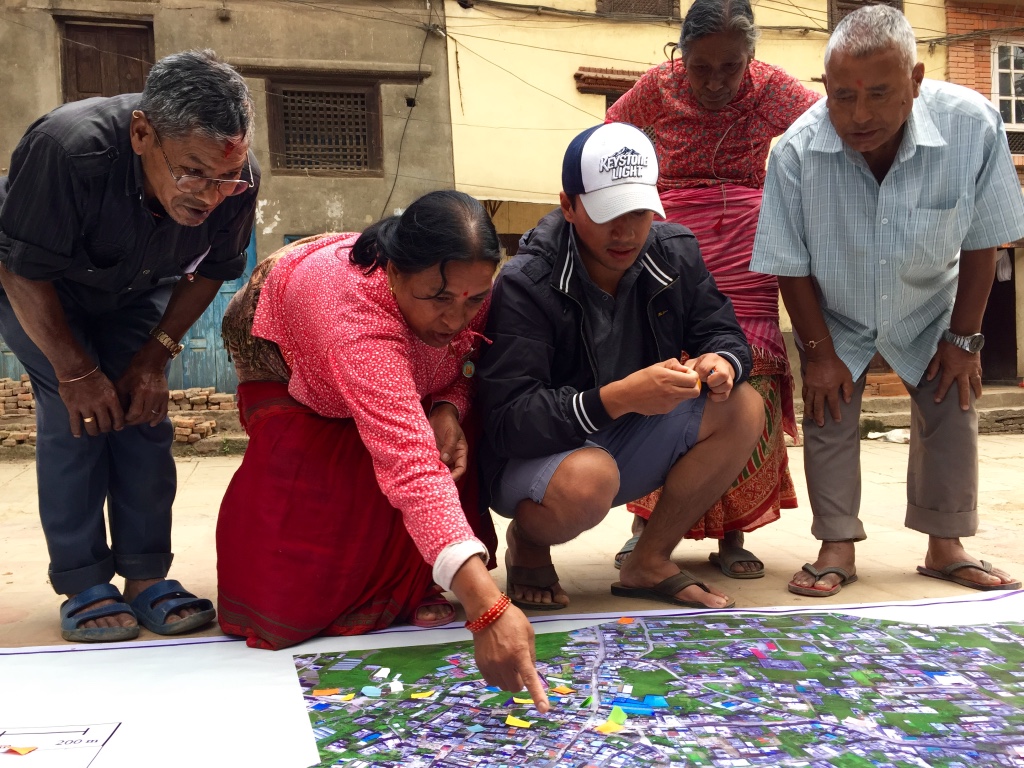
Since most of our local partners in Nepal don’t have easy access to computers or VR headsets, I found another way to unlock and liberate this digital data by printing our high-resolution maps on large, rollable banners.
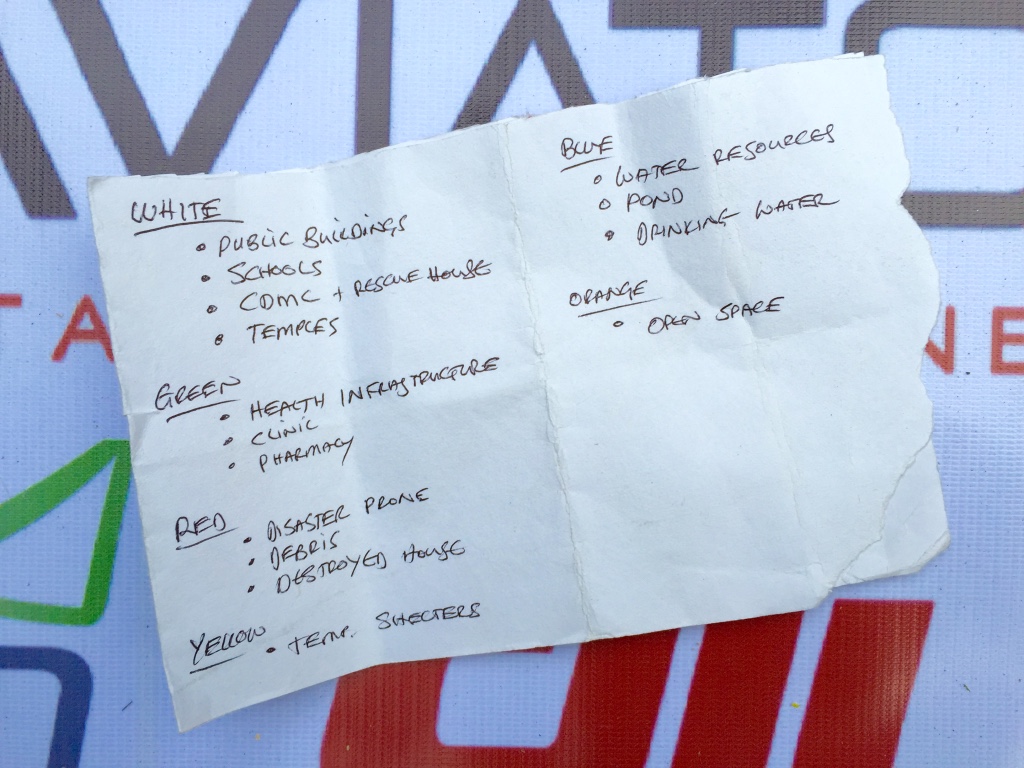
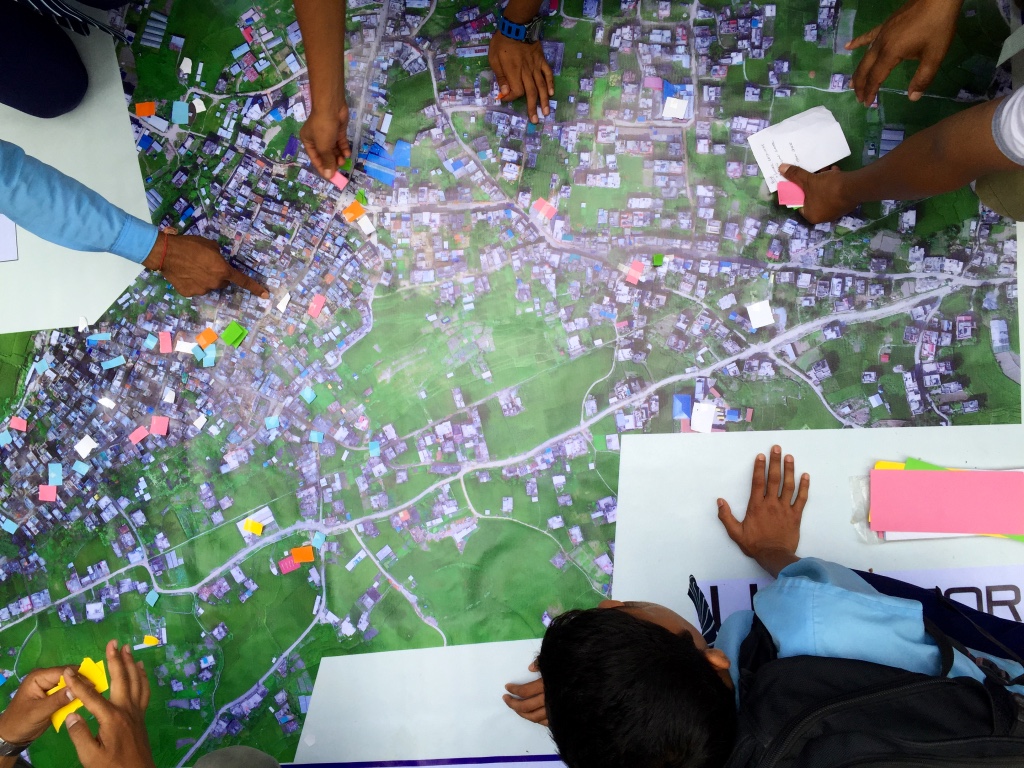
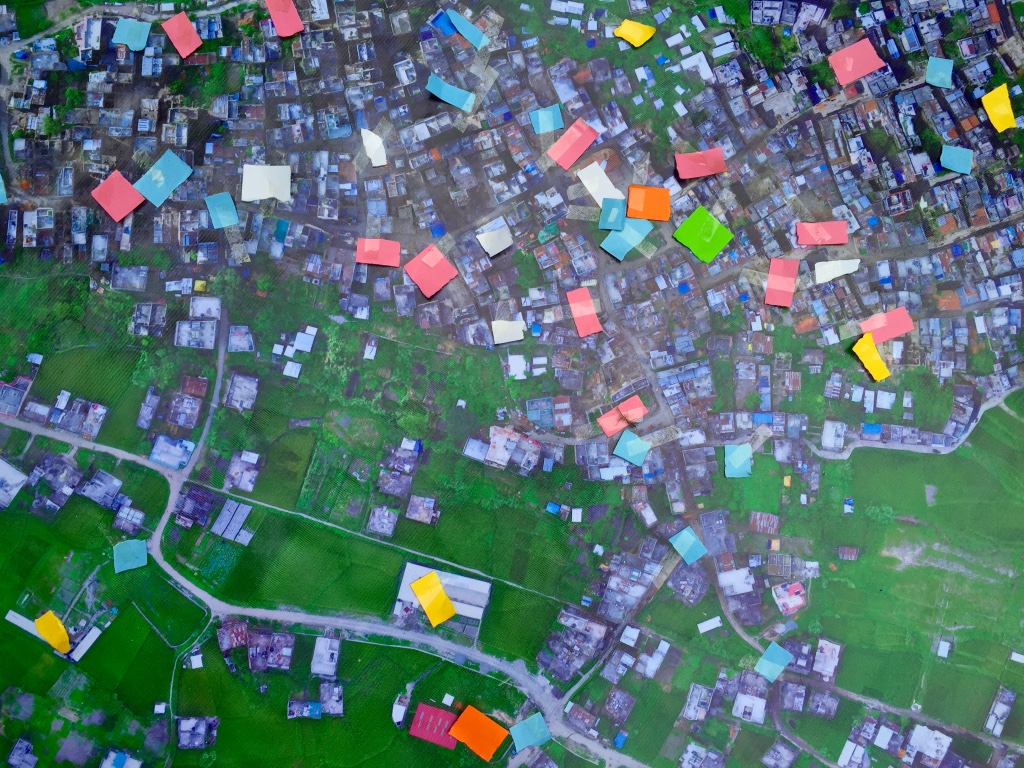
We brought these banner maps back to the local community and invited them to hack the map. How? Directly, by physically adding their local knowledge to the map; knowledge about the location of debris, temporary shelters, drinking water and lots more. We brought tape and color-coded paper with us to code this knowledge so that the community could annotate the map themselves.
In other words, we crowdsourced a crisis map of Panga, which was highly participatory. The result was a rich, contextual social layer on top of the base map, which further inform community discussions on strategies and priorities guiding their recovery efforts. For the first time ever, the community of Panga was working off the one and same dataset to inform their rebuilding. In short, our humanitarian mission combined aerial robotics, computer vision, water-proof banners, local knowledge, tape, paper and crowdsourcing to engage local communities on the reconstruction process.
I’m now spending my evenings & weekends working with friends and colleagues to plan a follow-up mission in early 2016. We’ll be returning to Kathmandu Flying Labs with new technology partners to train our local partners on how to use fixed-wing UAVs for large scale mapping efforts. In the meantime, we’re also exploring the possibility of co-creating Jakarta Flying Labs, Monrovia Flying Labs and Santiago Flying Labs in 2016.
I’m quitting my day job next week to devote myself full time to these efforts. Fact is, I’ve been using all of my free time (meaning evenings, weekends and many, many weeks of holiday time) to pursue my passion in aid robotics and to carry out volunteer-based UAV missions like the one in Nepal. I’ve also used holiday time (and my own savings) to travel across the globe to present this volunteer-work at high-profile events, such as the 2015 Web Summit here in Dublin where the DJI film documentary was just publicly launched.
My Nepali friends & I need your help to make sure that Kathmandu Flying Labs take-off and become a thriving and sustainable center of social entrepreneur-ship. To this end, we’re actively looking for both partners and sponsors to make all this happen, so please do get in touch if you share our vision. And if you’d like to learn more about how UAVs & other emerging technologies are changing the face of humanitarian action, then check out my new book Digital Humanitarians.
In the meantime, big, big thanks to our Nepali partners and technology partners for making our good work in Kathmandu possible!
Buddhist Temples adorn Nepal’s blessed land. Their stupas, like Everest, stretch to the heavens, yearning to democratize the sky. We felt the same yearning after landing in Kathmandu with our UAVs. While some prefer the word “drone” over “UAVs”, the reason our Nepali partners use the latter dates back some 3,000 years to the spiritual epic Mahabharata (Great Story of Bharatas). The ancient story features Drona, a master of advanced military arts who slayed hundreds of thousands with his bow & arrows. This strong military connotation explains why our Nepali partners use “UAV” instead, which is the term we also used for our Humanitarian UAV Mission in the land of Buddha. Our purpose: to democratize the sky.
Unmanned Aerial Vehicles (UAVs) are aerial robots. They are the first wave of robotics to impact the humanitarian space. The mission of the Humanitarian UAV Network (UAViators) is to enable the safe, responsible and effective use of UAVs in a wide range of humanitarian and development settings. We thus spearheaded a unique and weeklong UAV Mission in Nepal in close collaboration with Kathmandu University (KU), Kathmandu Living Labs (KLL), DJI and Pix4D. This mission represents the first major milestone for Kathmandu Flying Labs (please see end of this post for background on KFL).
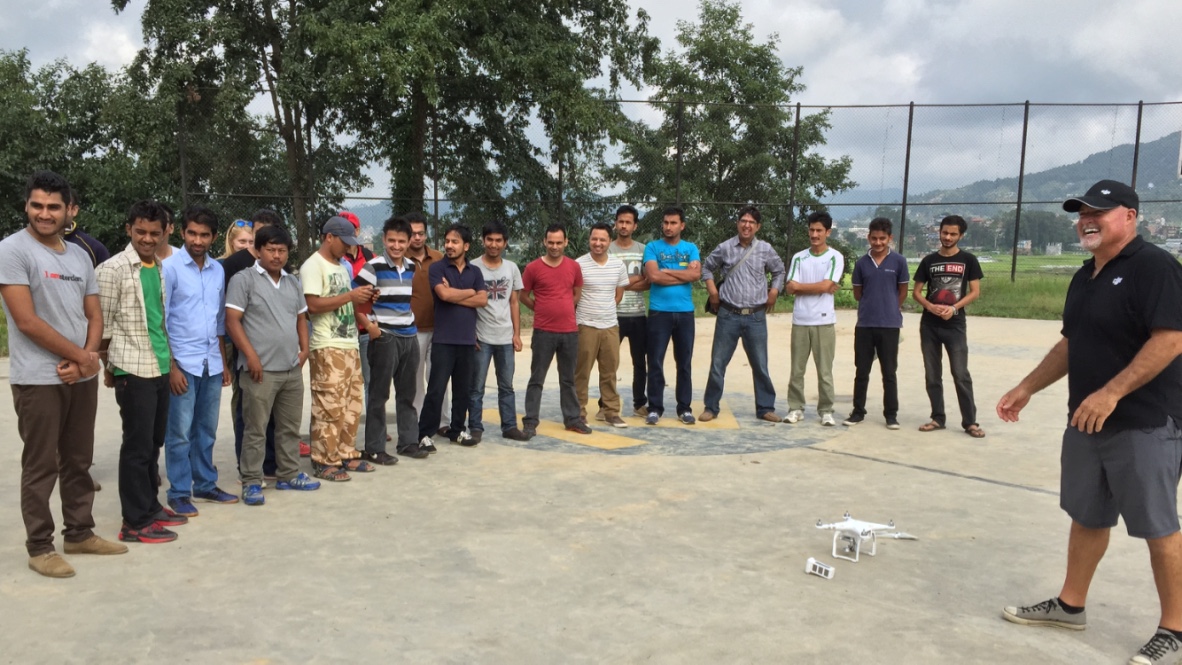
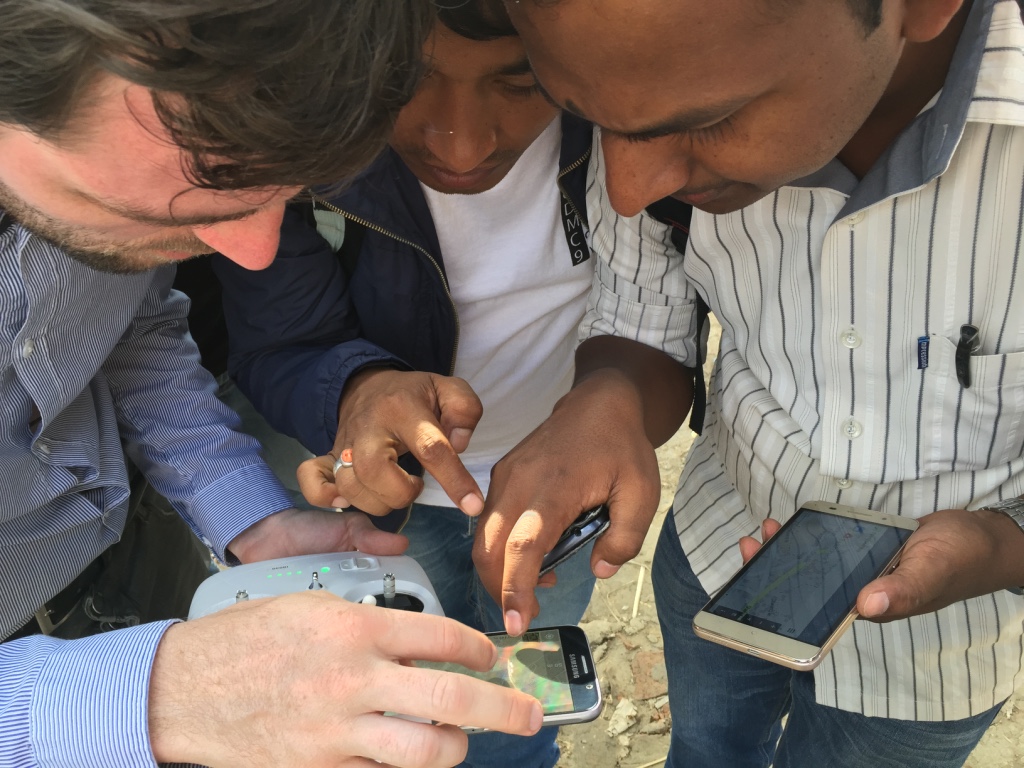
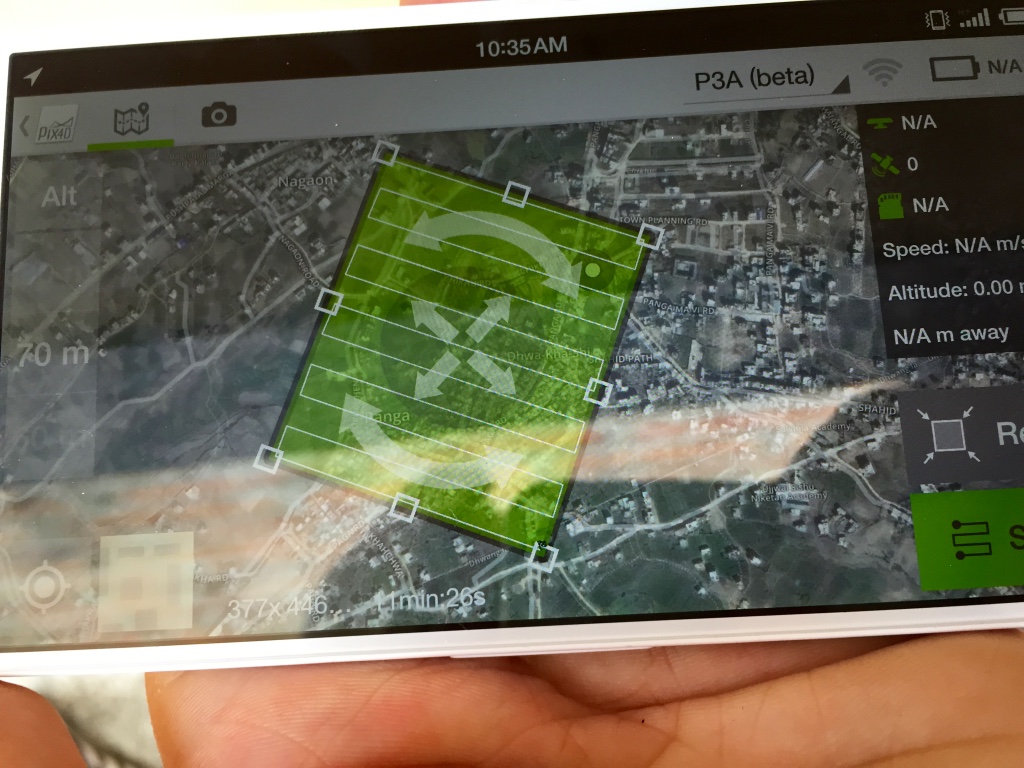
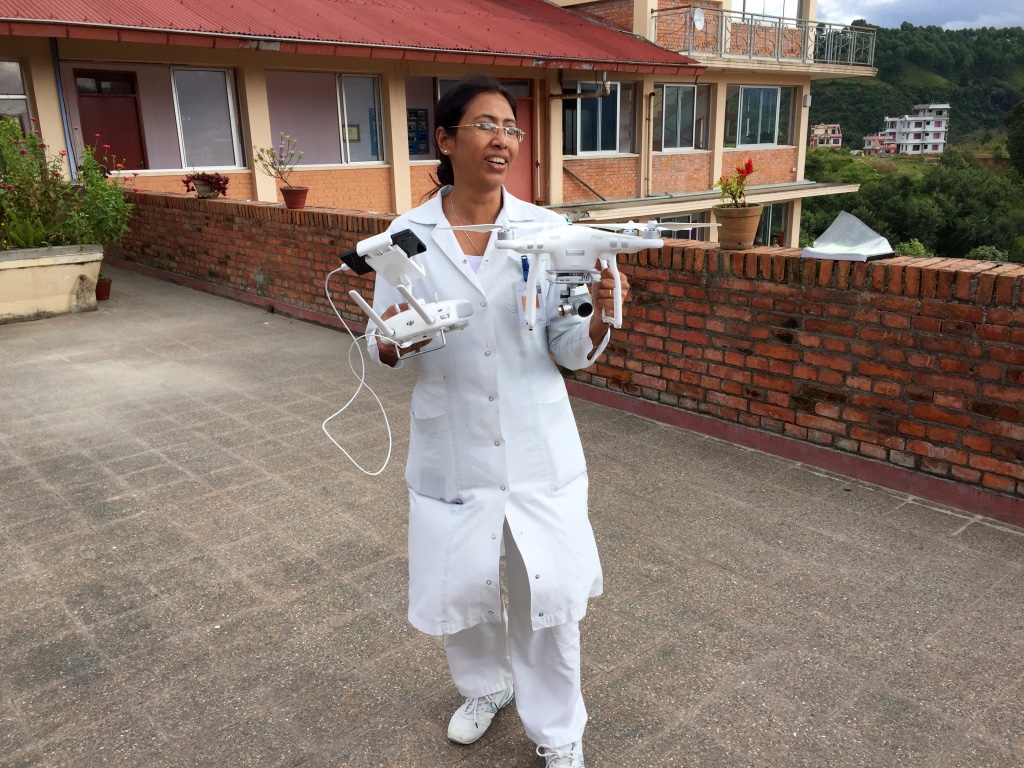
Our joint UAV mission combined both hands-on training and operational deployments. The full program is available here. The first day comprised a series of presentations on Humanitarian UAV Applications, Missions, Best Practices, Guidelines, Technologies, Software and Regulations. These talks were given by myself, KU, DJI, KLL and the Civil Aviation Authority (CAA) of Nepal. The second day focused on direct hands-on training. DJI took the lead by training 30+ participants on how to use the Phantom 3 UAVs safely, responsibly. Pix4D, also on site, followed up by introducing their imagery-analysis software.
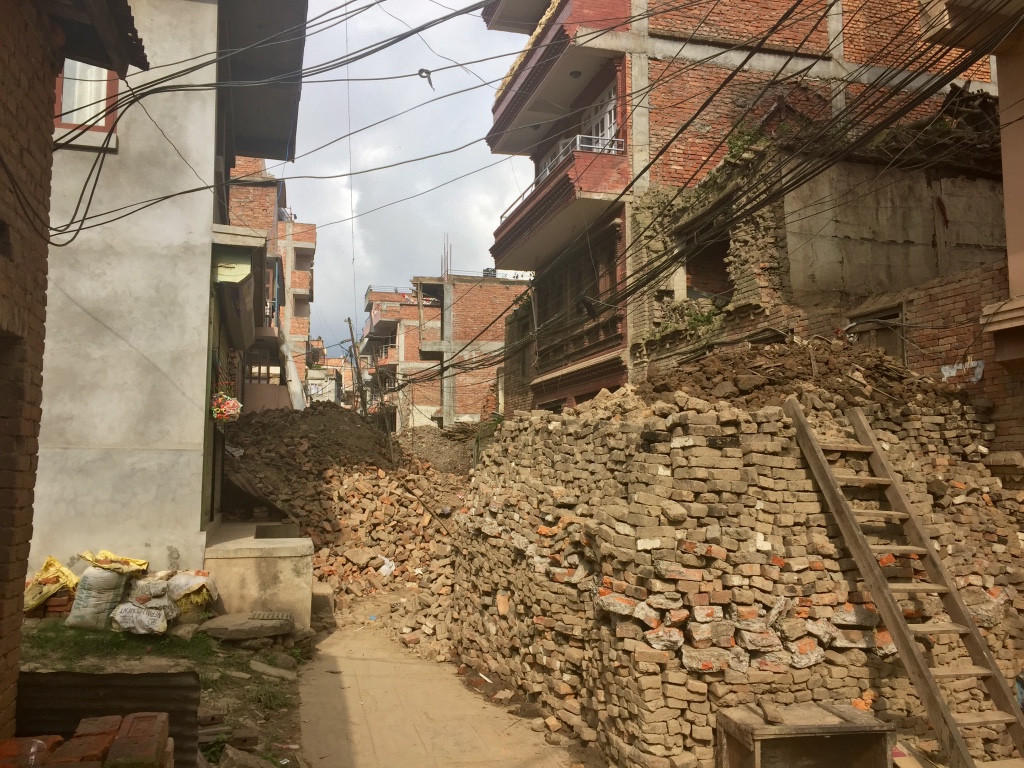
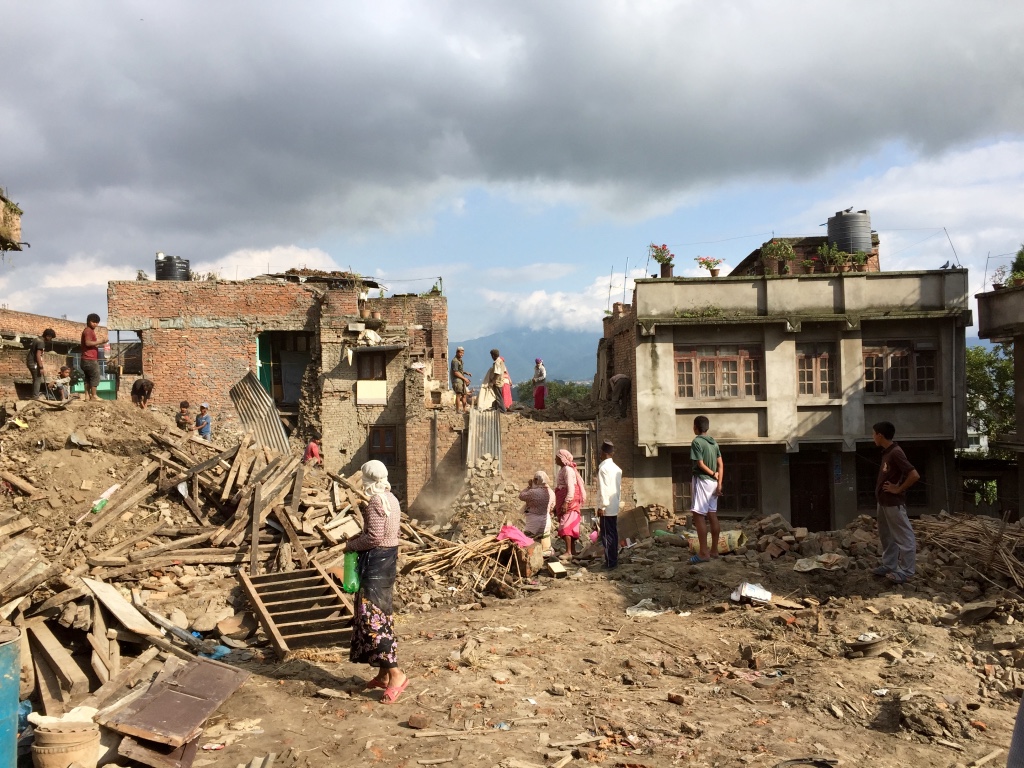
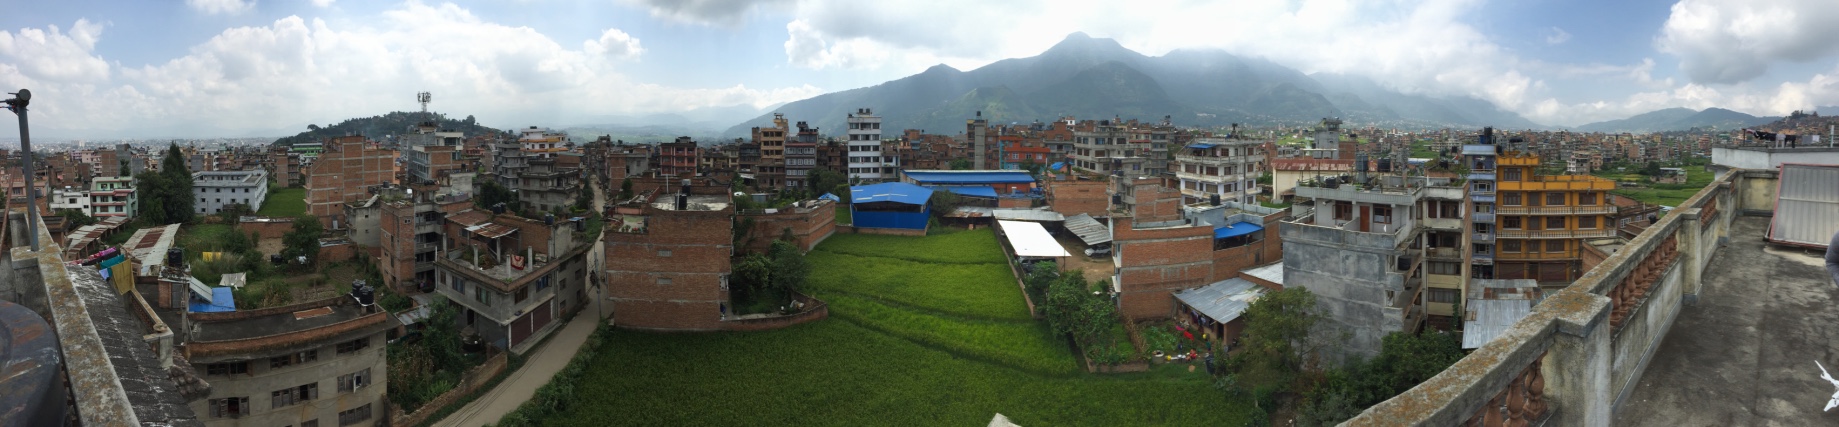
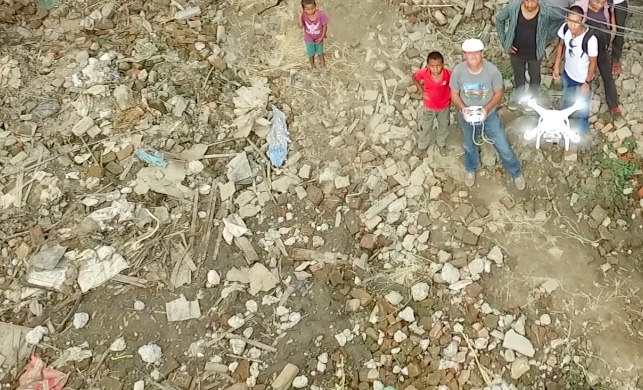
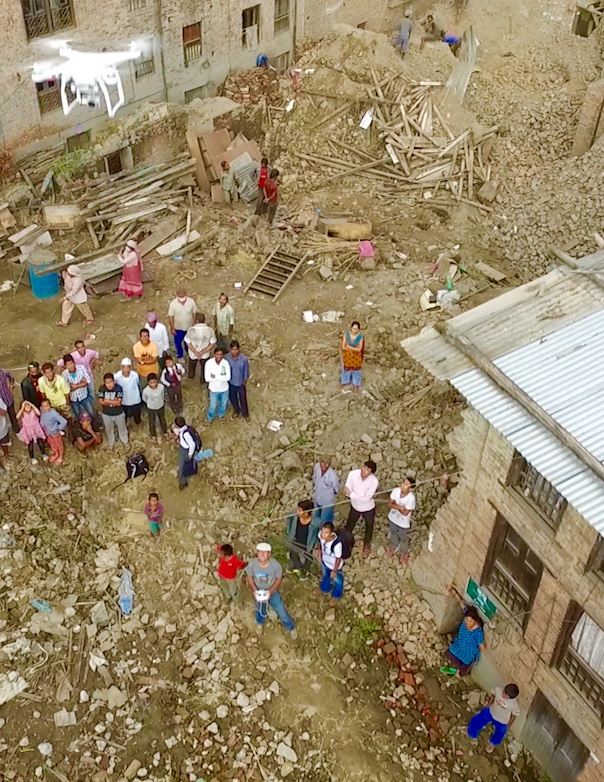
The second-half of the day was dedicated to operations. We had already received written permission from the CAA to carry out all UAV flights thanks to KU’s outstanding leadership. KU also selected the deployment sites and enabled us to team up with the very pro-active Community Disaster Management Committee (CDMC-9) of Kirtipur to survey the town of Panga, which had been severely affected by the earthquake just months earlier. The CDMC was particularly keen to gain access to very high-resolution aerial imagery of the area to build back faster and better, so we spent half-a-day flying half-a-dozen Phantom 3’s over parts of Panga as requested by our local partners.
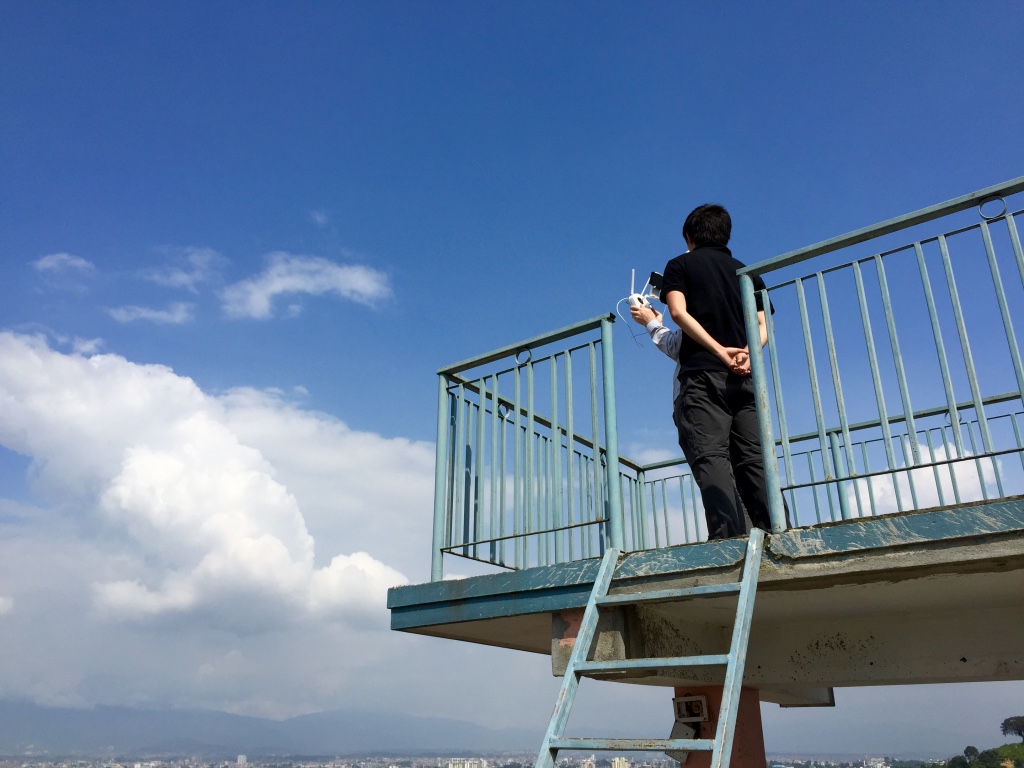
The best part of this operation came at the end of the day when we had finished the mission and were packing up: Our Nepali partners politely noted that we had not in fact finished the job; we still had a lot more area to cover. They wanted us back in Panga the following day to complete our mapping mission. We thus changed our plans and returned the next day during which—thanks to DJI & Pix4D—we flew several dozen additional UAV flights from four different locations across Panga (without taking a single break; no lunch was had). Our local partners were of course absolutely invaluable throughout since they were the ones informing the flight plans. They also made it possible for us to launch and land all our flights from the highest rooftops across town. (Click images to enlarge).
Meanwhile, back at KU, our Pix4D partners provided hands-on training on how to use their software to analyze the aerial imagery we had collected the day before. KLL also provided training on how to use the Humanitarian Open Street Map Tasking Manager to trace this aerial imagery. Incidentally, we flew well over 60 UAV flights all in all over the course of our UAV mission, which includes all our training flights on campus as well as our aerial survey of a teaching hospital. Not a single incident or accident occurred; everyone followed safety guidelines and the technology worked flawlessly.
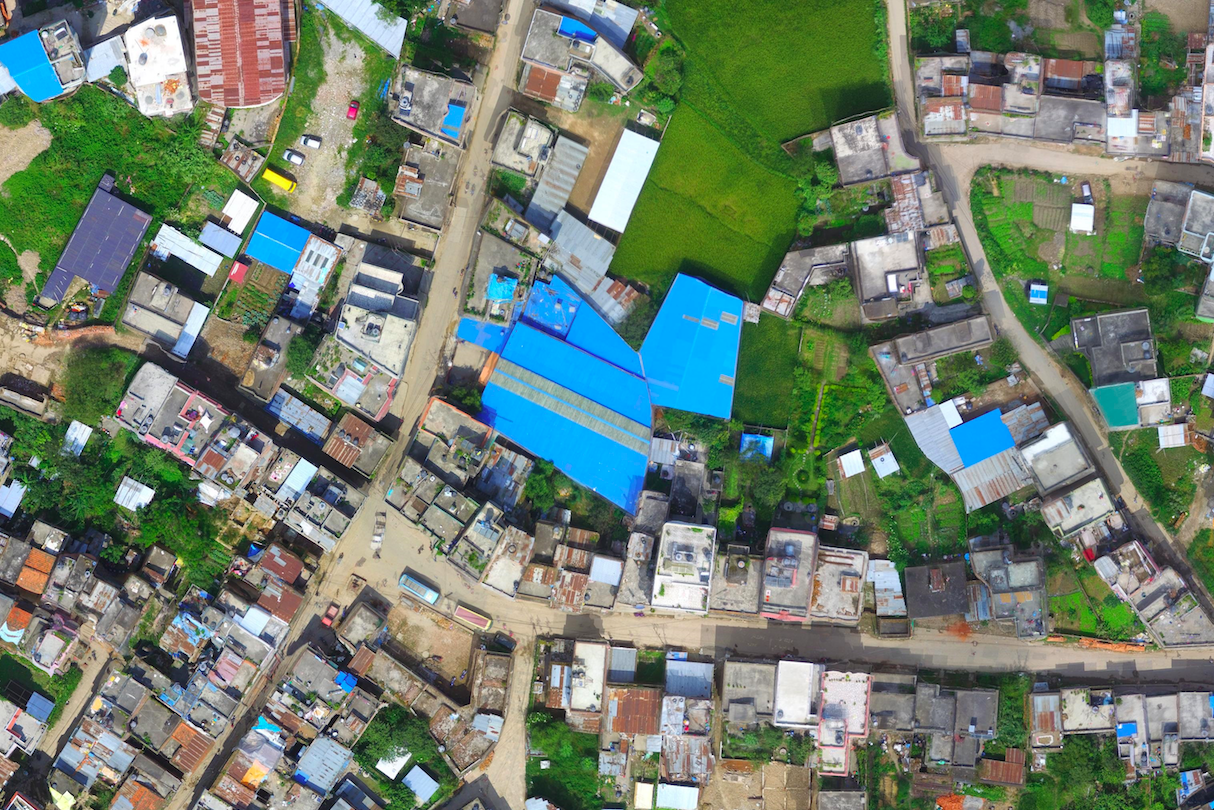
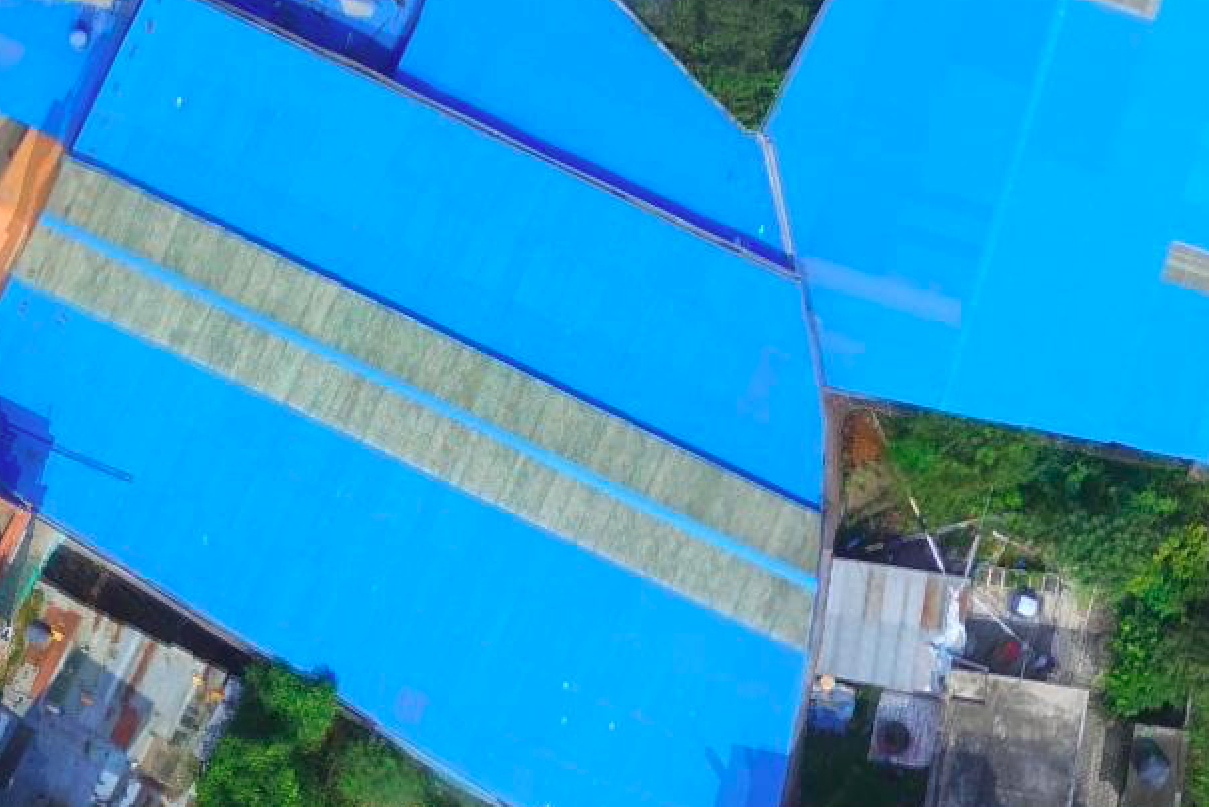
With more than 800 aerial photographs in hand, the Pix4D team worked through the night to produce a very high-resolution orthorectified mosaic of Panga. Here are some of the results.
Compare these results with the resolution and colors of the satellite imagery for the same area (maximum zoom).
We can now use MicroMappers to crowdsource the analysis & digital annotation of oblique aerial pictures and videos collected throughout the mission. This is an important step in the development of automated feature-detection algorithms using techniques from computer vision and machine learning. The reason we want automated solutions is because aerial imagery already presents a Big Data challenge for humanitarian and development organizations. Indeed, a single 20- minute UAV flight can generate some 800 images. A trained analyst needs at least one minute to analyze a single image, which means that more than 13 hours of human time is needed to analyze imagery captured from just one 20-minute UAV flight. More on this Big Data challenge here.
Incidentally, since Pix4D also used their software to produce a number of stunning 3D models, I’m keen to explore ways to crowdsource 3D models via MicroMappers and to explore possible Virtual Reality solutions to the Big Data challenge. In any event, we generated all the aerial data requested by our local partners by the end of the day.
While this technically meant that we had successfully completed our mission, it didn’t feel finished to me. I really wanted to “liberate” the data completely and place it directly into the hands of the CDCM and local community in Panga. What’s the point of “open data” if most of Panga’s residents are not able to view or interact with the resulting maps? So I canceled my return flight and stayed an extra day to print out our aerial maps on very large roll-able and waterproof banners (which are more durable than paper-based maps).
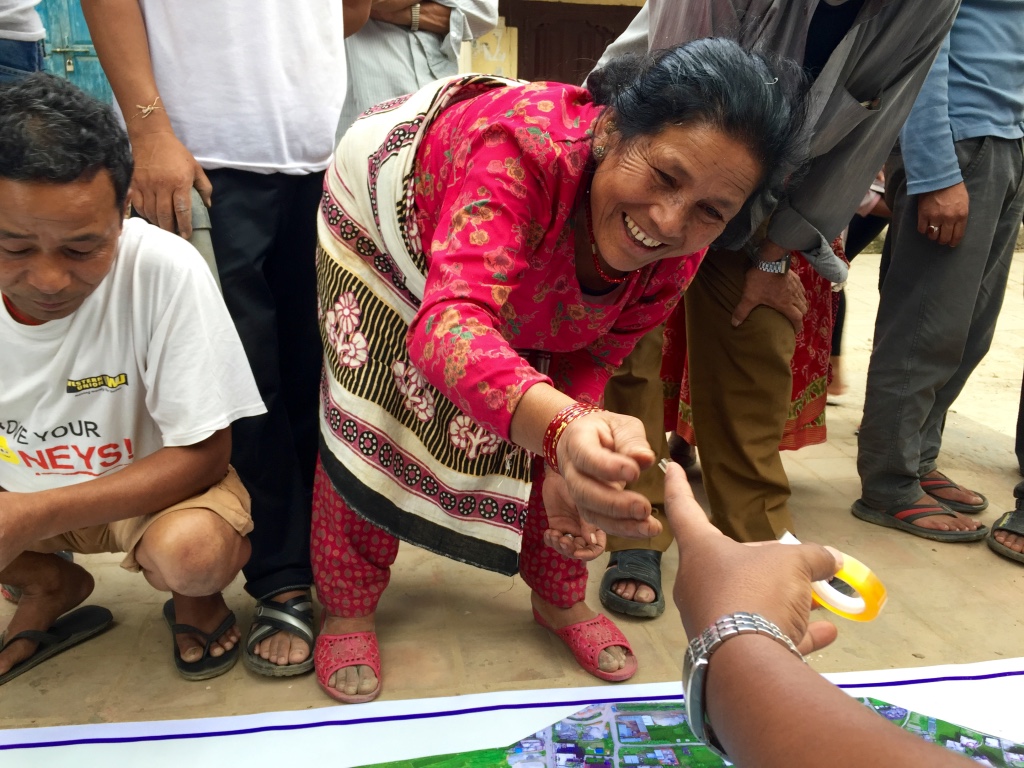
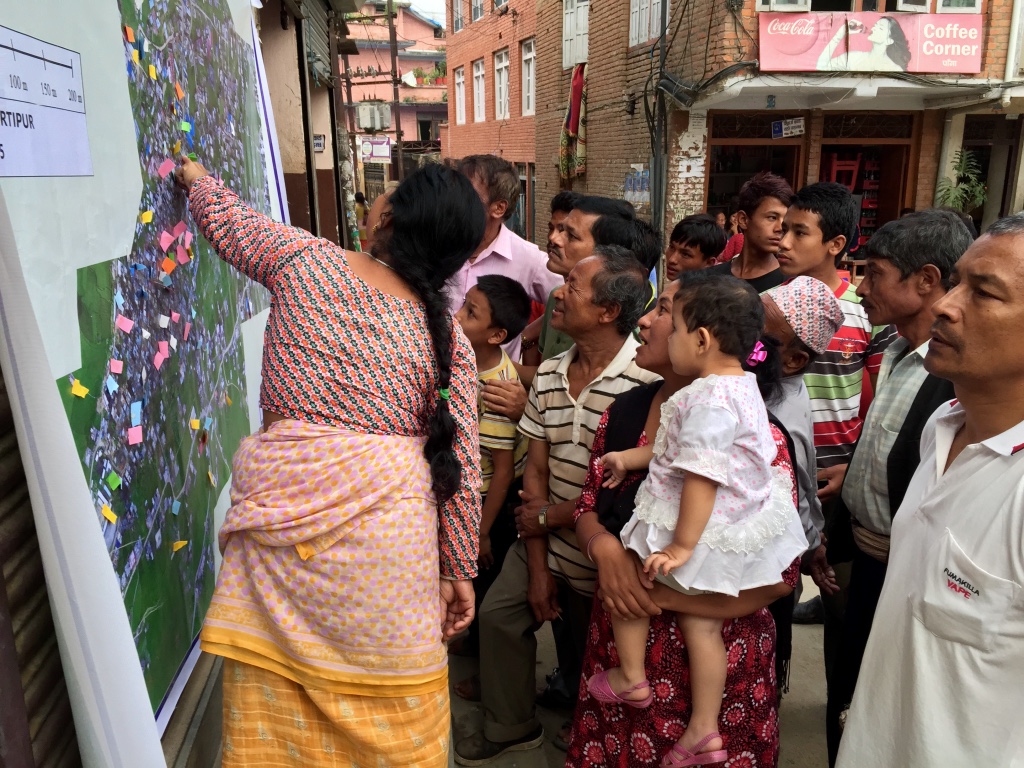
We thus used these banner-maps and participatory mapping methods to engage the local community directly. We invited community members to annotate the very-high resolution aerial maps themselves by using tape and color-coded paper we had brought along. In other words, we used the aerial imagery as a base map to catalyze a community-wide discussion; to crowdsource and to visualize the community’s local knowledge. Participatory mapping and GIS (PPGIS) can play an impactful role in humanitarian and development projects, hence the initiative with our local partners (more here on community mapping).
In short, our humanitarian mission combined aerial robotics, computer vision, waterproof banners, tape, paper and crowdsourcing to inform the rebuilding process at the community level.
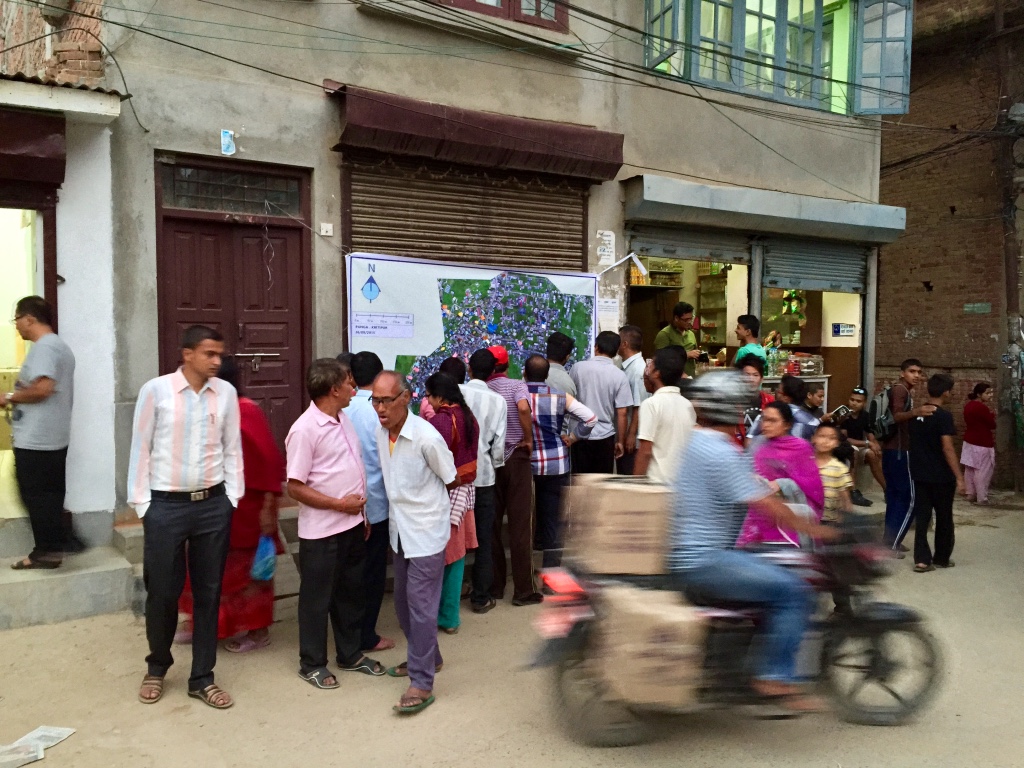
The engagement from the community was absolutely phenomenal and definitely for me the highlight of the mission. Our CDMC partners were equally thrilled and excited with the community engagement that the maps elicited. There were smiles all around. When we left Panga some four hours later, dozens of community members were still discussing the map, which our partners had hung up near a popular local teashop.
There’s so much more to share from this UAV mission; so many angles, side-stories and insights. The above is really just a brief and incomplete teaser. So stay tuned, there’s a lot more coming up from DJI and Pix4D. Also, the outstanding film crew that DJI invited along is already reviewing the vast volume of footage captured during the week. We’re excited to see the professionally edited video in coming weeks, not to mention the professional photographs that both DJI and Pix4D took throughout the mission. We’re especially keen to see what our trainees at KU and KLL do next with the technology and software that are now in their hands. Indeed, the entire point of our mission was to help build local capacity for UAV missions in Nepal by transferring knowledge, skills and technology. It is now their turn to democratize the skies of Nepal.
Acknowledgements: Some serious acknowledgements are in order. First, huge thanks to Lecturer Uma Shankar Panday from KU for co-sponsoring this mission, for hosting us and for making our joint efforts a resounding success. The warm welcome and kind hospitality we received from him, KU’s faculty and executive leadership was truly very touching. Second, special thanks to the CAA of Nepal for participating in our training and for giving us permission to fly. Third, big, big thanks to the entire DJI and Pix4D Teams for joining this UAViators mission and for all their very, very hard work throughout the week. Many thanks also to DJI for kindly donating 10 Smartisan phones and 10 Phantom 3’s to KU and KLL; and kind thanks to Pix4D for generously donating licenses of their software to both KU and KLL. Fourth, many thanks to KLL for contributing to the training and for sharing our vision behind Kathmandu Flying Labs. Fifth, I’d like to express my sincere gratitude to Smartisan for co-sponsoring this mission. Sixth, deepest thanks to CDMC and Dhulikhel Hospital for partnering with us on the ops side of the mission. Their commitment and life-saving work are truly inspiring. Seventh, special thanks to the film and photography crew for being so engaged throughout the mission; they were absolutely part of the team. In closing, I want to specifically thank my colleagues Andrew Schroeder from UAViators and Paul & William from DJI for all the heavy lifting they did to make this entire mission possible. On a final and personal note, I’ve made new friends for life as a result of this UAV mission, and for that I am infinitely grateful.
Kathmandu Flying Labs: My colleague Dr. Nama Budhathoki and I began discussing the potential role that small UAVs could play in his country in early 2014, well over a year-and-half before Nepal’s tragic earthquakes. Nama is the Director of Kathmandu Living Labs, a crack team of Digital Humanitarians whose hard work has been featured in The New York Times and the BBC. Nama and team create open-data maps for disaster risk reduction and response. They use Humanitarian OpenStreetMap’s Tasking Server to trace buildings and roads visible from orbiting satellites in order to produce these invaluable maps. Their primary source of satellite imagery for this is Bing. Alas, said imagery is both low-resolution and out-of-date. And they’re not sure they’ll have free access to said imagery indefinitely either.
So Nama and I decided to launch a UAV Innovation Lab in Nepal, which I’ve been referring to as Kathmandu Flying Labs. A year-and-a-half later, the tragic earthquake struck. So I reached out to DJI in my capacity as founder of the Humanitarian UAV Network (UAViators). The mission of UAViators is to enable the safe, responsible and effective use of UAVs in a wide range of humanitarian and development settings. DJI, who are on the Advisory Board of UAViators, had deployed a UAV team in response to the 6.1 earthquake in China the year before. Alas, they weren’t able to deploy to Nepal. But they very kindly donated two Phantom 2’s to KLL.
A few months later, my colleague Andrew Schroeder from UAViators and Direct Relief reconnected with DJI to explore the possibility of a post-disaster UAV Mission focused on recovery and rebuilding. Both DJI and Pix4D were game to make this mission happen, so I reached out to KLL and KU to discuss logistics. Professor Uma at KU worked tirelessly to set everything up. The rest, as they say, is history. There is of course a lot more to be done, which is why Nama, Uma and I are already planning the next important milestones for Kathmandu Flying Labs. Do please get in touch if you’d like to be involved and contribute to this truly unique initiative. We’re also exploring payload delivery options via UAVs and gearing up for new humanitarian UAV missions in other parts of the planet.
Humanitarian and development organizations like the United Nations and the World Bank typically carry out disaster damage and needs assessments following major disasters. The ultimate goal of these assessments is to measure the impact of disasters on the society, economy and environment of the affected country or region. This includes assessing the damage caused to building infrastructure, for example. These assessment surveys are generally carried out in person—that is, on foot and/or by driving around an affected area. This is a very time-consuming process with very variable results in terms of data quality. Can 3D (Point Clouds) derived from very high resolution aerial imagery captured by UAVs accelerate and improve the post-disaster damage assessment process? Yes, but a number of challenges related to methods, data & software need to be overcome first. Solving these challenges will require pro-active cross-disciplinary collaboration.
The following three-tiered scale is often used to classify infrastructure damage: “1) Completely destroyed buildings or those beyond repair; 2) Partially destroyed buildings with a possibility of repair; and 3) Unaffected buildings or those with only minor damage . By locating on a map all dwellings and buildings affected in accordance with the categories noted above, it is easy to visualize the areas hardest hit and thus requiring priority attention from authorities in producing more detailed studies and defining demolition and debris removal requirements” (UN Handbook). As one World Bank colleague confirmed in a recent email, “From the engineering standpoint, there are many definitions of the damage scales, but from years of working with structural engineers, I think the consensus is now to use a three-tier scale – destroyed, heavily damaged, and others (non-visible damage).”
That said, field-based surveys of disaster damage typically overlook damage caused to roofs since on-the-ground surveyors are bound by the laws of gravity. Hence the importance of satellite imagery. At the same time, however, “The primary problem is the vertical perspective of [satellite imagery, which] largely limits the building information to the roofs. This roof information is well suited for the identification of extreme damage states, that is completely destroyed structures or, to a lesser extent, undamaged buildings. However, damage is a complex 3-dimensional phenomenon,” which means that “important damage indicators expressed on building façades, such as cracks or inclined walls, are largely missed, preventing an effective assessment of intermediate damage states” (Fernandez Galaretta et al. 2014).
This explains why “Oblique imagery [captured from UAVs] has been identified as more useful, though the multi-angle imagery also adds a new dimension of complexity” as we experienced first-hand during the World Bank’s UAV response to Cyclone Pam in Vanuatu (Ibid, 2014). Obtaining photogrammetric data for oblique images is particularly challenging. That is, identifying GPS coordinates for a given house pictured in an oblique photograph is virtually impossible to do automatically with the vast majority of UAV cameras. (Only specialist cameras using gimbal mounted systems can reportedly infer photogrammetric data in oblique aerial imagery, but even then it is unclear how accurate this inferred GPS data is). In any event, oblique data also “lead to challenges resulting from the multi-perspective nature of the data, such as how to create single damage scores when multiple façades are imaged” (Ibid, 2014).
To this end, my colleague Jorge Fernandez Galarreta and I are exploring the use of 3D (point clouds) to assess disaster damage. Multiple software solutions like Pix4D and PhotoScan can already be used to construct detailed point clouds from high-resolution 2D aerial imagery (nadir and oblique). “These exceed standard LiDAR point clouds in terms of detail, especially at façades, and provide a rich geometric environment that favors the identification of more subtle damage features, such as inclined walls, that otherwise would not be visible, and that in combination with detailed façade and roof imagery have not been studied yet” (Ibid, 2014).
Unlike oblique images, point clouds give surveyors a full 3D view of an urban area, allowing them to “fly through” and inspect each building up close and from all angles. One need no longer be physically onsite, nor limited to simply one façade or a strictly field-based view to determine whether a given building is partially damaged. But what does partially damaged even mean when this kind of high resolution 3D data becomes available? Take this recent note from a Bank colleague with 15+ years of experience in disaster damage assessments: “In the [Bank’s] official Post-Disaster Needs Assessment, the classification used is to say that if a building is 40% damaged, it needs to be repaired. In my view this is too vague a description and not much help. When we say 40%, is it the volume of the building we are talking about or the structural components?”
In their recent study, Fernandez Galaretta et al. used point clouds to generate per-building damage scores based on a 5-tiered classification scale (D1-D5). They chose to compute these damage scores based on the following features: “cracks, holes, intersection of cracks with load-carrying elements and dislocated tiles.” They also selected non-damage related features: “façade, window, column and intact roof.” Their results suggest that the visual assessment of point clouds is very useful to identify the following disaster damage features: total collapse, collapsed roof, rubble piles, inclined façades and more subtle damage signatures that are difficult to recognize in more traditional BDA [Building Damage Assessment] approaches. The authors were thus able to compute a per building damage score, taking into account both “the overall structure of the building,” and the “aggregated information collected from each of the façades and roofs of the building to provide an individual per-building damage score.”
Fernandez Galaretta et al. also explore the possibility of automating this damage assessment process based on point clouds. Their conclusion: “More research is needed to extract automatically damage features from point clouds, combine those with spectral and pattern indicators of damage, and to couple this with engineering understanding of the significance of connected or occluded damage indictors for the overall structural integrity of a building.” That said, the authors note that this approach would “still suffer from the subjectivity that characterizes expert-based image analysis.”
Hence my interest in using crowdsourcing to analyze point clouds for disaster damage. Naturally, crowdsourcing alone will not eliminate subjectivity. In fact, having more people analyze point clouds may yield all kinds of disparate results. This is explains why a detailed and customized imagery interpretation guide is necessary; like this one, which was just released by my colleagues at the Harvard Humanitarian Initiative (HHI). This also explains why crowdsourcing platforms require quality-control mechanisms. One easy technique is triangulation: have ten different volunteers look at each point cloud and tag features in said cloud that show cracks, holes, intersection of cracks with load-carrying elements and dislocated tiles. Surely more eyes are better than two for tasks that require a good eye for detail.
Next, identify which features have the most tags—this is the triangulation process. For example, if one area of a point cloud is tagged as a “crack” by 8 or more volunteers, chances are there really is a crack there. One can then count the total number of distinct areas tagged as cracks by 8 or more volunteers across the point cloud to calculate the total number of cracks per façade. Do the same with the other metrics (holes, dislocated titles, etc.), and you can compute a per building damage score based on overall consensus derived from hundreds of crowdsourced tags. Note that “tags’ can also be lines or polygons; meaning that individual cracks could be traced by volunteers, thus providing information on the approximate lengths/size of a crack. This variable could also be factored in the overall per-building damage score.
In sum, crowdsourcing could potentially overcome some of the data quality issues that have already marked field-based damage assessment surveys. In addition, crowdsourcing could potentially speed up the data analysis since professional imagery and GIS analysts tend to already be hugely busy in the aftermath of major disasters. Adding more data to their plate won’t help anyone. Crowdsourcing the analysis of 3D point clouds may thus be our best bet.
So why hasn’t this all been done yet? For several reasons. For one, creating very high-resolution point clouds requires more pictures and thus more UAV flights, which can be time consuming. Second, processing aerial imagery to construct point clouds can also take some time. Third, handling, sharing and hosting point clouds can be challenging given how large those files quickly get. Fourth, no software platform currently exists to crowdsource the annotation of point clouds as described above (particularly when it comes to the automated quality control mechanisms that are necessary to ensure data quality). Fifth, we need more robust imagery interpretation guides. Sixth, groups like the UN and the World Bank are still largely thinking in 2D rather than 3D. And those few who are considering 3D tend to approach this from a data visualization angle rather than using human and machine computing to analyze 3D data. Seventh, this area, point cloud analysis for 3D feature detection, is still a very new area of research. Many of the methodology questions that need answers have yet to be answered, which is why my team and I at QCRI are starting to explore this area from the perspective of computer vision and machine learning.
The holy grail? Combining crowdsourcing with machine learning for real-time feature detection of disaster damage in 3D point clouds rendered in real-time via airborne UAVs surveying a disaster site. So what is it going to take to get there? Well, first of all, UAVs are becoming more sophisticated; they’re flying faster and for longer and will increasingly be working in swarms. (In addition, many of the new micro-UAVs come with a “follow me” function, which could enable the easy and rapid collection of aerial imagery during field assessments). So the first challenge described above is temporary as are the second and third challenges since computer processing power is increasing, not decreasing, over time.
This leaves us with the software challenge and imagery guides. I’m already collaborate with HHI on the latter. As for the former, I’ve spoken with a number of colleagues to explore possible software solutions to crowdsource the tagging of point clouds. One idea is simply to extend MicroMappers. Another is to add simple annotation features to PLAS.io and PointCloudViz since these platforms are already designed to visualize and interact with point clouds. A third option is to use a 3D model platform like SketchFab, which already enables annotations. (Many thanks to colleague Matthew Schroyer for pointing me to SketchFab last week). I’ve since had a long call with SketchFab and am excited by the prospects of using this platform for simple point cloud annotation.
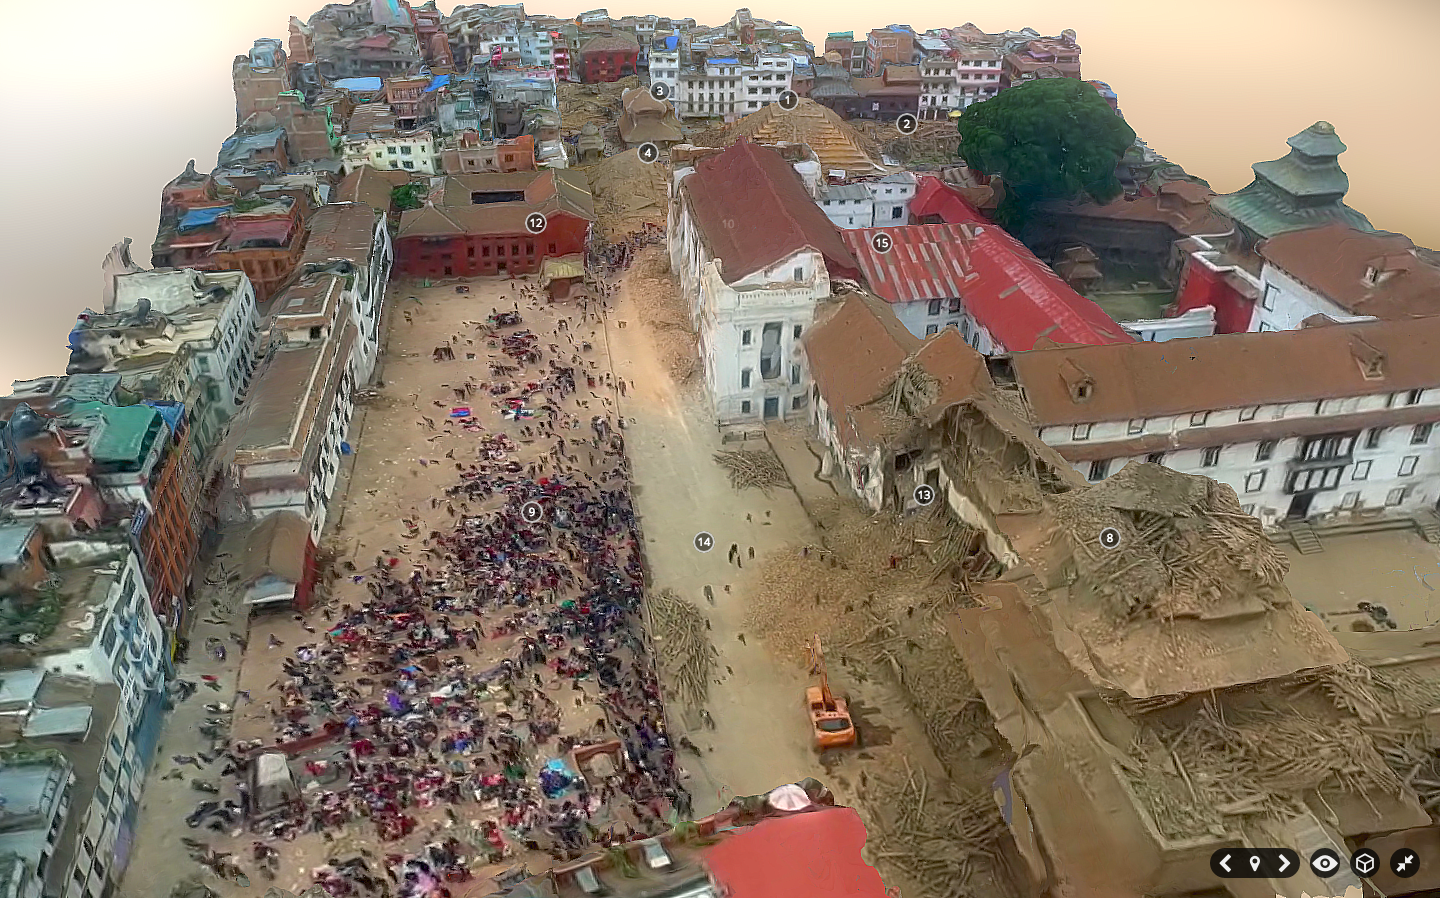
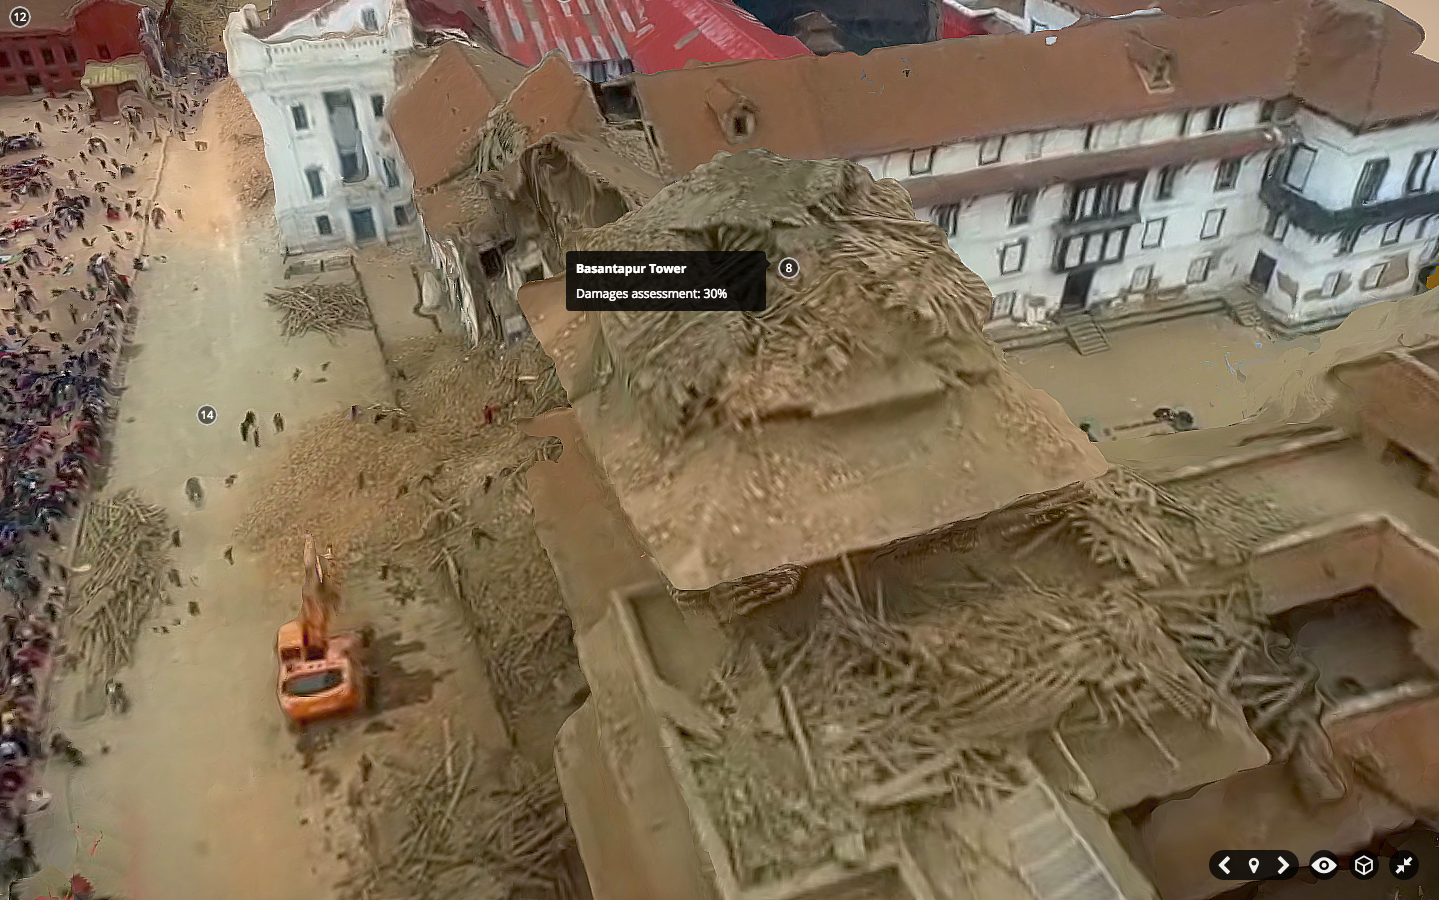
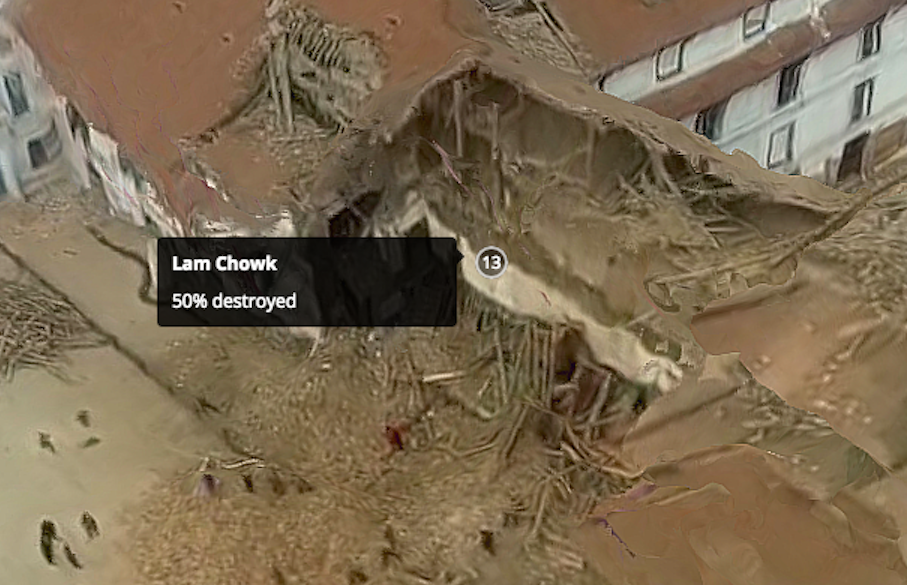
In fact, Matthew already used SketcFab to annotate a 3D model of Durbar Square neighborhood in downtown Kathmandu post-earthquake. He found an aerial video of the area, took multiple screenshots of this video, created a point cloud from these and then generated a 3D model which he annotated within SketchFab. This model, pictured below, would have been much higher resolution if he had the original footage or 2D images. Click pictures to enlarge.
Here’s a short video with all the annotations in the 3D model:
And here’s the link to the “live” 3D model. And to drive home the point that this 3D model could be far higher resolution if the underlying imagery had been directly accessible to Matthew, check out this other SketchFab model below, which you can also access in full here.
The SketchFab team has kindly given me a SketchFab account that allows up to 50 annotations per 3D model. So I’ll be uploading a number of point clouds from Vanuatu (post Cyclone Pam) and Nepal (post earthquakes) to explore the usability of SketchFab for crowdsourced disaster damage assessments. In the meantime, one could simply tag-and-number all major features in a point cloud, create a Google Form, and ask digital volunteers to rate the level of damage near each numbered tag. Not a perfect solution, but one that works. Ultimately, we’d need users to annotate point clouds by tracing 3D polygons if we wanted a more easy way to use the resulting data for automated machine learning purposes.
In any event, if readers do have any suggestions on other software platforms, methodologies, studies worth reading, etc., feel free to get in touch via the comments section below or by email, thank you. In the meantime, many thanks to colleagues Jorge, Matthew, Ferda & Ji (QCRI), Salvador (PointCloudViz), Howard (PLAS.io) and Corentin (SketchFab) for the time they’ve kindly spent brainstorming the above issues with me.
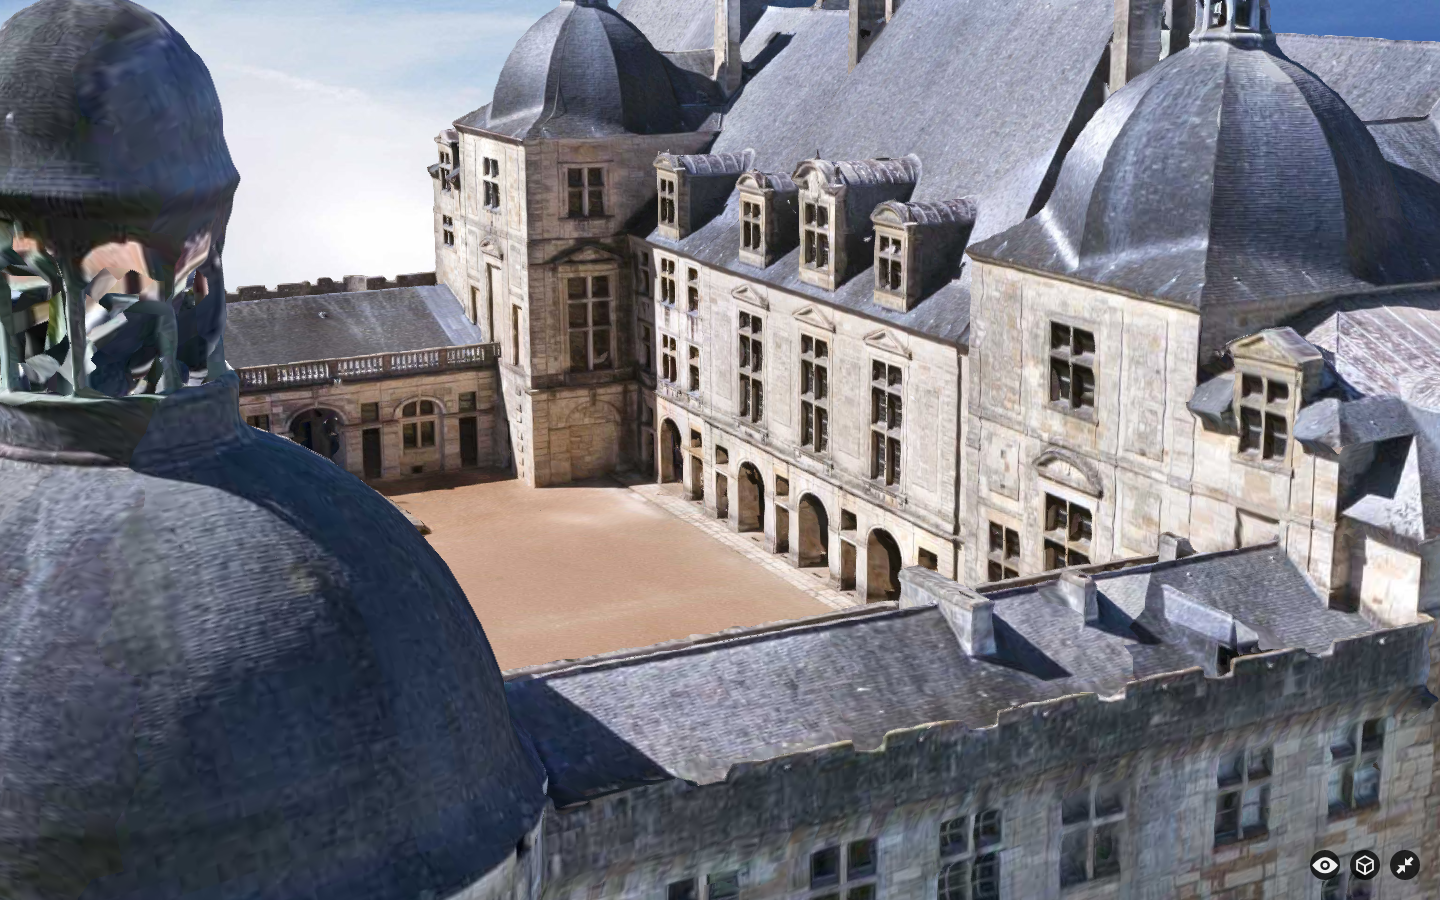
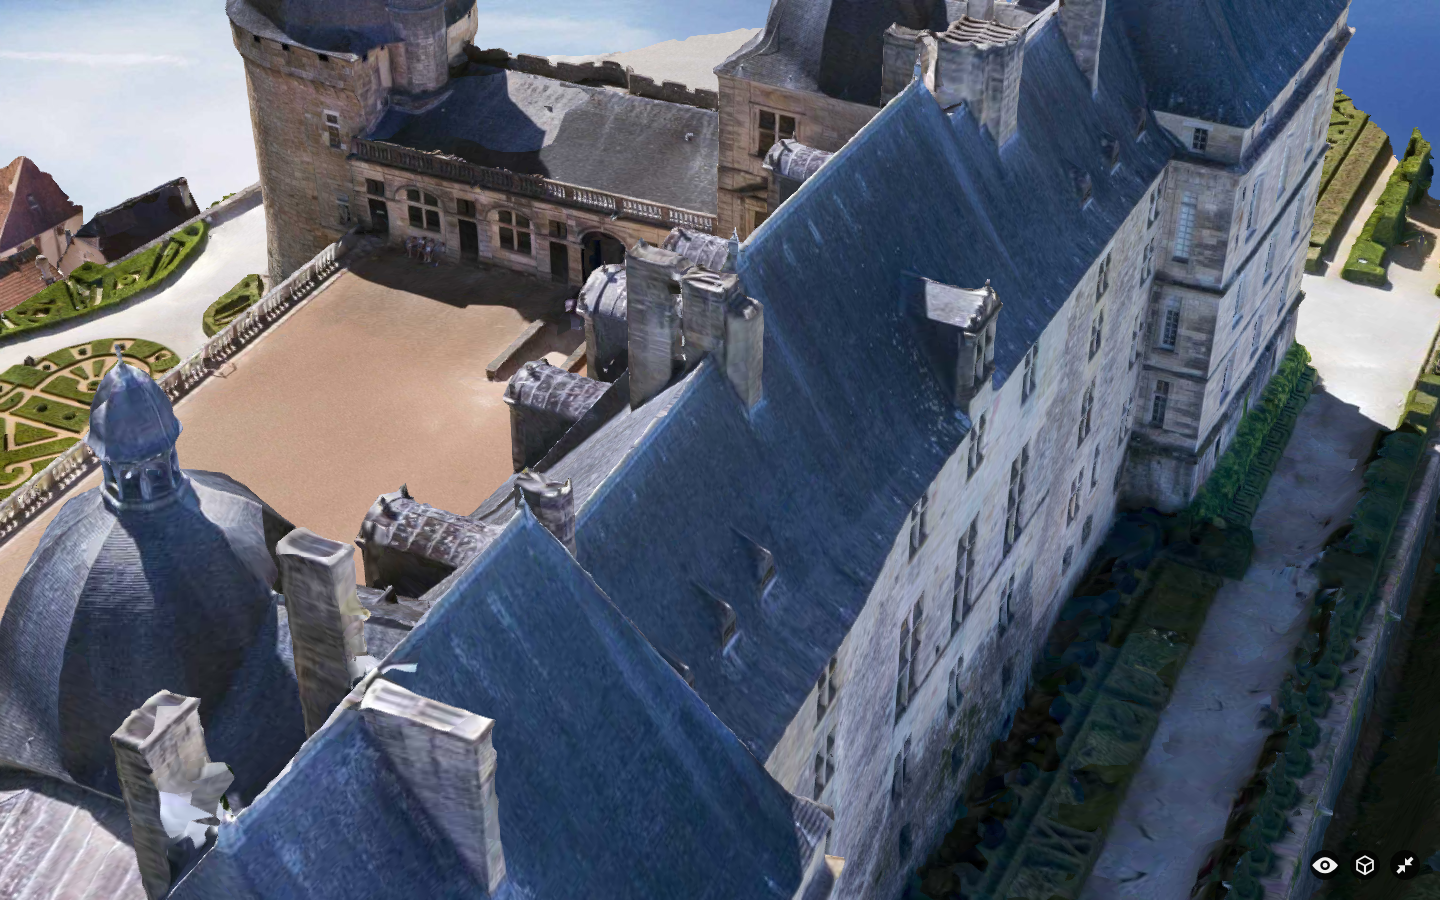
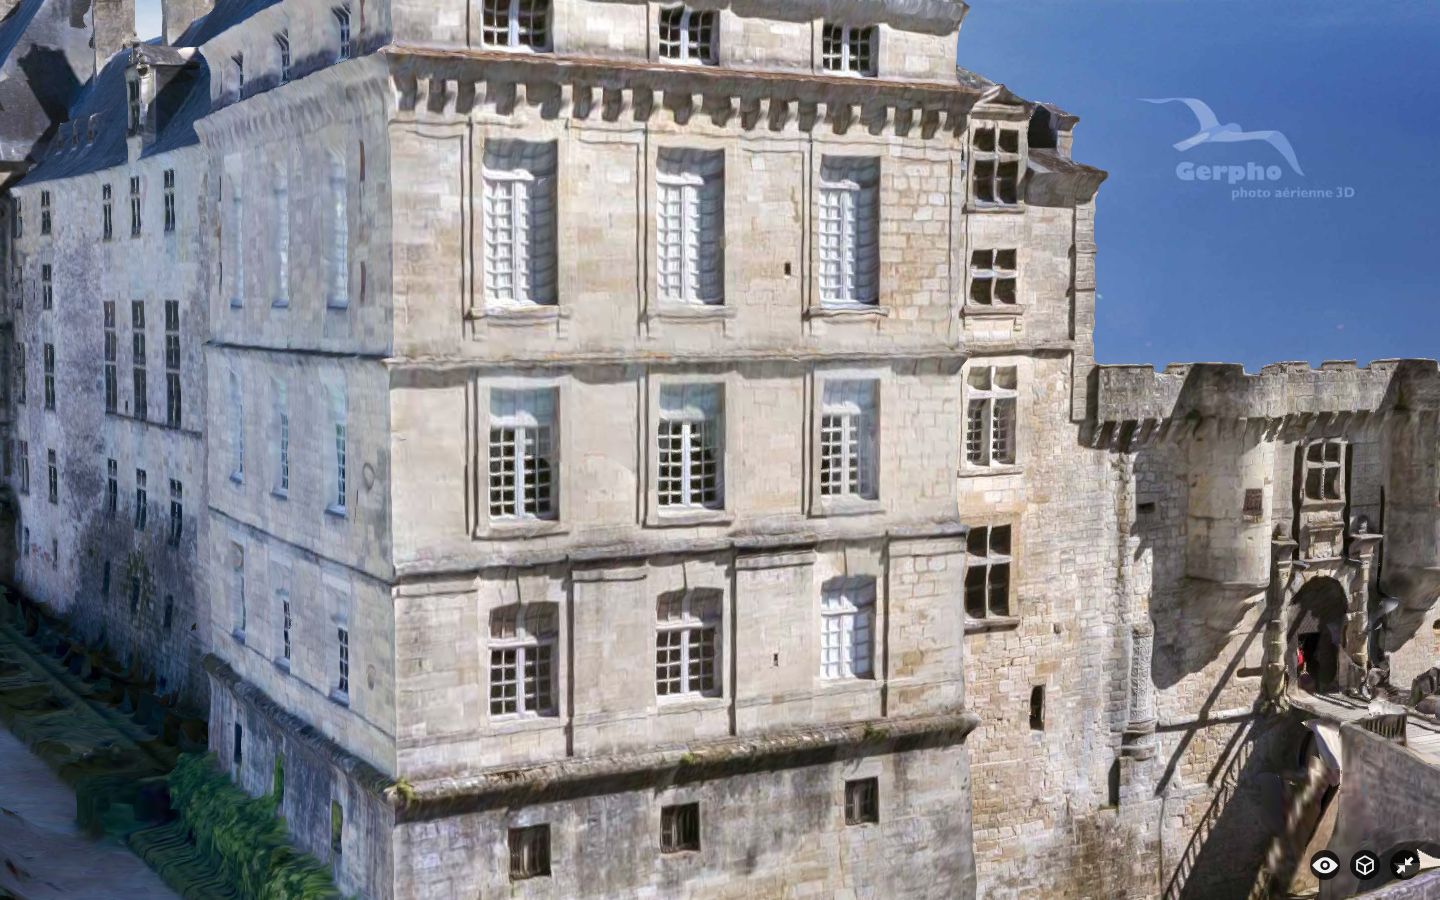
Point Clouds, or 3D models derived from high resolution aerial imagery, are in fact nothing new. Several software platforms already exist to reconstruct a series of 2D aerial images into fully fledged 3D-fly-through models. Check out these very neat examples from my colleagues at Pix4D and SenseFly:
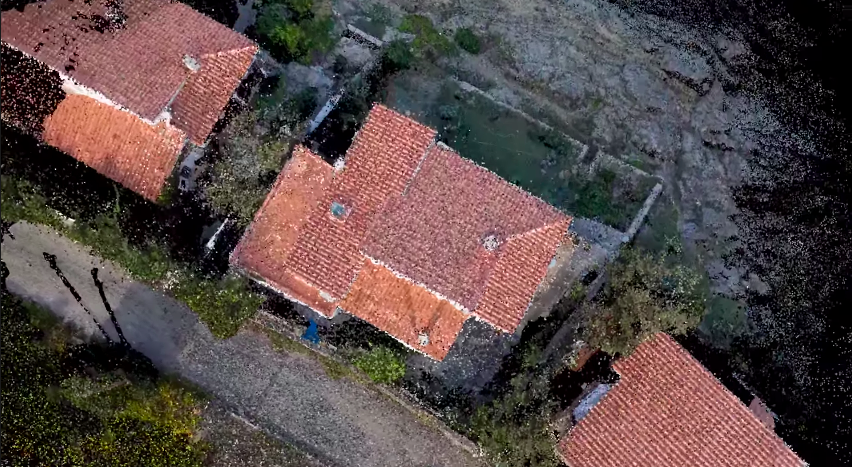
What does a castle, Jesus and a mountain have to do with humanitarian action? As noted in my previous blog post, there’s only so much disaster damage one can glean from nadir (that is, vertical) imagery and oblique imagery. Lets suppose that the nadir image below was taken by an orbiting satellite or flying UAV right after an earthquake, for example. How can you possibly assess disaster damage from this one picture alone? Even if you had nadir imagery for these houses before the earthquake, your ability to assess structural damage would be limited.
This explains why we also captured oblique imagery for the World Bank’s UAV response to Cyclone Pam in Vanuatu (more here on that humanitarian mission). But even with oblique photographs, you’re stuck with one fixed perspective. Who knows what these houses below look like from the other side; your UAV may have simply captured this side only. And even if you had pictures for all possible angles, you’d literally have 100’s of pictures to leaf through and make sense of.
What’s that famous quote by Henry Ford again? “If I had asked people what they wanted, they would have said faster horses.” We don’t need faster UAVs, we simply need to turn what we already have into Point Clouds, which I’m indeed hoping to do with the aerial imagery from Vanuatu, by the way. The Point Cloud below was made only from single 2D aerial images.
It isn’t perfect, but we don’t need perfection in disaster response, we need good enough. So when we as humanitarian UAV teams go into the next post-disaster deployment and ask what humanitarians they need, they may say “faster horses” because they’re not (yet) familiar with what’s really possible with the imagery processing solutions available today. That obviously doesn’t mean that we should ignore their information needs. It simply means we should seek to expand their imaginations vis-a-vis the art of the possible with UAVs and aerial imagery. Here is a 3D model of a village in Vanuatu constructed using 2D aerial imagery:
Now, the title of my blog post does lead with the word crowdsourcing. Why? For several reasons. First, it takes some decent computing power (and time) to create these Point Clouds. But if the underlying 2D imagery is made available to hundreds of Digital Humanitarians, we could use this distributed computing power to rapidly crowdsource the creation of 3D models. Second, each model can then be pushed to MicroMappers for crowdsourced analysis. Why? Because having a dozen eyes scrutinizing one Point Cloud is better than 2. Note that for quality control purposes, each Point Cloud would be shown to 5 different Digital Humanitarian volunteers; we already do this with MicroMappers for tweets, pictures, videos, satellite images and of course aerial images as well. Each digital volunteer would then trace areas in the Point Cloud where they spot damage. If the traces from the different volunteers match, then bingo, there’s likely damage at those x, y and z coordinate. Here’s the idea:
We could easily use iPads to turn the process into a Virtual Reality experience for digital volunteers. In other words, you’d be able to move around and above the actual Point Cloud by simply changing the position of your iPad accordingly. This technology already exists and has for several years now. Tracing features in the 3D models that appear to be damaged would be as simple as using your finger to outline the damage on your iPad.
What about the inevitable challenge of Big Data? What if thousands of Point Clouds are generated during a disaster? Sure, we could try to scale our crowd-sourcing efforts by recruiting more Digital Humanitarian volunteers, but wouldn’t that just be asking for a “faster horse”? Just like we’ve already done with MicroMappers for tweets and text messages, we would seek to combine crowdsourcing and Artificial Intelligence to automatically detect features of interest in 3D models. This sounds to me like an excellent research project for a research institute engaged in advanced computing R&D.
I would love to see the results of this applied research integrated directly within MicroMappers. This would allow us to integrate the results of social media analysis via MicroMappers (e.g, tweets, Instagram pictures, YouTube videos) directly with the results of satellite imagery analysis as well as 2D and 3D aerial imagery analysis generated via MicroMappers.
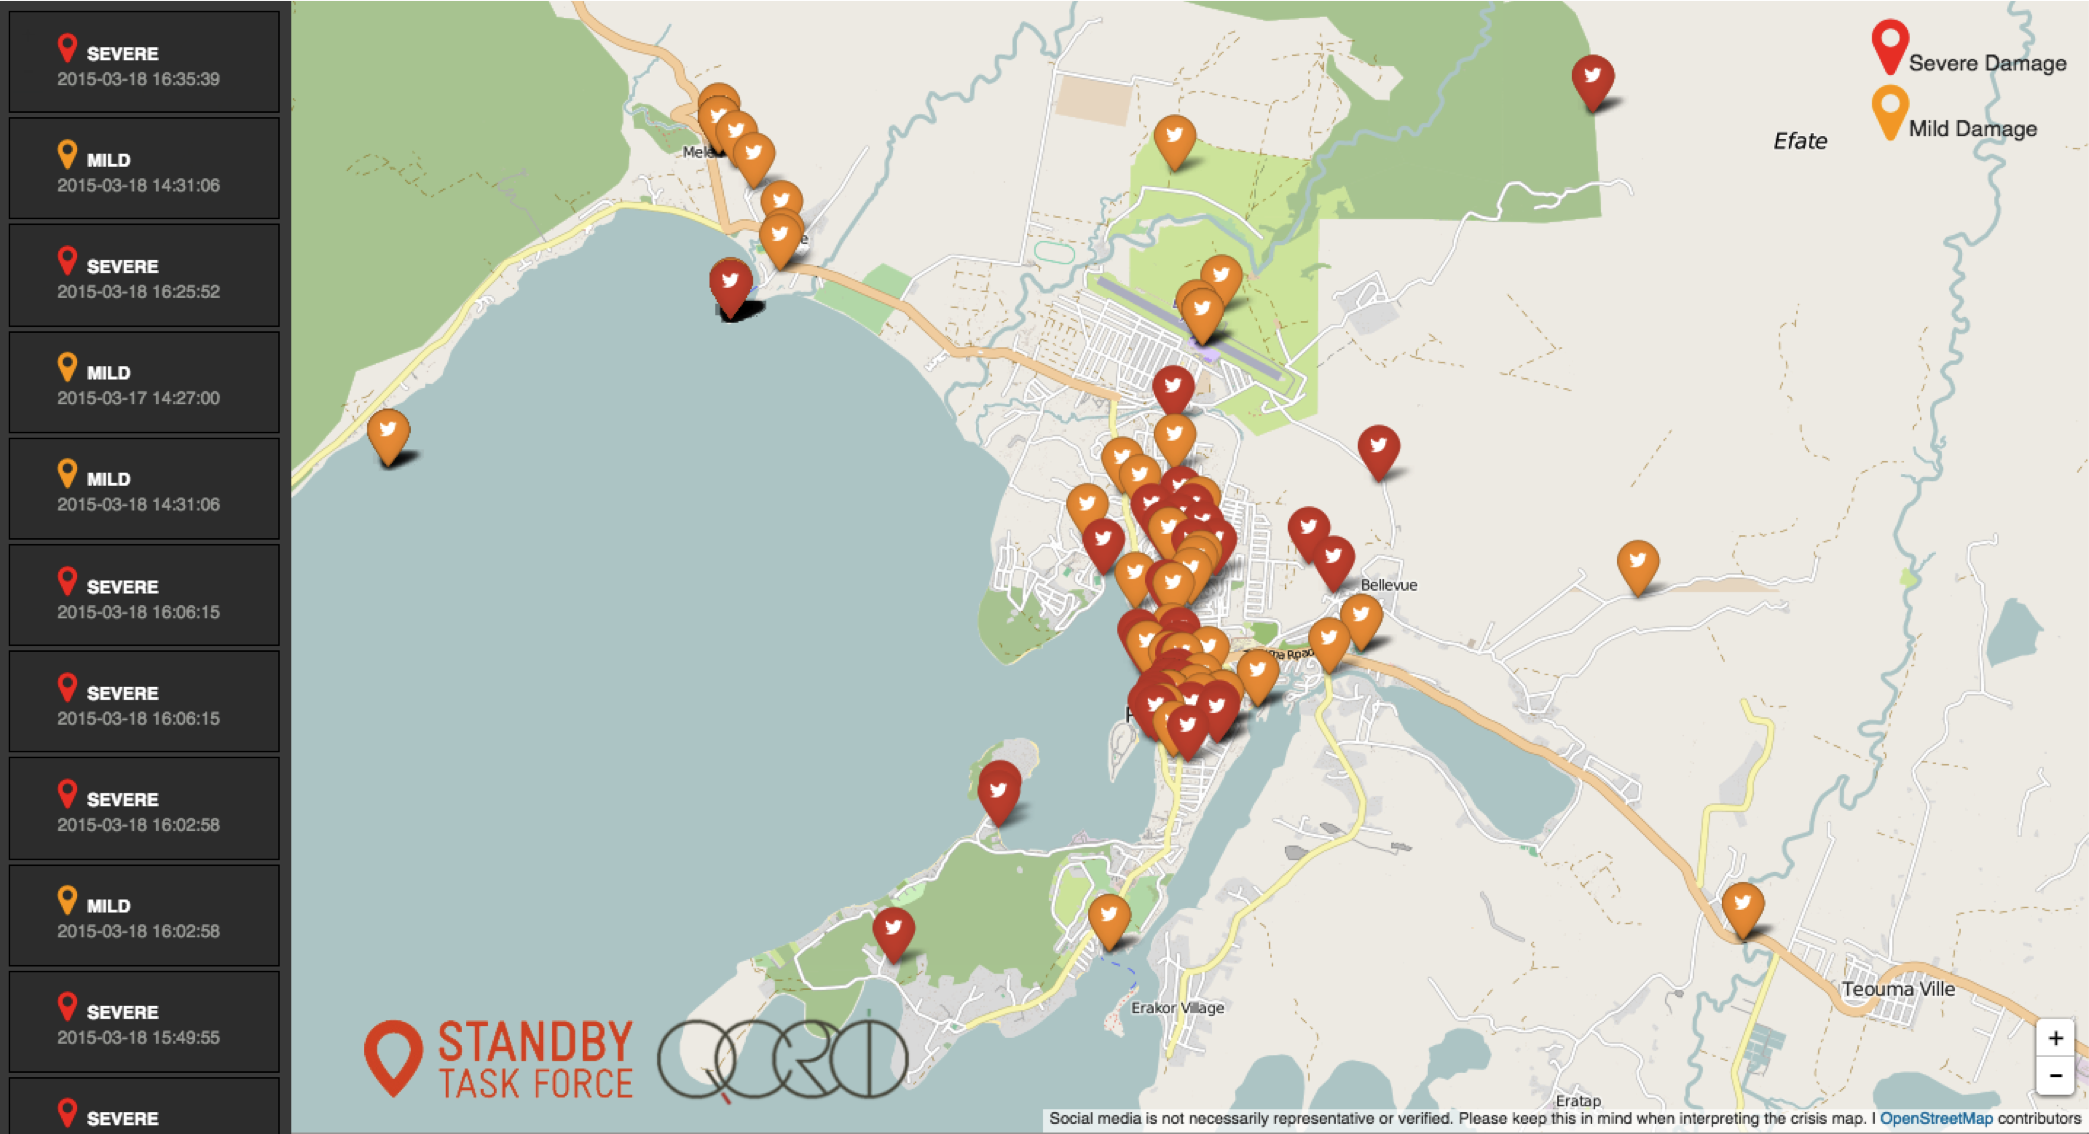
Digital Humanitarians sprung to action just hours after the Category 5 Cyclone collided with Vanuatu’s many islands. This first deployment focused on rapidly assessing the damage by analyzing multimedia content posted on social media and in the mainstream news. This request came directly from the United Nations (OCHA), which activated the Digital Humanitarian Network (DHN) to carry out the rapid damage assessment. So the Standby Task Force (SBTF), a founding member of the DHN, used QCRI′s MicroMappers platform to produce a digital, interactive Crisis Map of some 1,000+ geo-tagged pictures of disaster damage (screenshot below).
Within days of Cyclone Pam making landfall, the World Bank (WB) activated the Humanitarian UAV Network (UAViators) to quickly deploy UAV pilots to the affected islands. UAViators has access to a global network of 700+ professional UAV pilots is some 70+ countries worldwide. The WB identified two UAV teams from the Humanitarian UAV Network and deployed them to capture very high-resolution aerial photographs of the damage to support the Government’s post-disaster damage assessment efforts. Pictures from these early UAV missions are available here. Aerial images & videos of the disaster damage were also posted to the UAViators Crowdsourced Crisis Map.
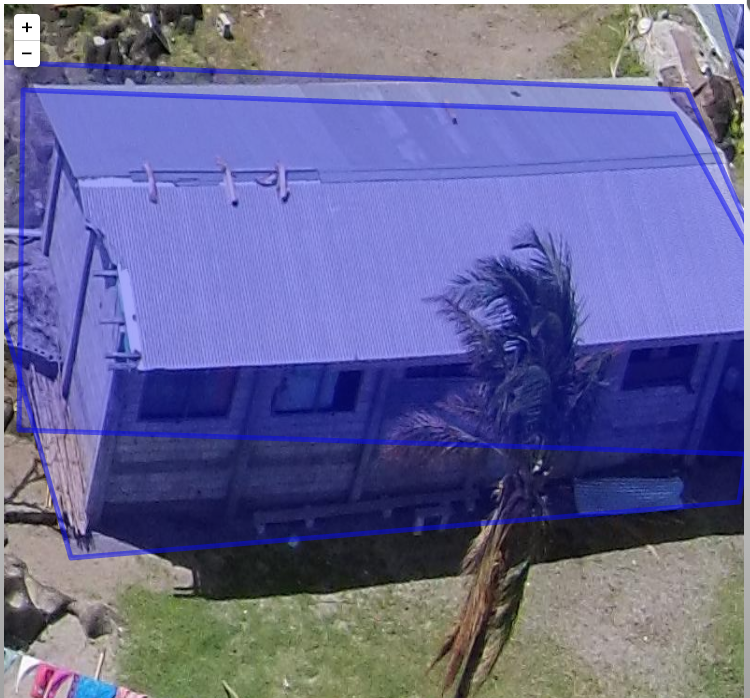
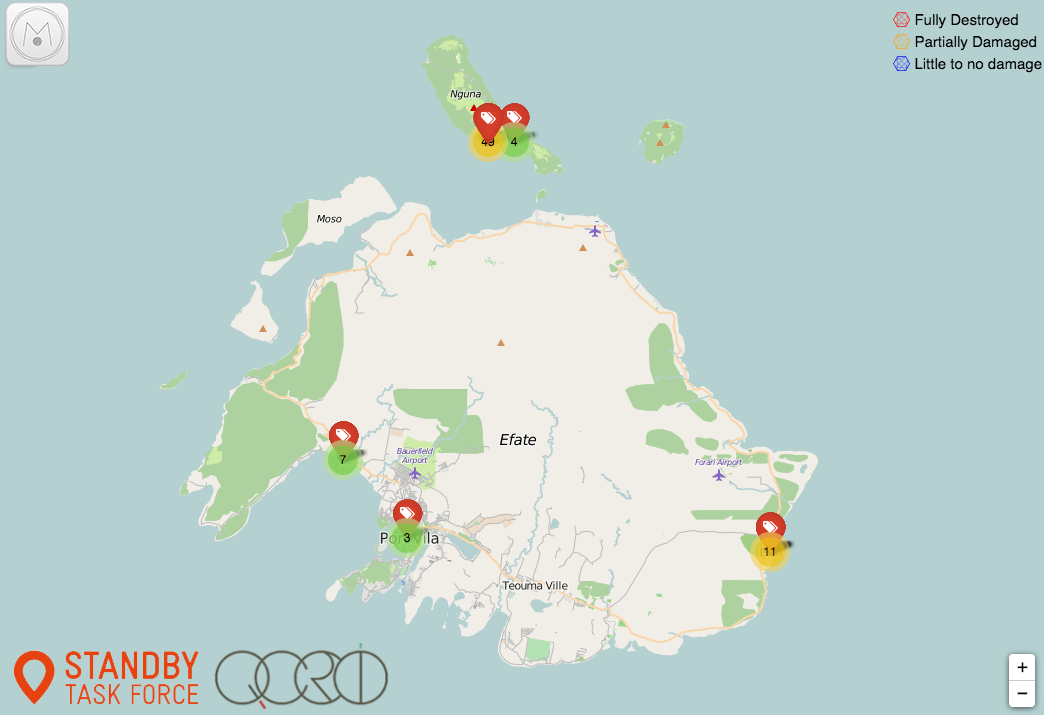
Last week, the World Bank activated the DHN (for the first time ever) to help analyze the many, many GigaBytes of aerial imagery from Vanuatu. So Digital Jedis from the DHN are now using Humanitarian OpenStreetMap (HOT) and MicroMappers (MM) to crowdsource the search for partially damaged and fully destroyed houses in the aerial imagery. The OSM team is specifically looking at the “nadir imagery” captured by the UAVs while MM is exclusively reviewing the “oblique imagery“. More specifically, digital volunteers are using MM to trace destroyed houses red, partially damaged houses orange, and using blue to denote houses that appear to have little to no damage. Below is an early screenshot of the Aerial Crisis Map for the island of Efate. The live Crisis Map is available here.
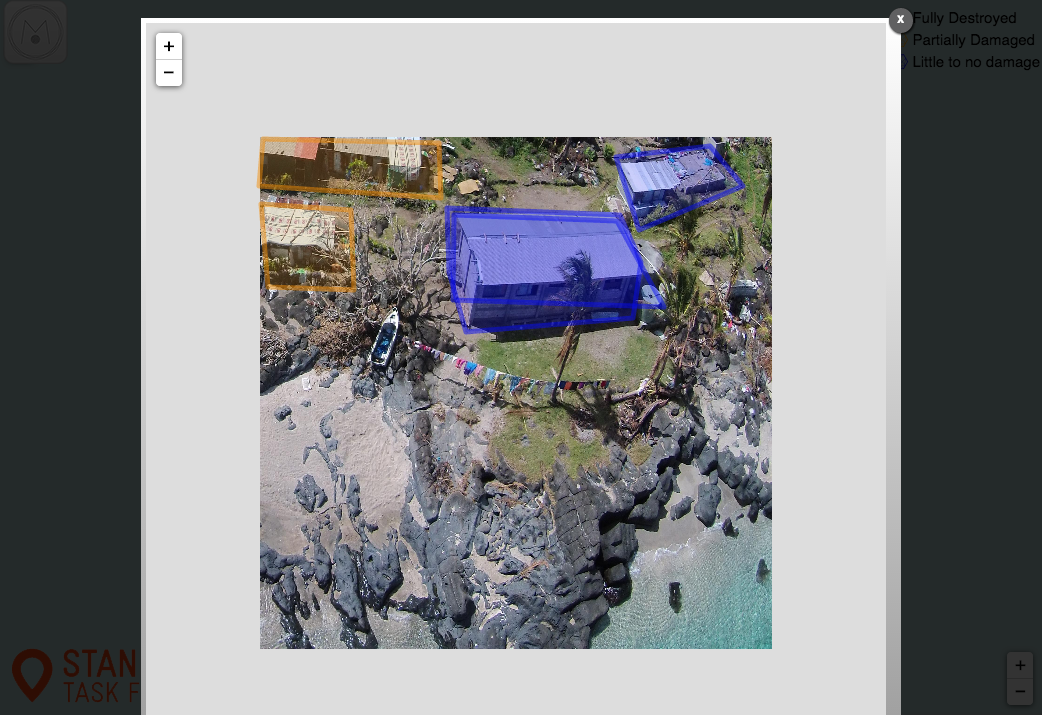
Clicking on one of these markers will open up the high resolution aerial pictures taken at that location. Here, two houses are traced in blue (little to no damage) and two on the upper left are traced in orange (partial damage expected).
The cameras on the UAVs captured the aerial imagery in very high resolution, as you can see from the close up below. You’ll note two traces for the house. These two traces were done by two independent volunteers (for the purposes of quality control). In fact, each aerial image is shown to at least 3 different Digital Jedis.
Once this MicroMappers deployment is over, we’ll be using the resulting traces to create automated featured detection algorithms; just like we did here for the MicroMappers Namibia deployment. This approach, combining crowdsourcing with Artificial Intelligence (AI), is explored in more detail here vis-a-vis disaster response. The purpose of taking this hybrid human-machine computing solution is to accelerate (semi-automate) future damage assessment efforts.
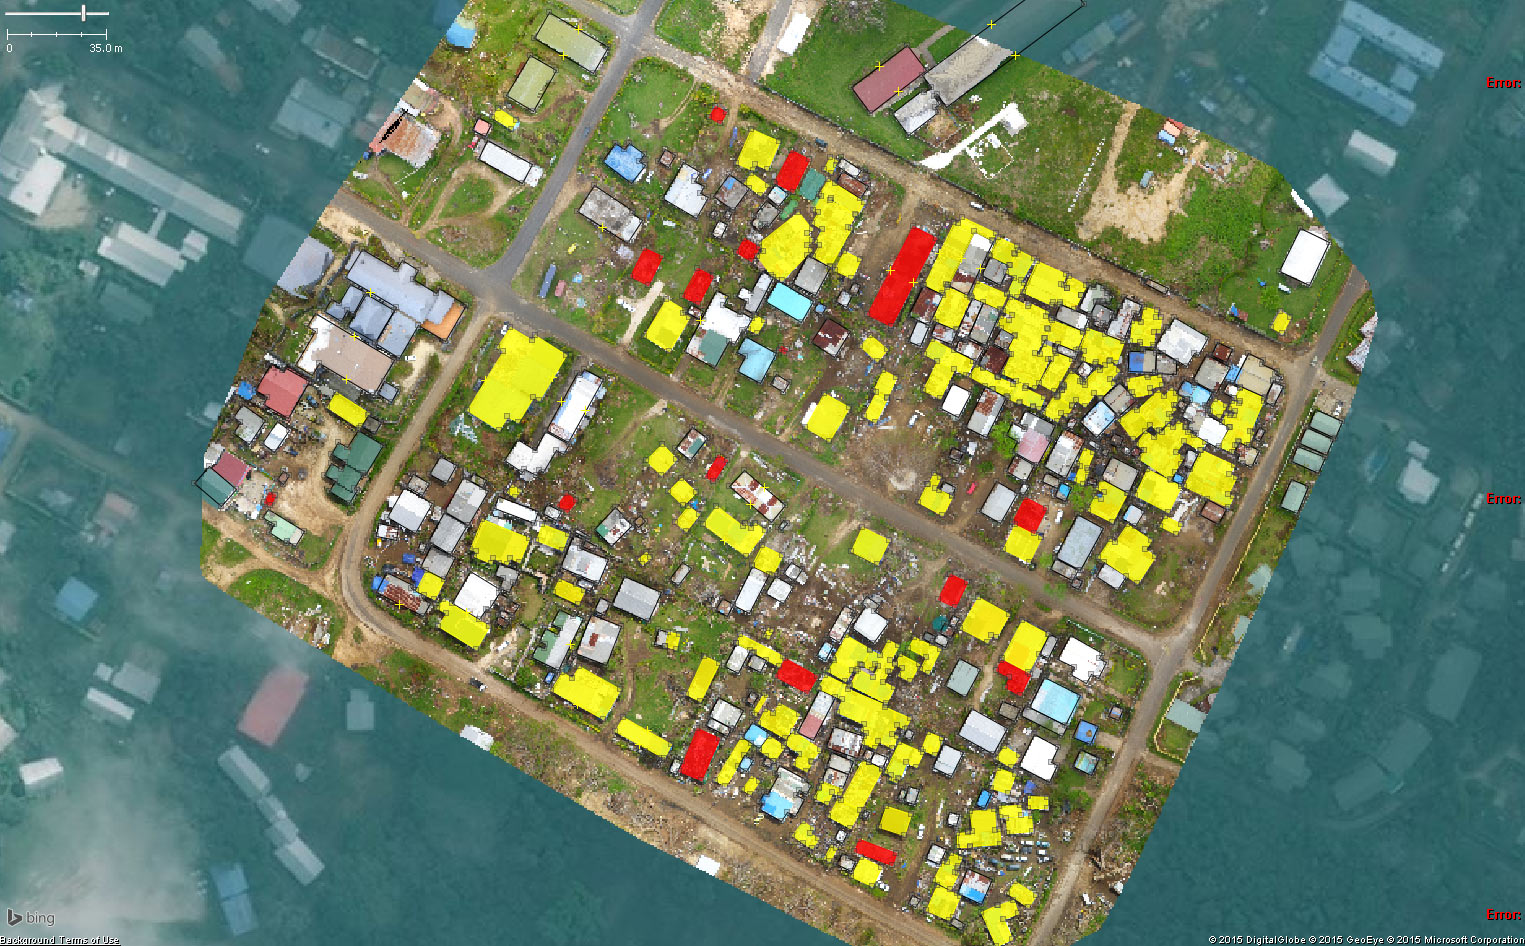
Meanwhile, back in Vanuatu, the HOT team has already carried out some tentative, preliminary analysis of the damage based on the aerial imagery provided. They are also up-dating their OSM maps of the affected islands thanks this imagery. Below is an initial damage assessment carried out by HOT for demonstration purposes only. Please visit their deployment page on the Vanuatu response for more information.
So what’s next? Combining both the nadir and oblique imagery to interpret disaster damage is ultimately what is needed, so we’re actually hoping to make this happen (today) by displaying the nadir imagery directly within the Aerial Crisis Map produced by MicroMappers. (Many thanks to the MapBox team for their assistance on this). We hope this integration will help HOT and our World Bank partners better assess the disaster damage. This is the first time that we as a group are doing anything like this, so obviously lots of learning going on, which should improve future deployments. Ultimately, we’ll need to create 3D models (point clouds) of disaster affected areas (already easy to do with high-resolution aerial imagery) and then simply use MicroMappers to crowdsource the analysis of these 3D models.
And here’s a 3D model of a village in Vanuatu constructed using 2D aerial photos taken by UAV:
For now, though, Digital Jedis will continue working very closely with the World Bank to ensure that the latter have the results they need in the right format to deliver a comprehensive damage assessment to the Government of Vanuatu by the end of the week. In the meantime, if you’re interested in learning more about digital humanitarian action, then please check out my new book, which features UAViators, HOT, MM and lots more.
Aéroport de Port Vila – Bauerfield International Airport. As we land, thousands of uprooted trees could be seen in almost every direction.
Massive roots were not enough to save these trees from Cyclone Pam. The devastation reminds us how powerful nature is.
After getting clearance from the Australian Defense Force (ADF), we pack up our UAVs and head over to La Lagune for initial tests. Close collaboration with the military is an absolute must for humanitarian UAV missions. UAVs cannot operate in Restricted Operations Zones without appropriate clearance.
We’re in Vanuatu by invitation of the Government’s National Disaster Risk Management Office (NDMO). So we’re working very closely with our hosts to assess disaster damage and resulting needs. The government and donors need the damage quantified to assess how much funding is necessary for the recovery efforts; and where geographically that funding should be targeted.
Ceci n’est pas un drone; what we found at La Lagune, where the ADF has set up camp. At 2200 every night we send the ADF our flight plan clearance requests for the following day. For obvious safety reasons, we never deviate from these plans after they’ve been approved.
Unpacking and putting together the hexacopters can take a long time. The professional and certified UAV team from New Zealand (X-Craft) follows strict operational check lists to ensure safety and security. We also have a professional and certified team from Australia, Heliwest, which will be flying quadcopters. The UAV team from SPC is also joining our efforts. I’m proud to report that both the Australian & New Zealand teams were recruited directly from the pilot roster of the Humanitarian UAV Network.
The payload (camera) attached to our hexacopters; not exactly a GoPro. We also have other sensors for thermal imaging, etc.
Programming the test flights. Here’s a quick video intro on how to program UAVs for autonomous flights.
Night falls fast in Vanuatu…
… So our helpful drivers kindly light up our work area.
After flawless test flights; we’re back at “HQ” to program the flight paths for tomorrow morning’s humanitarian UAV missions. The priority survey areas tend to change on a daily basis as the government gets more information on which outlying islands have been hardest hit. Our first mission will focus on an area comprised of informal settlements.
Dawn starts to break at 0500. We haven’t gotten much sleep.
At 0600, we arrive at the designated meeting point, the Beach Bar. This will be our base of operations for this morning’s mission.
The flight plans for the hexacopters are ready to go. We have clearance from Air Traffic Control (ATC) to fly until 0830 as manned aircraft start operating extensively after 0900. So in complex airspaces like this one in Vanuatu’s Port Vila, we only fly very early in the morning and after 1700 in the evening. We have ATC’s direct phone number and are in touch with the tower at all times.
Could this be the one and only SXSW 2015 bag in Vanuatu?
All our multirotor UAVs have been tested once again and are now ready to go. The government has already communicated to nearby villages that UAVs will be operating between 0630-0830. We aim to collect aerial imagery at a resolution of 4cm-6cm throughout our missions.
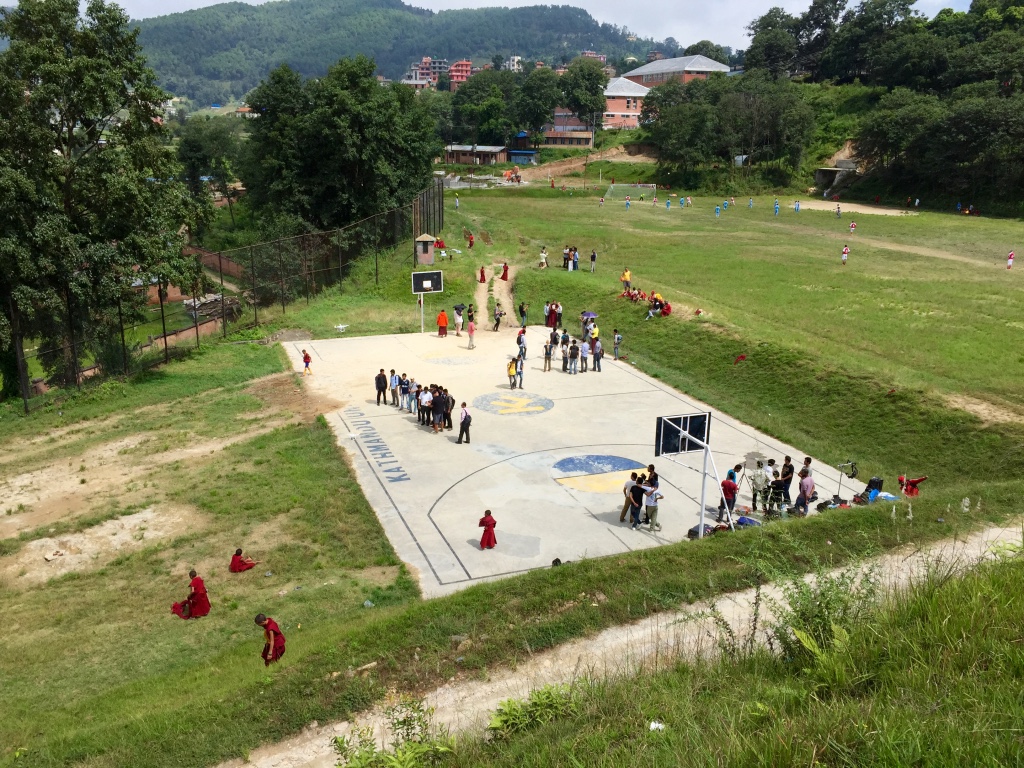
An old basketball court; perfect for take-off & landing.
And of course, when we’re finally ready to fly, it starts to pour. Other challenges include an ash cloud from a nearby volcano. We’ve also been told that kids here are pro’s with slingshots (which is one reason why the government informed local villagers of the mission; i.e., to request that kids not use the UAVs for target practice).
After some delays, we are airborne at last.
Operating the UAViators DJI Phantom…
… Which I’m using purely for documentary purposes. In coming days, we’ll be providing our government partners with a hands-on introduction on how to operate Phantom II’s. Building local capacity is key; which is why this action item is core to the Humanitarian UAV Network’s Code of Conduct.
Can you spot the hexacopter? While there’s only one in the picture below, we actually have two in the air at different altitudes which we are operating by Extended Line of Site and First Person View as a backup.
More aerial shots I took using the Phantom (not for damage assessment; simply for documentary purposes).
Can you spot the basketball court?
Large clouds bring back the rain; visibility is reduced. We have to suspend our flights; will try again after 1700.
Meanwhile, my Phantom’s GoPro snaps this close up picture on landing.
Stay tuned for updates and in particular the very high resolution aerial imagery that we’ll be posting to MapBox in coming days; along with initial analysis carried out by multiple partners including Humanitarian OpenStreetMap (HOT) and QCRI‘s MicroMappers. Many thanks to MapBox for supporting our efforts. We will also be overlaying the aerial imagery analysis over this MicroMappers crisis map of ground-based pictures of disaster damage in order to triangulate the damage assessment results. Check out the latest update here.
In the meantime, more information on this Humanitarian UAV Mission to Vanuatu–spearheaded by the World Bank in very close collaboration with the Government and SPC–can be found on the Humanitarian UAV Network (UAViators) Ops page here. UAViators is an initiative I launched at QCRI following Typhoon Haiyan in the Philippines in 2013. More on UAViators and the use of humanitarian UAVs in my new book Digital Humanitarians.
Important: this blog post is a personal update written in my personal capacity; none of the above is in any way shape or form a formal communique or press release by any of the partners. Official updates will be provided by the Government of Vanuatu and World Bank directly. Please contact me here for official media requests; kindly note that my responses will need to be cleared by the Government & Bank first.
MicroMappers combines crowdsourcing and artificial intelligence to make sense of “Big Data” for Social Good. Why artificial intelligence (AI)? Because regular crowdsourcing alone is no match for Big Data. The MicroMappers platform can already be used to crowdsource the search for relevant tweets as well as pictures, videos, text messages, aerial imagery and soon satellite imagery. The next step is therefore to add artificial intelligence to this crowdsourced filtering platform. We have already done this with tweets and SMS. So we’re now turning our attention to aerial and satellite imagery.
Our very first deployment of MicroMappers for aerial imagery analysis was in Africa for this wildlife protection project. We crowdsourced the search for wild animals in partnership with rangers from the Kuzikus Wildlife Reserve based in Namibia. We were very pleased with the results, and so were the rangers. As one of them noted: “I am impressed with the results. There are at times when the crowd found animals that I had missed!” We were also pleased that our efforts caught the attention of CNN. As noted in that CNN report, our plan for this pilot was to use crowdsourcing to find the wildlife and to then combine the results with artificial intelligence to develop a set of algorithms that can automatically find wild animals in the future.
To do this, we partnered with a wonderful team of graduate students at EPFL, the well known polytechnique in Lausanne, Switzerland. While these students were pressed for time due to a number of deadlines, they were nevertheless able to deliver some interesting results. Their applied, computer vision research is particularly useful given our ultimate aim: to create an algorithm that can learn to detect features of interest in aerial and satellite imagery in near real-time (as we’re interested in applying this to disaster response and other time-sensitive events). For now, however, we need to walk before we can run. This means carrying out the tasks of crowdsourcing and artificial intelligence in two (not-yet-integrated) steps.
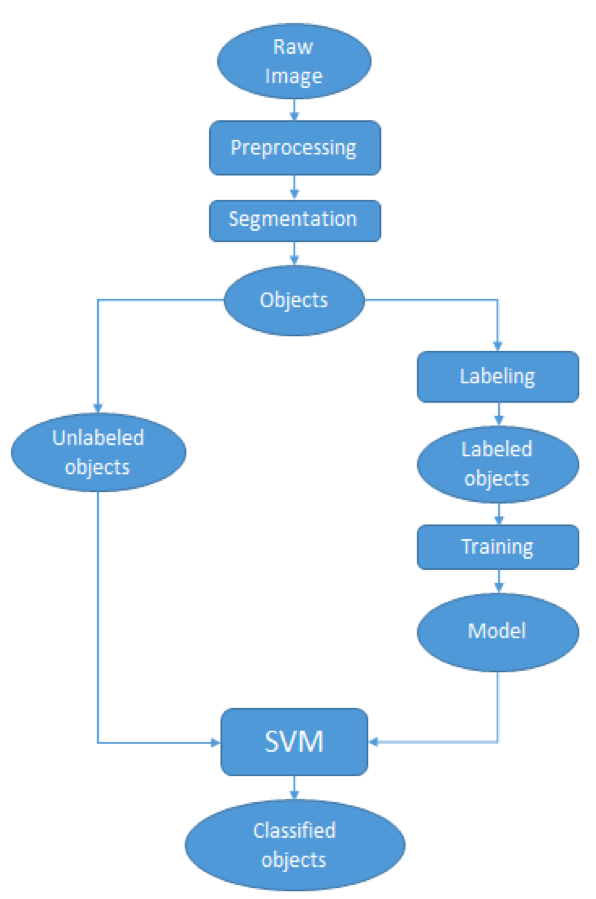
As the EPFL students rightly note in their preliminary study, the use of thermal imaging (heat detection) to automatically identify wildlife in the bush is some-what problematic since “the temperature difference between animals and ground is much lower in savannah […].” This explains why the research team used the results of our crowdsourcing efforts instead. More specifically, they focused on automatically detecting the shadows of gazelles and ostriches by using an object based support vector machine (SVM). The whole process is summarized below.
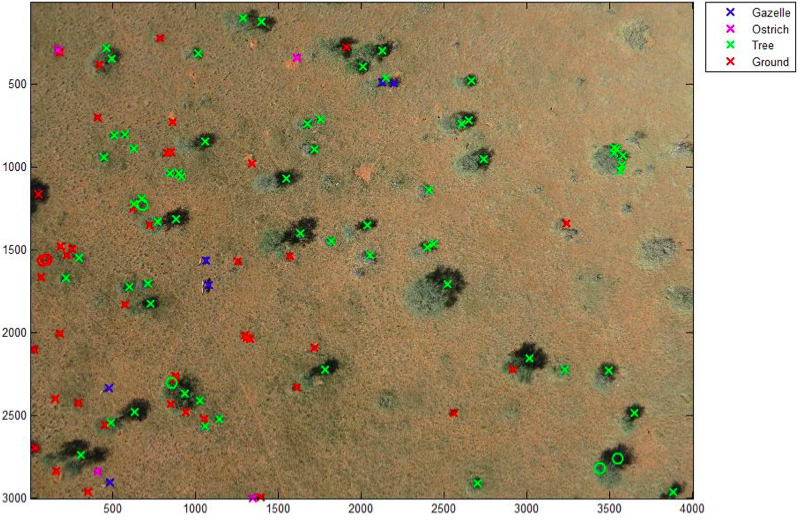
The above method produces results like the one below (click to enlarge). The circles represents the objects used to train the machine learning classifier. The discerning reader will note that the algorithm has correctly identified all the gazelles save for one instance in which two gazelles were standing close together were identified as one gazelle. But no other objects were mislabeled as a gazelle. In other words, EPFL’s gazelle algorithm is very accurate. “Hence the classifier could be used to reduce the number of objects to assess manually and make the search for gazelles faster.” Ostriches, on the other hand, proved more difficult to automatically detect. But the students are convinced that this could be improved if they had more time.
In conclusion, more work certainly needs to be done, but I am pleased by these preliminary and encouraging results. In addition, the students at EPFL kindly shared some concrete features that we can implement on the MicroMappers side to improve the crowdsourced results for the purposes of developing automated algorithms in the future. So a big thank you to Briant, Millet and Rey for taking the time to carry out the above research. My team and I at QCRI very much look forward to continuing our collaboration with them and colleagues at EPFL.
In the meantime, more on all this in my new book, Digital Humanitarians: How Big Data is Changing the Face of Humanitarian Response, which has already been endorsed by faculty at Harvard, MIT, Stanford, Oxford, etc; and by experts at the UN, World Bank, Red Cross, Twitter, etc.
My research team and I at the Humanitarian UAV Network (UAViators) have compiled a list of more than 30 common software platforms used to operate UAVs and analyze resulting aerial imagery. We carried out this research to provide humanitarian organizations with a single repository where they can review existing software platforms (including free & open source solutions) for their humanitarian UAV missions. The results, available here, provide a brief description of each software platform along with corresponding links for additional information and download. We do realize that this list is not (yet) comprehensive, so we hope you’ll help us fill remaining gaps. This explains why we’ve made our research available as an open, editable Google Doc.
Many thanks to my research assistant Peter Mosur for taking the lead on this. We have additional research documents available here on the UAViators website.
See also:
Humanitarian UAV Network: Strategy for 2014-2015 [link]
Humanitarians in the Sky: Using UAVs for Disaster Response [link]
Low-Cost UAV Applications for Post-Disaster Damage Assessments: A Streamlined Workflow [Link]
I thrive when working across disciplines, building diverse cross-cutting coalitions to create, translate and apply innovative strategies driven by shared values. This has enabled the 20+ organizations I’ve worked with, and those I’ve led, to accelerate meaningful and inclusive social impact.
Which is why I've been called a social entrepreneur and a translational leader by successful innovators. President Clinton once called me a digital pioneer, while recent colleagues describe me as kind, dedicated, values-driven, authentic, creative, ethical, and impactful.