The Biggest Problem with “Crisis Maps”

I enjoy thinking about the different analogies one can use to describe crisis mapping. I’ve likened crisis mapping to the Nascza Lines here and to cymatics here, for example. In a recent interview with Reuters/Alertnet (published here), I used the following analogy:

“Crisis mapping is to the humanitarian space what x-rays are to emergency rooms.”

I wanted to find an analogy that would steer clear of technical jargon and capture the public’s imagination. I thought through several analogies before the interview. For example, I debated using Magnetic Resonance Imaging (MRI) as analogy instead of x-rays since, well, it’s a more accurate comparison.

Why?

Have a look at the first minute of this rather amusing video, which first shows some x-ray pictures and then MRI scans.

MRI scans provide “quantitative, real-time, thermal images of the treated area” (1). All x-rays do is display static, albeit still useful, information. It’s a bit like comparing today’s high-speed digital video cameras with the cameras of bygone days that produced black and white photographs.

I thought about these analogies again this evening while walking home from MIT’s conference on data visualization. That’s when something very obvious dawned on me. The biggest problem with crisis maps is the word “maps”. The majority of the world’s population including myself associate maps with printed maps—no thanks to pirates.

Source: artfiles.art.com

Source: artfiles.art.com

The term “animated map” almost seems like an oxymoron, much like the word “airbus” must have come across when the company was founded 40 years ago. For you fellow Harry Potter fans, perhaps the best way to describe what I’m trying to convey is by referring to The Daily Prophet, the magical newspaper whose articles include moving pictures. Or perhaps the magical Marauder’s map which tracks the movement of students and teachers at Hogwarts in real-time.

Source: newlaunches.com

Source: newlaunches.com

Fictional protagonists aside, Albert Einstein was spot on when he wrote:

Imagination is more important than knowledge. For knowledge is limited to all we now know and understand, while imagination embraces the entire world, and all there ever will be to know and understand.”

We know a lot about maps but if we were to play the word association game we’d likely come up with static descriptions rather than words associated with moving pictures. The time slider feature on Google Earth is perhaps starting to shift people’s conception of maps. Hans Rosling‘s work with Gapminder is also stirring our imagination since he talks about time series data much like a sports commentator describes a horse race (see his really neat TED talk here).
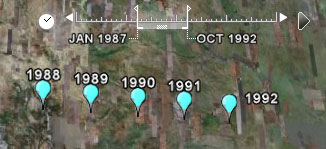
source: google earth

source: google earth

But we’re even more trapped by our archaic conception of maps than we realize. Playing the word association game with the word “map” may conjure Google Earth’s time slider for a few neogeographers, but I doubt that anyone would blurt out “3D!” for example. And yet, that’s what some of us crisis mappers are increasingly thinking about.

Google invited me to participate in a full-day workshop at their DC office last week and sure enough they told us to expect that all structures (e.g., buildings, mountains) on Google Earth would be rendered in 3D within about 2 years. The team is looking to integrate Mapmaker, My Maps, and Sketch-Up with Google Earth. And we already know they have a great flight simulator.

Source: gizmodo

Source: gizmodo

Now compare the above screenshot of Google Earth with a screenshot of Simcity 4 below. And then, of course, there’s also Second Life, and more recently live video integrated into Google Earth.

SimCity4

In the meantime, the most accurate 3D map of any city on Earth has just been created using very high resolution lasers—some 7 million individual points of light to be exact. You could call this the best MRI of a terrestrial city yet!

I’ve already blogged about crisis maps evolving into 3D virtual worlds with live data feeds and agent-based models for scenario development, simulation and forecasting:

  • 3D Crisis Mapping for Disaster Simulation Training (link)
  • GeoTime: Visual Crisis Mapping in 3D (link)

All these systems are part of the evolving info webs I recently blogged about. But the italicized attributes above hardly come to mind when we hear the word map. And I think this is biggest problem with the term “crisis maps.” Perhaps we should come up with an entirely new term. But coming back to my interview with Reuters/Alertnet, a new more accurate term would simply add more technical jargon and definitely lose the public’s imagination (and mine with it).

So I’ve got an alternative “solution” … maybe. We keep the word map, or rather M.A.P.S. Yes, that’s right “Crisis MAPS.” All we need now is to be as creative as InSTEDD and find a way to fit this acronym with something sensible.

So how’s this?

Crisis MAPS = Crisis Movies and Platform Simulations
Patrick Philippe Meier

The Biggest Problem with “Crisis Maps”

I enjoy thinking about the different analogies one can use to describe crisis mapping. I’ve likened crisis mapping to the Nascza Lines here and to cymatics here, for example. In a recent interview with Reuters/Alertnet (published here), I used the following analogy:

“Crisis mapping is to the humanitarian space what x-rays are to emergency rooms.”

I wanted to find an analogy that would steer clear of technical jargon and capture the public’s imagination. I thought through several analogies before the interview. For example, I debated using Magnetic Resonance Imaging (MRI) as analogy instead of x-rays since, well, it’s a more accurate comparison.

Why?

Have a look at the first minute of this rather amusing video, which first shows some x-ray pictures and then MRI scans.

MRI scans provide “quantitative, real-time, thermal images of the treated area” (1). All x-rays do is display static, albeit still useful, information. It’s a bit like comparing today’s high-speed digital video cameras with the cameras of bygone days that produced black and white photographs.

I thought about these analogies again this evening while walking home from MIT’s conference on data visualization. That’s when something very obvious dawned on me. The biggest problem with crisis maps is the word “maps”. The majority of the world’s population including myself associate maps with printed maps—no thanks to pirates.

The term “animated map” almost seems like an oxymoron, much like the word “airbus” must have come across when the company was founded 40 years ago. For you fellow Harry Potter fans, perhaps the best way to describe what I’m trying to convey is by referring to The Daily Prophet, the magical newspaper whose articles include moving pictures. Or perhaps the magical Marauder’s map which tracks the movement of students and teachers at Hogwarts in real-time.

Source: newlaunches.com

Source: newlaunches.com

Fictional protagonists aside, Albert Einstein was spot on when he wrote:

Imagination is more important than knowledge. For knowledge is limited to all we now know and understand, while imagination embraces the entire world, and all there ever will be to know and understand.”

We know a lot about maps but if we were to play the word association game we’d likely come up with static descriptions rather than words associated with moving pictures. The time slider feature on Google Earth is perhaps starting to shift people’s conception of maps. Hans Rosling‘s work with Gapminder is also stirring our imagination since he talks about time series data much like a sports commentator describes a horse race (see his really neat TED talk here).

source: google earth

source: google earth

But we’re even more trapped by our archaic conception of maps than we realize. Playing the word association game with the word “map” may conjure Google Earth’s time slider for a few neogeographers, but I doubt that anyone would blurt out “3D!” for example. And yet, that’s what some of us crisis mappers are increasingly thinking about.

Google invited me to participate in a full-day workshop at their DC office last week and sure enough they told us to expect that all structures (e.g., buildings, mountains) on Google Earth would be rendered in 3D within about 2 years. The team is looking to integrate Mapmaker, My Maps, and Sketch-Up with Google Earth. And we already know they have a great flight simulator.

Source: gizmodo

Source: gizmodo

Now compare the above screenshot of Google Earth with a screenshot of Simcity 4 below. And then, of course, there’s also Second Life, and more recently live video integrated into Google Earth.

SimCity4

In the meantime, the most accurate 3D map of any city on Earth has just been created using very high resolution lasers—some 7 million individual points of light to be exact. You could call this the best MRI of a terrestrial city yet!

I’ve already blogged about crisis maps evolving into 3D virtual worlds with live data feeds and agent-based models for scenario development, simulation and forecasting:

  • 3D Crisis Mapping for Disaster Simulation Training (link)
  • GeoTime: Visual Crisis Mapping in 3D (link)

All these systems are part of the evolving info webs I recently blogged about. But the italicized attributes above hardly come to mind when we hear the word map. And I think this is biggest problem with the term “crisis maps.” Perhaps we should come up with an entirely new term. But coming back to my interview with Reuters/Alertnet, a new more accurate term would simply add more technical jargon and definitely lose the public’s imagination (and mine with it).

So I’ve got an alternative “solution” … maybe. We keep the word map, or rather M.A.P.S. Yes, that’s right “Crisis MAPS.” All we need now is to be as creative as InSTEDD and find a way to fit this acronym with something sensible.

So how’s this?

Crisis MAPS = Crisis Movies and Platform Simulations

Patrick Philippe Meier

Behind the Scenes at the Crisis Mapping Conference

We are just five days away from launching the first International Conference on Crisis Mapping (ICCM 2009) but the seeds for this unique event were planted 15 months ago, on Facebook of all places.

My colleague Jen Ziemke and I had reconnected via Facebook where I had linked my status updates to my Twitter feed. I tweeted about my blog posts and this led Jen to this blog, iRevolution, where I published posts of crisis mapping. A few weeks later, I get a message from Jen in my Facebook inbox. She liked what I was writing on crisis mapping and asked if I’d be interested in co-organizing a small workshop on crisis mapping. The rest is history.

The idea to organize a workshop on crisis mapping was brilliant.

I had just completed two years of applied research on crisis mapping at the Harvard Humanitarian Initiative (HHI). The next logical step was indeed to hold a workshop to formalize the field of crisis mapping. We therefore drew on the taxonomy of crisis mapping I developed to inform the workshop’s agenda.

We originally envisaged 20-30 participants and received funding from the Open Society Institute (OSI) and the US Institute of Peace (USIP) to make this happen.

We soon had some 40 participants on our list, and then over 60 by the summer. This was no longer “workshop size” but an international conference in its own right. Humanitarian and human rights practitioners had signed on, as had leading scholars, software and technology developers, policy makers and major donors.

We chose to host ICCM 2009 at John Carroll University (JCU) in Cleveland,  which is where Jen is Professor of International Relations. Several factors contributed to this decision. First, the workshop idea was Jen’s to begin with (I just scaled it up); Second, we wanted to avoid the usual conference destinations and offer something different; and Third, JCU offered generous in-kind contributions and very kindly waived all overhead fees.

We plan to give participants a different kind of conference experience. Participating in MobileActive08 and particularly LIFT09 got me excited about conference design. Being a big fan of the TED and Pop!Tech conferences, I wanted to style them along those lines. This meant having Ignite Talks, a Tech Fair, Birds of a Feather Sessions and Open Roundtables. The key, I have learned, is to find the right balance between structured and unstructured time.

Humanity United (HU) saw the potential of ICCM 2009 and became the third official sponsor of the conference. This allowed us to expand the participant list to 80. Our collaboration with HU also gave us the opportunity to think post-ICCM 2009 in more detail.

Jen and I had talked strategy earlier in the year but this was with the assumption that the workshop would comprise 30 participants.

So we pondered this in early August and quickly realized that the incredible response to ICCM 2009 gave us a unique opportunity. Not only would the event be the first of it’s kind in the world in terms of focus, content and opportunities for collaboration and networking, but it would also serve to officially launch the field of crisis mapping in a very big way.

To be sure, with the majority of the world’s leading crisis mappers at the table, the conference presented an unprecedented opportunity to  define the future of the field.

As more high quality participants continued to sign up for the conference, we had to introduce registration fees to balance the budget which was already very tight. By mid-September, 100 conference participants had registered for ICCM 2009, a far cry from the original 30 we have envisaged. We were now starting to get overstretched in terms of space and facilities. And all throughout, it was just Jen and I trying to keep the ship on course.

We designed our strategy plan and rolled it out in September, adding a Twitter feed to ICCM 2009 which we have recently ramped up. We contacted several news organizations and have had some positive responses. We expect one or two articles in the mainstream media to reference the conference in the coming weeks.

Towards the end of September, we had little choice but to close off registration. This means a dozen late-arrivals were regrettably turned away. Neither Jen or I wanted to turn anyone away but we simply could not physically accommodate any more participants. One colleagues suggested that was a good problem to have.

So here we are, 5 days until show time. We’re busy with final preparations and excited to be welcoming some 100 participants to Cleveland (see this great NYT article on Cleveland). Participants from as far afield as New Zealand, Colombia and the Sudan are joining us for ICCM 2009. We look forward to kicking off the conference on Friday morning with the Ignite Talks.

The videos of the Ignite Talks will be uploaded to the ICCM website shortly after the conference. We look forward to a lot of user generated content via individual blogs and the conference blog as well as Twitter, Flickr, YouTube, Vimeo, etc. around ICCM. The hashtag for the conference is #ICCM09.

I hope this blog post gave you a good glimpse of ICCM 2009 behind the scenes. And while we haven’t yet started the conference, early explorations for a possible ICCM 2010 are already taking place.

Patrick Philippe Meier

Evolving a Global System of Info Webs

I’ve already blogged about what an ecosystem approach to conflict early warning and response entails. But I have done so with a country focus rather than thinking globally. This blog post applies a global perspective to the ecosystem approach given the proliferation of new platforms with global scalability.

Perhaps the most apt analogy here is one of food webs where the food happens to be information. Organisms in a food web are grouped into primary producers, primary consumers and secondary consumers. Primary producers such as grass harvest an energy source such as sunlight that they turn into biomass. Herbivores are primary consumers of this biomass while carnivores are secondary consumers of herbivores. There is thus a clear relationship known as a food chain.

This is an excellent video visualizing food web dynamics produced by researchers affiliated with the Santa Fe Institute (SFI):

Our information web (or Info Web) is also composed of multiple producers and consumers of information each interlinked by communication technology in increasingly connected ways. Indeed, primary producers, primary consumers and secondary consumers also crawl and dynamically populate the Info Web. But the shock of the information revolution is altering the food chains in our ecosystem. Primary consumers of information can now be primary producers, for example.

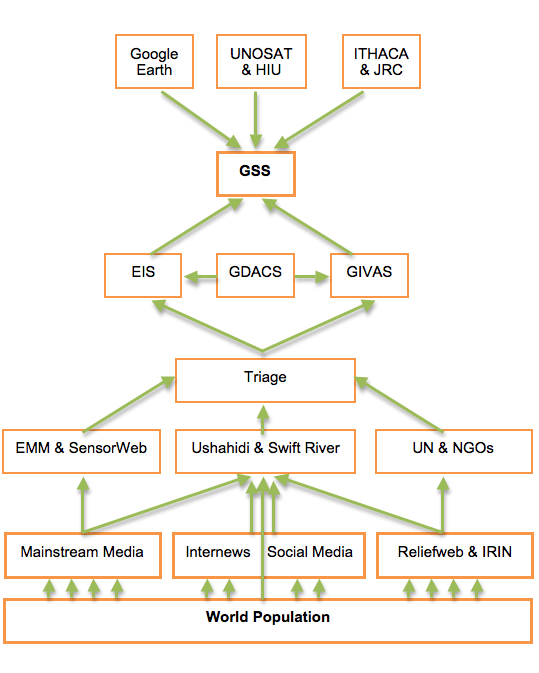
At the smallest unit of analysis, individuals are the most primary producers of information. The mainstream media, social media, natural language parsing tools, crowdsourcing platforms, etc, arguably comprise the primary consumers of that information. Secondary consumers are larger organisms such as the global Emergency Information Service (EIS) and the Global Impact and Vulnerability Alert System (GIVAS).

These newly forming platforms are at different stages of evolution. EIS and GIVAS are relatively embryonic while the Global Disaster Alert and Coordination Systems (GDACS) and Google Earth are far more evolved. A relatively new organism in the Info Web is the UAV as exemplified by ITHACA. The BrightEarth Humanitarian Sensor Web (SensorWeb) is further along the information chain while Ushahidi’s Crisis Mapping platform and the Swift River driver are more mature but have not yet deployed as a global instance.

InSTEDD’s GeoChat, Riff and Mesh4X solutions have already iterated through a number of generations. So have ReliefWeb and the Humanitarian Information Unit (HIU). There are of course additional organisms in this ecosystem, but the above list should suffice to demonstrate my point.

What if we connected these various organisms to catalyze a super organism? A Global System of Systems (GSS)? Would the whole—a global system of systems for crisis mapping and early warning—be greater than the sum of its parts? Before we can answer this question in any reasonable way, we need to know the characteristics of each organism in the ecosystem. These organisms represent the threads that may be woven into the GSS, a global web of crisis mapping and early warning systems.

Global System of Systems

Emergency Information Service (EIS) is slated to be a unified communications solution linking citizens, journalists, governments and non-governmental organizations in a seamless flow of timely, accurate and credible information—even when local communication infrastructures are rendered inoperable. This feature will be made possible by utilizing SMS as the communications backbone of the system.

In the event of a crisis, the EIS team would sift, collate, make sense of and verify the myriad of streams of information generated by a large humanitarian intervention. The team would gather information from governments, local media, the military, UN agencies and local NGOs to develop reporting that will be tailored to the specific needs of the affected population and translated into local languages. EIS would work closely with local media to disseminate messages of critical, life saving information.

Global Impact and Vulnerability Alert System (GIVAS) is being designed to closely monitor vulnerabilities and accelerate communication between the time a global crisis hits and when information reaches decision makers through official channels. The system is mandated to provide the international community with early, real-time evidence of how a global crisis is affecting the lives of the poorest and to provide decision-makers with real time information to ensure that decisions take the needs of the most vulnerable into account.

BrightEarth Humanitarian Sensor Web (SensorWeb) is specifically designed for UN field-based agencies to improve real time situational awareness. The dynamic mapping platform enables humanitarians to easily and quickly map infrastructure relevant for humanitarian response such as airstrips, bridges, refugee camps, IDP camps, etc. The SensorWeb is also used to map events of interest such as cholera outbreaks. The platform leverages mobile technology as well as social networking features to encourage collaborative analytics.

Ushahidi integrates web, mobile and dynamic mapping technology to crowdsource crisis information. The platform uses FrontlineSMS and can be deployed quickly as a crisis unfolds. Users can visualize events of interest on a dynamic map that also includes an animation feature to visualize the reported data over time and space.

Swift River is under development but designed to validate crowdsourced information in real time by combining machine learning for predictive tagging with human crowdsourcing for filtering purposes. The purpsose of the platform is to create veracity scores to denote the probability of an event being true when reported across several media such as Twitter, Online news, SMS, Flickr, etc.

GeoChat and Mesh4X could serve as the nodes connecting the above platforms in dynamic ways. Riff could be made interoperable with Swift River.

Can such a global Info Web be catalyzed? The question hinges on several factors the most important of which are probably awareness and impact. The more these individual organisms know about each other, the better picture they will have of the potential synergies between their efforts and then find incentives to collaborate. This is one of the main reasons I am co-organizing the first International Conference on Crisis Mapping (ICCM 2009) next week.

Patrick Philippe Meier

Is Crowdsourcing Really a Myth?

Dan Woods had an interesting piece in Forbes Magazine last month that labels crowdsourcing as a myth. As Dan puts it, the popular press and millions of people are deluded in thinking that “there is a crowd that solves problem better than individuals.”

Dan writes that…

  • The notion of crowds creating solutions appeals to our desire to believe that working together we can do anything, but in terms of innovation it is just ridiculous.
  • There is no crowd in crowdsourcing. There are only virtuosos, usually uniquely talented, highly trained people who have worked for decades in a field. […] From their fervent brains spring new ideas. The crowd has nothing to do with it. The crowd solves nothing, creates nothing.
  • What really happens in crowdsourcing as it is practiced in wide variety of contexts, from Wikipedia to open source to scientific research, is that a problem is broadcast to a large number of people with varying forms of expertise. Then individuals motivated by obsession, competition, money or all three apply their individual talent to creating a solution.
  • What bugs me is that misplaced faith in the crowd is a blow to the image of the heroic inventor. We need to nurture and fund inventors and give them time to explore, play and fail. A false idea of the crowd reduces the motivation for this investment, with the supposition that companies can tap the minds of inventors on the cheap.
  • Whatever term we use, let’s not call it crowdsourcing and pretend that 10,000 average Joes invent better products than Steve Jobs.

Dan certainly makes some valid points. But when Wired journalist Jeff Howe coined the term in 2006, he did so to differentiate the process from “outsourcing”, from whence the term crowdsourcing originates. In his own words, crowdsourcing describes a process when tasks are opened to anyone as a way “to tap the talent of the crowd.”

I looked up the definition of the word talent and sure enough the term can be used to describe both a person and a group. Clearly Dan takes issue with the semantics of the term crowdsourcing since he sees this as misleading and unfair to those who do most of the innovative work.

In context of the Internet, the 1 % rule or the 90-9-1 principle reflects an observation that “more people will lurk in a virtual community than will participate. This term is often used as a euphemism for participation inequality in the context of the Internet.” What is often overlooked, however, is that this 1% figure is one percent of a growing number given the increasing access to the Web around the world. So the 1% figure does constitute a crowd; a self-selected crowd for sure, but a crowd nevertheless.

In terms of innovation, new ideas are not isolated islands of thought. Ideas tend to ricochet off different minds. Innovation doesn’t occur in a vacuum; there is always context.

Why have have innovation labs otherwise? Why cluster in Silicon Valley?

While I certainly respect individual talent and absolutely believe that individuals should get credit for their work, I feel that Dan’s article is bent on establishing ownership and safeguarding proprietary rights, i.e., control. This stands in contrast to the crowdsourcing approach which has individuals contribute without controlling.

Perhaps elitesourcing is the term that the author would prefer? But as James Surowiecki notes in his best seller, “The Wisdom of the Crowds“:

Diversity and independence are important because the best collective decisions are the product of disagreement and contest, not consensus or compromise.

Under the right circumstances, groups are remarkably intelligent, and are often smarter than the smartest people in them. Groups do not need to be dominated by exceptionally intelligent people in order to be smart.

There is also confusion with respect to micro-motives and macro-behavior, or emergent behavior. Swarm intelligence also comes to mind. When we see a flock of birds seemingly “dancing” in the sky as if one entity, this is emergent behavior driven by local synchronization. Does this mean we value the individual birds any less? Of course not. When we say that “it takes a village to raise a child” do we devalue individual parents and family members? Surely not.

We credit the crowd because no one person lives in a vacuum and comes up with innovative ideas that are completely independent from their interaction with the outside world.

Patrick Philippe Meier

Communication and Human Development

The Berkman Center at Harvard University hosted a fascinating panel discussion figuring Amartya Sen, Michael Spence, Yochai Benkler and Clotilde Fonseca. The panelists addressed the role of communication and ICTs in human development, growth and poverty reduction.  They discussed what has changed, been learned, not been learned, needs to be learned, needs to be done most urgently.

Source: Berkman Center

Some brief notes and take-away’s:

  • Amatya Sen compared access to information via mobile phone to nutrition. Just like better nutrition may have adverse effects such as domestic violence, so does the mobile phone vis-a-vis the expansion of freedom. But this doesn’t mean we should abandon nutrition projects. Sen cautions against setting dichotomous priorities, e.g., development first or democracy first.
  • Michael Spence explained that the mobile phone as an important input in the production function of an economy. One principal concern resulting from the incredible growth in the mobile phone network is that regulators may react strongly to regulate this growth. Spencer adds that there is no silver bullet in development.
  • Clotilde Fonseca noted that the mobile phone is not yet a powerful device in the developing world; the distinction between voice and data is key. Most mobile phones in the developing world do not carry a high through-put of data. Clotilde cautions against applying a linear view of development to the ICT4D field. She adds that the digital divide is also a cognitive divide. There is also a capacity divide, i.e., the ability to absorb information.
  • Yochai Benkler remarked that the mobile phone tends towards more decentralized communication. That said, the question is more decentralized relative to what? Benkler also notes that not all solutions here have to be mobile. He also foresees many new opportunities for entrepreneurship in decentralized technology ecosystem ripe with tools, training and services.

For a very good, more detailed summary, please see my colleague Kate Brodock’s blog post here.

Patrick Philippe Meier

Facebook Fosters Political Engagement

I recently presented my dissertation research at the American Political Science Association (APSA) convention and attended a related panel entitled: “Internet: Collective Action, Social Mobilization, and Civic Engagement.” Jessica Feezell, one of the lecturers on the panel, presented her co-authored research paper (PDF) on ”Facebook and Political Engagement.”

Abstract. Can online groups help to foster political engagement among citizens?  We employ a multi-method design incorporating content analysis of political group pages and original survey research of university undergraduates (n = 455) to assess the quality of online political group discussion and effects of online group membership on political engagement measured through political knowledge and political participation surrounding the 2008 election.

We find through OLS and 2SLS multivariate regression analyses that participation in online political groups strongly predicts offline political participation by engaging members online.  However, we fail to confirm through 2SLS that there is a corresponding positive effect on political knowledge, likely due to low quality online group discussion.  This work contributes to an active dialogue on political usage of the Internet and civic engagement by further specifying forms of Internet use and corresponding effects.  Overall, we conclude that online groups perform many of the same positive civic functions as offline groups, specifically in terms of mobilizing political participation.

This study is an important contribution to the study of digital democracy. We need more empirical studies of this kind. My only concern is selection bias apparent in the research. The undergraduates surveyed by the authors were “students in three large political science classes.” In other words, this is a self-selected group of already politically interested individuals.

So the question remains: does Facebook foster political engagement in individuals that are not politically inclined to begin with? And related to my research: would the findings also hold true in countries under authoritarian rule, like Egypt?

Patrick Philippe Meier

Connectedness Unnecessary for Successful Mobilization

The latest issue of the American Journal of Political Science (AJPS) includes an insightful study entitled “Don’t Forget to Vote: Text Message Reminders as a Mobilization Tool.”

Co-authored by Allison Dale and Aaron Strauss, the study (PDF) suggests that connectedness is not a necessary condition for a successful mobilization campaign. “For certain voters, a noticeable reminder is sufficient to drive them to the polls.” What’s particularly interesting is that “impersonal text messages are as effective as other, more personal,  forms of voter mobilization.”

Abstract. Current explanations of effective voter mobilization strategies maintain that turnout increases only when a potential voter is persuaded to participate through increased social connectedness. The connectedness explanation does not take into account, however, that registered voters, by registering, have already signaled their interest in voting.

The theory presented in this article predicts that impersonal, noticeable messages can succeed in increasing the likelihood that a registered voter will turn out by reminding the recipient that Election Day is approaching. Text messaging is examined as an example of an impersonal, noticeable communication to potential voters.

A nationwide field experiment (n = 8,053) in the 2006 election finds that text message reminders produce a statistically significant 3.0 percentage point increase in the likelihood of voting. While increasing social connectedness has been shown to positively affect voter turnout, the results of this study, in combination with empirical evidence from prior studies, suggest that connectedness is not a necessary condition for a successful mobilization campaign. For certain voters, a noticeable reminder is sufficient to drive them to the polls.

One question that remains is whether this finding would hold true in countries under authoritarian rule.

Patrick Philippe Meier

Cymatic Insights for Crisis Mapping

I just came across Evan Grant’s fascinating TED 2009 talk on “Making Sound Visible through Cymatics.” Cymatics describes the process of visualizing sound. Sound waves create vibrations—patterns—that can be visualized on the surface of a plate covered with sand as depicted below.

cymatics

In his talk, Evan demonstrates how different sound frequencies create distinctly different geometric sand patterns. As the sound frequencies increase, so does the complexity of the sand patterns themselves. He describes cymatics as a “looking glass into a hidden world” that can “unveil the substance of things not seen.”

For example, a lexicon of dolphin language is actually being created using cymatics by visualizing the sonar beams that dolphins emit. Cymatics can also be used to create natural art forms. The picture below is a visualization of Beethoven’s 9th Symphony created using a cymatic device. Cymatics can also recreate archetypal forms of nature such as snowflakes or starfish.

cymatics3

It’s not entirely clear what all this means. As Evan notes, cymatics is still a very young field and not many people are working in this line of research. Cymatics shows that sound has form and can effect form in matter. So Evan asks us to think about the universe forming, “about the immense sound of the universe forming, and to ponder on that … perhaps cymatics had an influence on the formation of the universe itself.” Watch Evan’s 5-minute TED Talk below.

In closing, Evan encourage us to apply our passions, knowledge and skills to areas like cymatics. I find this field very interesting because of the analogies with crisis mapping. As often mentioned on iRevolution, crisis mapping is about rendering otherwise hidden patterns visible to improve situational awareness and decision-making.

One can think of conflict processes as sound waves or vibrations and the “plates” as crisis mapping platforms like Ushahidi. We need to “vibrate” conflict data at different frequencies and to develop visual analytics—different templates for data visualization—in order to visualize patterns in a compelling fashion. One might call this the “String Theory” of Crisis Mapping.

——————————————————————————————–

A colleague and I tried analyzing conflict data as music back in 2006 when I was at the Santa Fe Institute (SFI). I had been inspired by the work of an Italian geophysicist who had taken seismic data (tremblings of the earth) and analyzed the data as music in order to look for “melodic” patterns. We used conflict event-data from Afghanistan but the result was not particularly music to my ears—but then again, neither is war.

Patrick Philippe Meier

Transitions 2.0: Internet, Political Culture and Autocracy in Central Asia

I recently presented my dissertation research at the American Political Science Association (APSA) convention and attended a related panel entitled: “Internet: Collective Action, Social Mobilization, and Civic Engagement.” Eric McGlinchey, one of the professors on the panel, presented his research paper (PDF) on “Transitions 2.0: Internet, Political Culture and Autocracy in Central Asia.”

Eric notes that the theories and prescriptions of the transitions literature have not borne fruit in Central Asia. Indeed, “the region today is more autocratic than it was eighteen years ago at the time of the Soviet collapse.”

Eric thus seeks to understand why “Transitions 1.0” failed and to “investigate the potential for a Transitions 2.0” by exploring three autocracies Kazakhstan, Kyrgyzstan and Uzbekistan.

As Eric notes, “new information communication technologies (ICTs) are emerging in Central Asia and, as survey research demonstrates, these new ICTs hold the potential to transform the region’s political culture from one that abides authoritarian rule to a culture that embraces political reform.”

I very much appreciate Eric’s balanced approach to technology and demographic change. As he writes,

[T]he current class of political elites is graying while the youth population of Central Asian society is growing larger.  And whereas the hierarchical Communist Party carefully controlled the political milieu in which the current political elite was acculturated, today new ICTs have broken the government’s information monopoly, laid bare the inequities of patronage politics and are in the process of changing the mental maps with which this growing younger generation views national governance.

Institutional path dependency, as Paul Pierson explains, is sustained by—learning effects‖ and—adaptive expectations. New ICTs have simultaneously transformed what youth in Central Asia learn and what they expect—and it is this transformation […] that may ultimately undermine the cost calculations that have thus far sustained autocratic patronage in the region.

Whether access to ICTs can be shown to have a successful track record in promoting liberalization and democratization is still an open debate which requires more empirical research to shed compelling insights on the question.

Eric cites the work by David Hill and Khrishna Sen (2000) who “illustrate how the Internet enabled Indonesian oppositionists not only to break Suharto’s media monopoly, but to break this monopoly using conversational, dialogic, (and) non-hierarchical” forms of communication.”

That said, Hill, Krishna and several other scholars emphasize that the “political environment within which oppositionists marshal technologies like the Internet, can dampen the transformative effects of new ICTs.” To be sure,

Just as autocracies can control printing presses, radio and television, so too can savvy authoritarian governments monitor and exert control over new telecoms and Internet service providers.  Moreover, even absent such control, new ICTs need not be liberalizing.

Peter Chroust, for example, demonstrates how illiberal groups—neo-Nazis in Germany and the Taliban in Afghanistan—can equally use new ICTs to facilitate communication and mobilization.

Benjamin Barber suggests that fears that new ICTs force people—into one commercially homogeneous global network: one McWorld tied together by technology motivate actors to fight for the opposite, for the construction of even more differentiated local identities. As such, Barber predicts, new ICTs will result in more, not less ethnic, racial, tribal, or religious violence.

Eric’s research is informative because there is still very little research on the impact of ICTs on populations in Central Asia. The results of his empirical survey suggests that “although the causal effects of new ICTs are mixed and highly dependent on structural context, the use of new ICTs nevertheless does appear to have a liberalizing effect on political culture.”

More specifically, where state filtering of the Internet is less pronounced—in Kyrgyzstan and Kazakhstan—survey results suggest that Internet users do exhibit greater inclinations toward political reform and civic engagement.  Conversely, where state filtering of the Internet is extensive, as it is in Uzbekistan, inclinations toward political reform and civic engagement differ little between Internet users non-users.

Eric concludes as follows:

Will Transitions 2.0 succeed where Transitions 1.0 failed?  To a large degree the answer to this question rests in the ability of Central Asian governments to continue effective filtering of the Internet and of global communications broadly, something that may get progressively more difficult as Internet access shifts from what now are readily controlled public areas (work, Internet cafes and libraries) to the comparative privacy of smart phones and home computers.

No less consequential is whether ICT-induced changes in political culture translate to societal changes in political engagement.  This study suggests that the retreat of Soviet institutions of political acculturation and the arrival of new ICTs will likely produce a political culture that is less trusting of autocratic rule and more open to outsiders and civic engagement.

Whether Central Asians will assume the daunting risks that undoubtedly are required to transform their governments so as to more closely reflect these changed political values, however, remains an open question.

Patrick Philippe Meier