Tag Archives: GDACS

GDACSmobile: Disaster Responders Turn to Bounded Crowdsourcing

GDACS, the Global Disaster Alert and Coordination System, sparked my interest in technology and disaster response when it was first launched back in 2004, which is why I’ve referred to GDACS in multiple blog posts since. This near real-time, multi-hazard monitoring platform is a joint initiative between the UN’s Office for the Coordination of Humanitarian Affairs (OCHA) and the European Commission (EC). GDACS serves to consolidate and improve the dissemination of crisis-related information including rapid mathematical analyses of expected disaster impact. The resulting risk information is distributed via Web and auto-mated email, fax and SMS alerts.

Screen Shot 2013-03-25 at 3.13.35 AM

I recently had the pleasure of connecting with two new colleagues, Daniel Link and Adam Widera, who are researchers at the University of Muenster’s European Research Center for Information Systems (ERCIS). Daniel and Adam have been working on GDACSmobile, a smartphone app that was initially developed to extend the reach of the GDACS portal. This project originates from a student project supervised by Daniel, Adam along with the Chair of the Center Bernd Hellingrath in cooperation with both Tom de Groeve from the Joint Research Center (JRC) and Minu Kumar Limbu, who is now with UNICEF Kenya.

GDACSmobile is intended for use by disaster responders and the general public, allowing for a combined crowdsourcing and “bounded crowdsourcing” approach to data collection and curation. This bounded approach was a deliberate design feature for GDACSmobile from the outset. I coined the term “bounded crowd-sourcing” four years ago (see this blog post from 2009). The “bounded crowd-sourcing” approach uses “snowball sampling” to grow a crowd of trusted reporters for the collection of crisis information. For example, one invites 5 (or more) trusted local reports to collect relevant information and subsequently ask each of these to invite 5 additional reporters who they fully trust; And so on, and so forth. I’m thrilled to see this term applied in practical applications such GDACSmobile. For more on this approach, please see these blog posts.

Bildschirmfoto 2013-03-25 um 13.47.21

GDACSmobile, which operates on all major mobile smartphones, uses a delibera-tely minimalist approach to situation reporting and can be used to collect info-rmation (via text & image) while offline. The collected data is then automatically transmitted when a connection becomes available. Users can also view & filter data via map view and in list form. Daniel and Adam are considering the addition of an icon-based data-entry interface instead of text-based data-entry since the latter is more cumbersome & time-consuming.

Bildschirmfoto 2013-03-24 um 22.15.28

Meanwhile, the server side of GDACSmobile facilitates administrative tasks such as the curation of data submitted by app users and shared on Twitter. Other social media platforms may be added in the future, such as Flickr, to retrieve relevant pictures from disaster-affected areas (similar to GeoFeedia). The server-side moderation feature is used to ensure high data quality standards. But the ERCIS researchers are also open to computational solutions, which is one reason GDACSmobile is not a ‘data island’ and why other systems for computational analysis, microtasking etc., can be used to process the same dataset. The server also “offers a variety of JSON services to allow ‘foreign’ systems to access the data. […] SQL queries can also be used with admin access to the server, and it would be very possible to export tables to spreadsheets […].” 

I very much look forward to following GDACSmobile’s progress. Since Daniel and Adam have designed their app to be open and are also themselves open to con-sidering computational solutions, I have already begun to discuss with them our AIDR project (Artificial Intelligence for Disaster Response) project at the Qatar Computing Research Institute (QCRI). I believe that making the ADIR-GDACS interoperable would make a whole lot of sense. Until then, if you’re going to this year’s International Conference on Information Systems for Crisis Response and Management (ISCRAM 2013) in May, then be sure to participate in the workshop (PDF) that Daniel and Adam are running there. The side-event will present the state of the art and future trends of rapid assessment tools to stimulate a conver-sation on current solutions and developments in mobile tech-nologies for post-disaster data analytics and situational awareness. My colleague Dr. Imran Muhammad from QCRI will also be there to present findings from our crisis computing research, so I highly recommend connecting with him.

Bio

Evolving a Global System of Info Webs

I’ve already blogged about what an ecosystem approach to conflict early warning and response entails. But I have done so with a country focus rather than thinking globally. This blog post applies a global perspective to the ecosystem approach given the proliferation of new platforms with global scalability.

Perhaps the most apt analogy here is one of food webs where the food happens to be information. Organisms in a food web are grouped into primary producers, primary consumers and secondary consumers. Primary producers such as grass harvest an energy source such as sunlight that they turn into biomass. Herbivores are primary consumers of this biomass while carnivores are secondary consumers of herbivores. There is thus a clear relationship known as a food chain.

This is an excellent video visualizing food web dynamics produced by researchers affiliated with the Santa Fe Institute (SFI):

Our information web (or Info Web) is also composed of multiple producers and consumers of information each interlinked by communication technology in increasingly connected ways. Indeed, primary producers, primary consumers and secondary consumers also crawl and dynamically populate the Info Web. But the shock of the information revolution is altering the food chains in our ecosystem. Primary consumers of information can now be primary producers, for example.

At the smallest unit of analysis, individuals are the most primary producers of information. The mainstream media, social media, natural language parsing tools, crowdsourcing platforms, etc, arguably comprise the primary consumers of that information. Secondary consumers are larger organisms such as the global Emergency Information Service (EIS) and the Global Impact and Vulnerability Alert System (GIVAS).

These newly forming platforms are at different stages of evolution. EIS and GIVAS are relatively embryonic while the Global Disaster Alert and Coordination Systems (GDACS) and Google Earth are far more evolved. A relatively new organism in the Info Web is the UAV as exemplified by ITHACA. The BrightEarth Humanitarian Sensor Web (SensorWeb) is further along the information chain while Ushahidi’s Crisis Mapping platform and the Swift River driver are more mature but have not yet deployed as a global instance.

InSTEDD’s GeoChat, Riff and Mesh4X solutions have already iterated through a number of generations. So have ReliefWeb and the Humanitarian Information Unit (HIU). There are of course additional organisms in this ecosystem, but the above list should suffice to demonstrate my point.

What if we connected these various organisms to catalyze a super organism? A Global System of Systems (GSS)? Would the whole—a global system of systems for crisis mapping and early warning—be greater than the sum of its parts? Before we can answer this question in any reasonable way, we need to know the characteristics of each organism in the ecosystem. These organisms represent the threads that may be woven into the GSS, a global web of crisis mapping and early warning systems.

Global System of Systems

Emergency Information Service (EIS) is slated to be a unified communications solution linking citizens, journalists, governments and non-governmental organizations in a seamless flow of timely, accurate and credible information—even when local communication infrastructures are rendered inoperable. This feature will be made possible by utilizing SMS as the communications backbone of the system.

In the event of a crisis, the EIS team would sift, collate, make sense of and verify the myriad of streams of information generated by a large humanitarian intervention. The team would gather information from governments, local media, the military, UN agencies and local NGOs to develop reporting that will be tailored to the specific needs of the affected population and translated into local languages. EIS would work closely with local media to disseminate messages of critical, life saving information.

Global Impact and Vulnerability Alert System (GIVAS) is being designed to closely monitor vulnerabilities and accelerate communication between the time a global crisis hits and when information reaches decision makers through official channels. The system is mandated to provide the international community with early, real-time evidence of how a global crisis is affecting the lives of the poorest and to provide decision-makers with real time information to ensure that decisions take the needs of the most vulnerable into account.

BrightEarth Humanitarian Sensor Web (SensorWeb) is specifically designed for UN field-based agencies to improve real time situational awareness. The dynamic mapping platform enables humanitarians to easily and quickly map infrastructure relevant for humanitarian response such as airstrips, bridges, refugee camps, IDP camps, etc. The SensorWeb is also used to map events of interest such as cholera outbreaks. The platform leverages mobile technology as well as social networking features to encourage collaborative analytics.

Ushahidi integrates web, mobile and dynamic mapping technology to crowdsource crisis information. The platform uses FrontlineSMS and can be deployed quickly as a crisis unfolds. Users can visualize events of interest on a dynamic map that also includes an animation feature to visualize the reported data over time and space.

Swift River is under development but designed to validate crowdsourced information in real time by combining machine learning for predictive tagging with human crowdsourcing for filtering purposes. The purpsose of the platform is to create veracity scores to denote the probability of an event being true when reported across several media such as Twitter, Online news, SMS, Flickr, etc.

GeoChat and Mesh4X could serve as the nodes connecting the above platforms in dynamic ways. Riff could be made interoperable with Swift River.

Can such a global Info Web be catalyzed? The question hinges on several factors the most important of which are probably awareness and impact. The more these individual organisms know about each other, the better picture they will have of the potential synergies between their efforts and then find incentives to collaborate. This is one of the main reasons I am co-organizing the first International Conference on Crisis Mapping (ICCM 2009) next week.

Patrick Philippe Meier

A Brief History of Crisis Mapping (Updated)

Introduction

One of the donors I’m in contact with about the proposed crisis mapping conference wisely recommended I add a big-picture background to crisis mapping. This blog post is my first pass at providing a brief history of the field. In a way, this is a combined summary of several other posts I have written on this blog over the past 12 months plus my latest thoughts on crisis mapping.

Evidently, this account of history is very much influenced by my own experience so I may have unintentionally missed a few relevant crisis mapping projects. Note that by crisis  I refer specifically to armed conflict and human rights violations. As usual, I welcome any feedback and comments you may have so I can improve my blog posts.

From GIS to Neogeography: 2003-2005

The field of dynamic crisis mapping is new and rapidly changing. The three core drivers of this change are the increasingly available and accessible of (1) open-source, dynamic mapping tools; (2) mobile data collection technologies; and lastly (3) the development of new methodologies.

Some experts at the cutting-edge of this change call the results “Neogeography,” which is essentially about “people using and creating their own maps, on their own terms and by combining elements of an existing toolset.” The revolution in applications for user-generated content and mobile technology provides the basis for widely distributed information collection and crowdsourcing—a term coined by Wired less than three years ago. The unprecedented rise in citizen journalism is stark evidence of this revolution. New methodologies for conflict trends analysis increasingly take spatial and/or inter-annual dynamics into account and thereby reveal conflict patterns that otherwise remain hidden when using traditional methodologies.

Until recently, traditional mapping tools were expensive and highly technical geographic information systems (GIS), proprietary software that required extensive training to produce static maps.

In terms of information collection, trained experts traditionally collected conflict and human rights data and documented these using hard-copy survey forms, which typically became proprietary once completed. Scholars began coding conflict event-data but data sharing was the exception rather than the rule.

With respect to methodologies, the quantitative study of conflict trends was virtually devoid of techniques that took spatial dynamics into account because conflict data at the time was largely macro-level data constrained by the “country-year straightjacket.”

That is, conflict data was limited to the country-level and rarely updated more than once a year, which explains why methodologies did not seek to analyze sub-national and inter-annual variations for patterns of conflict and human rights abuses. In addition, scholars in the political sciences were more interested in identifying when conflict as likely to occur as opposed to where. For a more in-depth discussion of this issue, please see my paper from 2006  “On Scale and Complexity in Conflict Analysis” (PDF).

Neogeography is Born: 2005

The pivotal year for dynamic crisis mapping was 2005. This is the year that Google rolled out Google Earth. The application marks an important milestone in Neogeography because the free, user-friendly platform drastically reduced the cost of dynamic and interactive mapping—cost in terms of both availability and accessibility. Microsoft has since launched Virual Earth to compete with Google Earth and other  potential contenders.

Interest in dynamic crisis mapping did exist prior to the availability of Google Earth. This is evidenced by the dynamic mapping initiatives I took at Swisspeace in 2003. I proposed that the organization use GIS tools to visualize, animate and analyze the geo-referenced conflict event-data collected by local Swisspeace field monitors in conflict-ridden countries—a project called FAST. In a 2003 proposal, I defined dynamic crisis maps as follows:

FAST Maps are interactive geographic information systems that enable users of leading agencies to depict a multitude of complex interdependent indicators on a user-friendly and accessible two-dimensional map. […] Users have the option of selecting among a host of single and composite events and event types to investigate linkages [between events]. Events and event types can be superimposed and visualized through time using FAST Map’s animation feature. This enables users to go beyond studying a static picture of linkages to a more realistic dynamic visualization.

I just managed to dig up old documents from 2003 and found the interface I had designed for FAST Maps using the template at the time for Swisspeace’s website.

fast-map1

fast-map2

However, GIS software was (and still is) prohibitively expensive and highly technical. To this end, Swisspeace was not compelled to make the necessary investments in 2004 to develop the first crisis mapping platform for producing dynamic crisis maps using geo-referenced conflict data. In hindsight, this was the right decision since Google Earth was rolled out the following year.

Enter PRIO and GROW-net: 2006-2007

With the arrival of Google Earth, a variety of dynamic crisis maps quickly emerged. In fact, one if not the first application of Google Earth for crisis mapping was carried out in 2006 by Jen Ziemke and I. We independently used Google Earth and newly available data from the Peace Research Institute, Oslo (PRIO) to visualize conflict data over time and space. (Note that both Jen and I were researchers at PRIO between 2006-2007).

Jen used Google Earth to explain the dynamics and spatio-temporal variation in violence during the Angolan war. To do this, she first coded nearly 10,000 battle and massacre events as reported in the Portuguese press that took place over a 40 year period.

Meanwhile, I produced additional dynamic crisis maps of the conflict in the Democratic Republic of the Congo (DRC) for PRIO and of the Colombian civil war for the Conflict Analysis Resource Center (CARC) in Bogota. At the time, researchers in Oslo and Bogota used proprietary GIS software to produce static maps (PDF) of their newly geo-referenced conflict data. PRIO eventually used Google Earth but only to publicize the novelty of their new geo-referenced historical conflict datasets.

Since then, PRIO has continued to play an important role in analyzing the spatial dynamics of armed conflict by applying new quantitative methodologies. Together with universities in Europe, the Institute formed the Geographic Representations of War-net (GROW-net) in 2006, with the goal of “uncovering the causal mechanisms that generate civil violence within relevant historical and geographical and historical configurations.” In 2007, the Swiss Federal Institute of Technology in Zurich (ETH), a member of GROW-net, produced dynamic crisis maps using Google Earth for a project called WarViews.

Crisis Mapping Evolves: 2007-2008

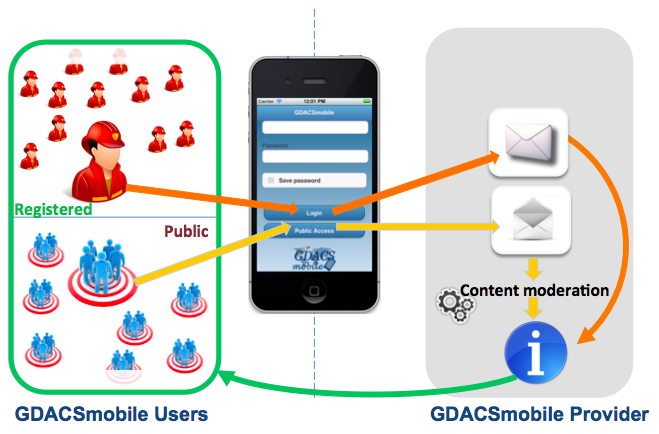
More recently, Automated Crisis Mapping (ACM), real-time and automated information collection mechanisms using natural language processing (NLP) have been developed for the automated and dynamic mapping of disaster and health-related events. Examples of such platforms include the Global Disaster Alert and Crisis System (GDACS), CrisisWire, Havaria and HealthMap. Similar platforms have been developed for  automated mapping of other news events, such as Global Incident Map, BuzzTracker, Development Seed’s Managing the News, and the Joint Research Center’s European Media Monitor.

Equally recent is the development of Mobile Crisis Mapping (MCM), mobile crowdsourcing platforms designed for the dynamic mapping of conflict and human rights data as exemplified by Ushahidi (with FrontLineSMS) and the Humanitarian Sensor Web (SensorWeb).

Another important development around this time is the practice of participatory GIS preceded by the recognition that social maps and conflict maps can empower local communities and be used for conflict resolution. Like maps of natural disasters and environmental degradation, these can be developed and discussed at the community level to engage conversation and joint decision-making. This is a critical component since one of the goals of crisis mapping is to empower individuals to take better decisions.

HHI’s Crisis Mapping Project: 2007-2009

The Harvard Humanitarian Initiative (HHI) is currently playing a pivotal role in crafting the new field of dynamic crisis mapping. Coordinated by Jennifer Leaning and myself, HHI is completing a two-year applied research project on Crisis Mapping and Early Warning. This project comprised a critical and comprehensive evaluation of the field and the documentation of lessons learned, best practices as well as alternative and innovative approaches to crisis mapping and early warning.

HHI also acts as an incubator for new projects and  supported the conceptual development of new crisis mapping platforms like Ushahidi and the SensorWeb. In addition, HHI produced the first comparative and dynamic crisis map of Kenya by drawing on reports from the mainstream media, citizen journalists and Ushahidi to analyze spatial and temporal patterns of conflict events and communication flows during a crisis.

HHI’s Sets a Research Agenda: 2009

HHI has articulated an action-oriented research agenda for the future of crisis mapping based on the findings from the two-year crisis mapping project. This research agenda can be categorized into the following three areas, which were coined by HHI:

  1. Crisis Map Sourcing
  2. Mobile Crisis Mapping
  3. Crisis Mapping Analytics

1) Crisis Map Sourcing (CMS) seeks to further research on the challenge of visualizing disparate sets of data ranging from structural and dynamic data to automated and mobile crisis mapping data. The challenge of CMS is to develop appropriate methods and best practices for mashing data from Automated Crisis Mapping (ACM) tools and Mobile Crisis Mapping platforms (see below) to add value to Crisis Mapping Analytics (also below).

2) The purpose of setting an applied-research agenda for Mobile Crisis Mapping, or MCM, is to recognize that the future of distributed information collection and crowdsourcing will be increasingly driven by mobile technologies and new information ecosystems. This presents the crisis mapping community with a host of pressing challenges ranging from data validation and manipulation to data security.

These hurdles need to be addressed directly by the crisis mapping community so that new and creative solutions can be applied earlier rather than later. If the persistent problem of data quality is not adequately resolved, then policy makers may question the reliability of crisis mapping for conflict prevention, rapid response and the documentation of human rights violations. Worse still, inaccurate data may put lives at risk.

3) Crisis Mapping Analytics (CMA) is the third critical area of research set by HHI. CMA is becoming increasingly important given the unprecedented volume of geo-referenced data that is rapidly becoming available. Existing academic platforms like WarViews and operational MCM platforms like Ushahidi do not include features that allow practitioners, scholars and the public to query the data and to visually analyze and identify the underlying spatial dynamics of the conflict and human rights data. This is largely true of Automated Crisis Mapping (ACM) tools as well.

In other words, new and informative metrics are need to be developed to identify patterns in human rights abuses and violent conflict both retrospectively and in real-time. In addition, existing techniques from spatial econometrics need to be rendered more accessible to non-statisticians and built into existing dynamic crisis mapping platforms.

Conclusion

Jen Ziemke and I thus conclude that the most pressing need in the field of crisis mapping is to bridge the gap between scholars and practitioners who self-identify as crisis mappers. This is the most pressing issue because bridging that divide will enable the field of crisis mapping to effectively and efficiently move forward by pursuing the three research agendas set out by the Harvard Humanitarian Initiative (HHI).

We think this is key to moving the crisis-mapping field into more mainstream humanitarian and human rights work—i.e., operational response. But doing so first requires that leading crisis mapping scholars and practitioners proactively bridge the existing gap. This is the core goal of the crisis mapping conference that we propose to organize.

Patrick Philippe Meier

From Intellipedia, to Virtual Osocc to WikiWarning?

What can we in the humanitarian community learn from Intellipedia as described in my previous blog ?

Some thoughts:

  • Let go of our ego-centric tendencies for control
  • Decentralize user-generated content and access
  • Utilization of tagging, IM, online video posting
  • Use open source tools and make minimal modifications
  • Capture tacit and informal knowledge qualitatively via blogs and wikis
  • Keep user-interfaces simple and minimize use of sophisticated interfaces
  • Provide non-monetary incentives for information collection and sharing
  • Shift from quality control mindset to soap box approach

There are no doubt more insights to be gained from the Intellipedia project but do we have any parallel information management systems in the humanitarian community? The first one that comes to mind is Virtual Osocc:

There are currently 2,437 users. The site includes a bulletin board where discussions can take place vis-a-vis ongoing emergencies and/or issues. A photo library is also available as are sections on training and meetings. The site’s homepage points to breaking emergencies and ongoing crises. Users can subscribe to email and SMS alerts.

When I spoke with the team behind Virtual Osocc, I was surprised to learn that the project has received no official endorsement by any UN agencies. This is particularly telling since an indicator of success for humanitarian information systems is the size of the active user base. Other points worth mentioning from my conversations with the team since they relate directly to my previous blog on Intellipedia include:

  • Tensions between the UN and NGOs vis-vis information sharing is healthy since it keeps us honest;
  • Decision-making in disaster management is by consensus (so tools should be designed accordingly);
  • Our community is currently unable to communicate effectively with the beneficiaries themselves.

Another humanitarian information systems is of course ReliefWeb, which is very well known so I shan’t expand on the system here. I would just like to suggest that we think of ways to integrate more Web 2.0 tools into ReliefWeb; allowing a wiki and blogging space, for example. There’s also the Global Disaster Alert and Coordination System (GDACS) manged out of the Joint Research Center (JRC) in Ispra, Italy. See my recent blog on the JRC’s satellite imagery change detection project here. The JRC is doing some phenomenal work and GDACS is an excellent reflection of this work. I will leave a more thorough overview of GDACS for a future blog entry.

Then there’s the new information system which was launched this past October 2007 in collaboration with the JRC. The system is a new web portal for leading situation centers including those at UN DPKO, the EU Council and NATO. The purpose of the new system is to facilitate the exchange and storage of unique and relevant information on emerging and ongoing crises and conflicts.The portal facilitates the exchange of unique documents including satellite images. Users can subscribe to specific email and SMS alerts. The system also include a Wiki mapping section. Needless to say, the new web portal is password protected and the user base limited to an elite few. This initiative may benefit from more Intellipedia think.

The issue that I find most pressing in all of this is the lack of two-communication (not to mention one-way) communication with beneficiaries. I find this gap upsetting. So I set up Wikiwarning some two years ago in the hope of finding the time, support and expertise to fully develop the concept and tool. Any takers?

My next blog will address the issue of intelligence for the stakeholders.

Patrick Philippe Meier