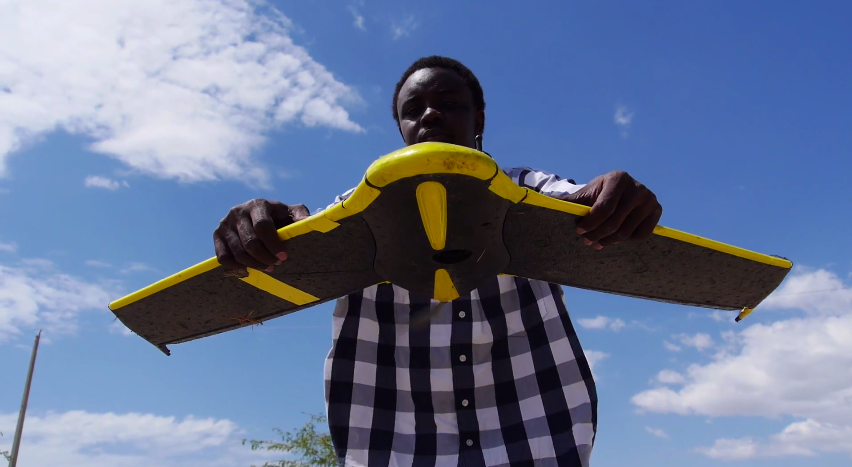
“What if, to solve our problems, we simply need to rise above them?” CartONG and France’s OpenStreetMap (OSM) community recently teamed up to support OSM Haiti’s disaster risk reduction efforts by deploying a small UAV, “which proved very useful for participatory mapping.” The video documentary below provides an excellent summary of this humanitarian UAV mission which took place just a few weeks ago.
As I noted in this earlier blog post on grassroots UAVs, the use of UAVs at the community level can be viewed as an extension of community and participatory mapping, which is why community engagement is pivotal for humanitarian UAV deployments. In many ways, a micro-UAV can actually bring a community together; can catalyze conversations & participation, which should be taken as more than simply a positive externality. Public Participatory GIS Projects (PPGIS) have long been used as a means to catalyze community conversations and even conflict resolution and mediation. So one should not overlook the positive uses of UAVs as a way to convene a community. Indeed, as CartONG and partners rightly note in the above video documentary, “The UAV is the uniting tool that brings the community together.”
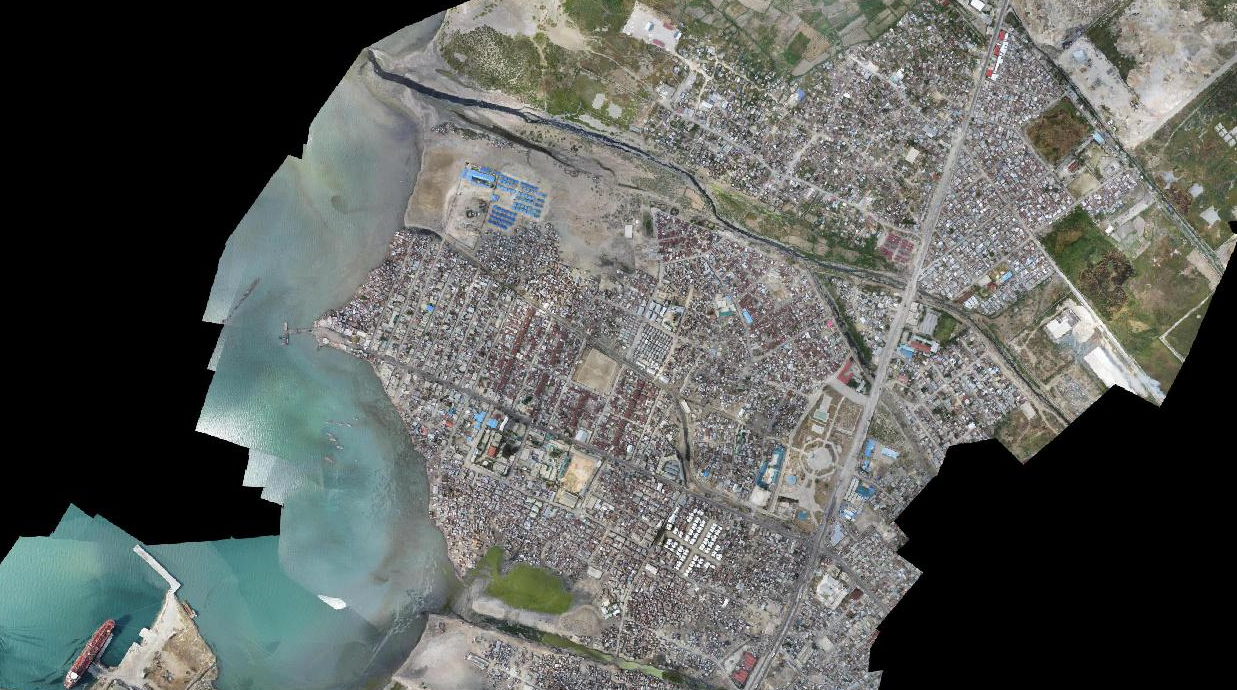
This joint UAV project in Haiti has three phases: training for data collection; analysis and use of collected data; and empowering the Haitian OSM community to lead their own projects with their own partners. The first phase, which was just completed, comprised 42 individual UAV flights (using SenseFly’s eBee) in multiple locations including the Port-au-Prince area, the urbanized part of Saint-Marc, Sans-Souci Palace (Unesco World Heritage Site), Dominican Republic border areas and Bord de Mer. This enabled the Haitian OSM community to test the UAV under varying conditions and across different terrains.
The UAV flight training included “aerial security” and an overview of the UAV’s weaknesses. As CartONG rightly notes, the use of UAVs for data collection and the training that goes along with “strengthen Haitian OSM communities, so that they can fully take part in local development.” To this end, I’m hoping to see more women flying UAVs in the future rather than seeing them standing by as passive observers. Community engagement without women is not community engagement. Perhaps UAVs can play a role in uniting and enabling women to become more engaged and take on leadership roles within communities.
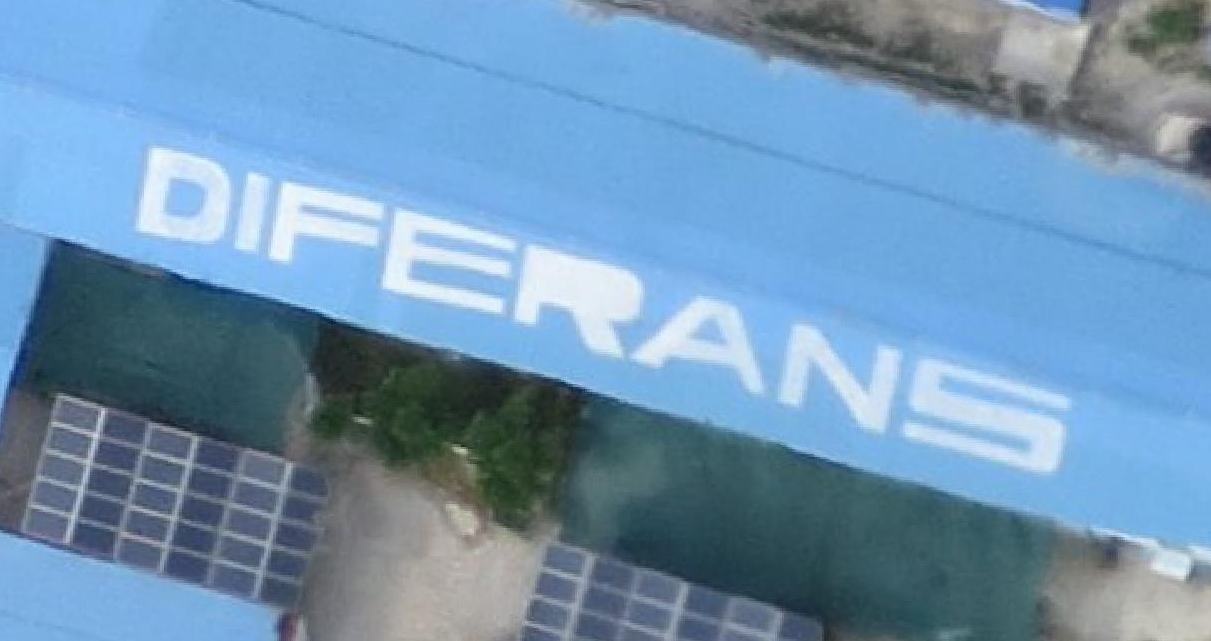
As part of their initial phase, CartONG and team also set up a mini-server to facilitate the processing of UAV imagery on site. “Considering the difficulties faced regarding aerial image processing the need for such a tool has been confirmed for all situations where accessing internet & electricity is a challenge.” Moreover, the Haitian OSM community expressed a direct interest in not only piloting UAVs but also in the processing and analysis of the resulting data: “communities wish to be trained to be able to fully master the process of collection and processing of aerial image, including on software such as ArcGIS and QGIS.”
I’m excited about these efforts and keen to follow the next phases of this UAV community mapping project. In the meantime, big thanks to CartONG’s Martin Noblecourt for kindly sharing this important volunteer-driven project. If you want to learn more about this initiative, feel free to contact Martin via email at info@cartong.org.
See Also:
Humanitarians in the Sky: Using UAVs for Disaster Response [link]
Humanitarian UAV Missions in During Balkan Floods [link]
Professor Muki Haklay kindly shared with me this superb new study in which he questions the alleged democratization effects of Neogeography. As my colleague Andrew Turnerexplained in 2006, “Neogeography means ‘new geography’ and consists of a set of techniques and tools that fall outside the realm of traditional GIS, Geographic Information Systems. […] Essentially, Neogeography is about people using and creating their own maps, on their own terms and by combining elements of an existing toolset. Neogeography is about sharing location information with friends & visitors, helping shape context, and conveying under-standing through knowledge of place.” To this end, as Muki writes, “it is routinely argued that the process of producing and using geographical information has been fundamentally democratized.” For example, as my colleague Nigel Snoad argued in 2011, “[…] Google, Microsoft and OpenStreetMap have really demo-cratized mapping.” Other CrisisMappers, including myself, have made similar arguments over the years.
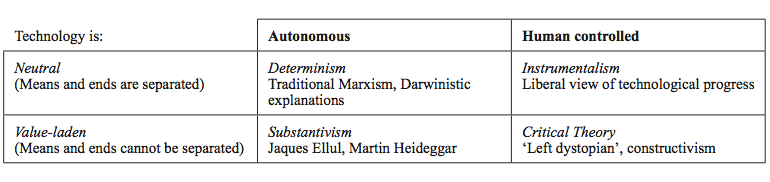
Muki explores this assertion by delving into the various meanings of demo-cratization. He adopts the specific notion of democratization that “evokes ideas about participation, equality, the right to influence decision making, support to individual and group rights, access to resources and opportunities, etc.” With this definition in hand, Muki argues that “using this stronger interpretation of democratization reveals the limitation of current neogeographic practices and opens up the possibility of considering alternative development of technologies that can, indeed, be considered democratizing.” To explore this further, he turns to Andrew Feenberg‘s critical philosophy of technology. Feenberg identifies “four main streams of thought on the essence of technology and its linkage to society: instrumentalism, determinism, substantivism & critical theory.”
Feenberg’s own view is constructivist, “emphasizing that technology development is humanly controlled and encapsulates values and politics; it should thus be open to democratic control and intervention.” In other words, “technology can and should be seen as a result of political negotiations that lead to its production and use. In too many cases, the complexities of technological systems are used to concentrate power within small groups of technological, financial, and political elites and to prevent the wider body of citizens from meaningful participation in shaping it and deciding what role it should have in the everyday.” Furthermore, “Feenberg highlights that technology encapsulates an ambivalence between the ‘conservation of hierarchy’, which most technologies promote and reproduce—hence the continuity in power structures in advanced capitalist societies despite technological upheaval—and ‘democratic rationalisation’, which are the aspects of new technologies that undermine existing power structures and allow new opportunities for marginalized or ignored groups to assert themselves.”
To this end, Feenberg calls for a “deep democratization” of technology as an alternative to technocracy. “Instead of popular agency appearing as an anomaly and an interference, it would be normalized and incorporated into the standard procedures of technical design.” In other words, deep democratization is about empowerment: “providing the tools that will allow increased control over the technology by those in disadvantaged and marginalized positions in society.” Muki contrasts this with neogeography, which is “mostly represented in a decon-textualised way—as the citation in the introduction from Turner’s (2006) Intro-duction to Neogeography demonstrates: it does not discuss who the people are who benefit and whether there is a deeper purpose, beyond fun, for their engage-ment in neogeography.” And so, as neogeographers would have it, since “there is nothing that prevents anyone, anytime, and anywhere, and for any purpose from using the system, democratization has been achieved.” Or maybe not. Enter the Digital Divides.
Yes, there are multiple digital divides. Differential access to computers & comm-unication technology is just one. “Beyond this, there is secondary digital ex-clusion, which relates to the skills and abilities of people to participate in online activities beyond rudimentary browsing.” Related to this divide is the one between the “Data Haves” and the “Data Have Nots”. There is also an important divide in speed—as anyone who has worked in say Liberia will have experienced—it takes a lot longer to upload/download/transfer content than in Luxembourg. “In summary, the social, economic, structural, and technical evidence should be enough to qualify and possibly withdraw the democratization claims that are attached to neogeographic practices.”
That said, the praxis of neogeography still has democratic potential. “To address the potential of democratization within neogeographic tools, we need to return to Feenberg’s idea of deep democratization and the ability of ordinary citizens to direct technical codes and influence them so that they can include alternative meanings and values. By doing so, we can explore the potential of neogeographic practices to support democratisation in its fuller sense. At the very least, citizens should be able to reuse existing technology and adapt it so that it can be used to their own goals and to represent their own values.” So Muki adds a “Hierarchy of Hacking” to Feeberg’s conceptual framework, i.e., the triangle below.
While the vast majority can participate in a conversation about what to map (Meaning), only a “small technical elite within society” can contribute to “Deep Technical Hacking,” which “requires very significant technical knowledge in creating new geographic data collection tools, setting up servers, and configuring database management systems.” Muki points to Map Kibera as an example of Deep Technical Hacking. I would add that “Meaning Hacking” is often hijacked by “Deep Technical Hackers” who tend to be the ones introducing-and-controlling local neogeography projects despite their “best” intentions. But the fact is this: Deep Tech Hackers typically have little to noactual experience in community development and are often under pressure to hype up blockbuster-like successes at fancy tech conferences in the US. This may explain why most take full owner-ship over all decisions having to do with Meaning- and Use-Hacking right from the start of a project. See this blog post’s epilogue, for more on this dynamic.
One success story, however, is Liberia’s Innovation Lab (iLab). My field visit to Monrovia in 2011 made me realize just how many completely wrong assumptions I had about the use of neogeography platforms in developing countries. Instead of parachuting in and out, the co-founders of iLab became intimately familiar with the country by spending a considerable amount of time in Monrovia and outside the capital city to understand the social, political and historical context in which they were introducing neogeography. And so, while they initially expected to provide extensive training on neogeography platforms right off the bat, they quickly realized that this was the wrong approach entirely for several reasons. As Muki observers, “Because of the reduced barriers, neogeography does offer some increased level of democratization but, to fulfill this potential, it requires careful implementation that takes into account social and political aspects,” which is precisely what the team at the iLab have done and continue to do impressively well. Note that one of the co-founders is a development expert, not a technology hacker. And while the other is a hacker, he spent several years working in Liberia. (Another equally impressive success story is this one from Brazil’s Mare shantytown).
I thus fully subscribe to Muki’s hacking approach and made a very similar ar-gument in this 2011 blog post: “Democratizing ICT for Development with DIY Innovation and Open Data.” I directly challenged the “participatory” nature of these supposedly democratizing technologies and in effect questioned whether Deep Technical Hackers really do let go of control vis-a-vis the hacking of “Meaning” and “Use”. While I used Ushahidi as an example of a DIY platform, it is clear from Muki’s study that Ushahidi like other neogeography platforms also falls way short of deep democratization and hack-ability. That said, as I wrote then, “it is worth remembering that the motivations driving this shift [towards neogeography] are more important than any one technology. For example, recall the principles behind the genesis of the Ushahidi platform: Democratizing information flows and access; promoting Open Data and Do it Yourself (DIY) Innovation with free, highly hackable (i.e., open source) technology; letting go of control.” In other words, the democratizing potential should not be dismissed outright even if we’re not quite there yet (or ever).
As I noted in 2011, hackable and democratizing technologies ought to be like a “choose your own adventure game. The readers, not the authors, finish the story. They are the main characters who bring the role playing games and stories to life.” This explains why I introduced the notion a “Fischer Price Theory of Tech-nology” five years ago at this meeting with Andrew Turner and other colleagues. As argued then, “What our colleagues in the tech-world need to keep in mind is that the vast majority of our partners in the field have never taken a computer science or software engineering course. […] The onus thus falls on the techies to produce the most simple, self-explanatory, intuitive interfaces.”
I thus argued that neogeography platforms ought to be as easy to use (and yes hack) as simple as computer games, which is why I was excited to see the latest user interface (UI) developments for OpenStreetMap (image below). Of course, as Muki has ably demonstrated, UI design is just the tip of the iceberg vis-a-vis democratization effects. But democratization is both relative and a process, and neogeography platforms are unlikely to become less democratizing over time, for instance. While some platforms still have a long road ahead with respect to reaching their perceived potential (if ever), a few instances may already have made in-roads in terms of their local political effects as argued here and in my doctoral dissertation.
Truly hackable technology, however, needs to go beyond the adventure story and Fischer Price analogies described above. The readers should have the choice of becoming authors before they even have a story in mind, while gamers should have the option of creating their own games in the first place. In other words, as Muki argues, “the artful alteration of technology beyond the goals of its original design or intent,” enables “Deep Democratization.” To this end, “Freely pro-viding the hackable building blocks for DIY Innovation is one way to let go of control and democratize [neogeography platforms],” not least if the creators can make a business out of their buildings.
Muki concludes by noting that, “the main error in the core argument of those who promote [neogeography] as a democratic force is the assumption that, by increasing the number of people who utilise geographic information in different ways and gain access to geographic technology, these users have been em-powered and gained more political and social control. As demonstrated in this paper, neogeography has merely opened up the collection and use of this information to a larger section of the affluent, educated, and powerful part of society.” What’s more, “The control over the information is kept, by and large, by major corporations and the participant’s labor is enrolled in the service of these corporations, leaving the issue of payback for this effort a moot point. Significantly, the primary intention of the providers of the tools is not to empower communities or to include marginalized groups, as they do not re-present a major source of revenue.” I argued this exact point here a year ago.
Update (Nov 2):5,739 aerial images tagged by over 3,000 volunteers. Please keep up the outstanding work!
My colleague Schuyler Erle from Humanitarian OpenStreetMap just launched a very interesting effort in response to Hurricane Sandy. He shared the info below via CrisisMappers earlier this morning, which I’m turning into this blog post to help him recruit more volunteers.
Schuyler and team just got their hands on the Civil Air Patrol’s (CAP) super high resolution aerial imagery of the disaster affected areas. They’ve imported this imagery into their Micro-Tasking ServerMapMill created by Jeff Warrenand are now asking volunteers to help tag the images in terms of the damage depicted in each photo. “The 531 images on the site were taken from the air by CAP over New York, New Jersey, Rhode Island, and Massachusetts on 31 Oct 2012.”
“For each photo shown, please select ‘ok’ if no building or infrastructure damage is evident; please select ‘not ok’ if some damage or flooding is evident; and please select ‘bad’ if buildings etc. seem to be significantly damaged or underwater. Our *hope* is that the aggregation of the ok/not ok/bad ratings can be used to help guide FEMA resource deployment, or so was indicated might be the case during RELIEF at Camp Roberts this summer.”
A disaster response professional working in the affected areas for FEMA replied (via CrisisMappers) to Schuyler’s efforts to confirm that:
“[G]overnment agencies are working on exploiting satellite imagery for damage assessments and flood extents. The best way that you can help is to help categorize photos using the tool Schuyler provides […]. CAP imagery is critical to our decision making as they are able to work around some of the limitations with satellite imagery so that we can get an area of where the worst damage is. Due to the size of this event there is an overwhelming amount of imagery coming in, your assistance will be greatly appreciated and truly aid in response efforts. Thank you all for your willingness to help.”
Schuyler notes that volunteers can click on the Grid link from the home page of the Micro-Tasking platform to “zoom in to the coastlines of Massachusetts or New Jersey” and see “judgements about building damages beginning to aggregate in US National Grid cells, which is what FEMA use operationally. Again, the idea and intention is that, as volunteers judge the level of damage evident in each photo, the heat map will change color and indicate at a glance where the worst damage has occurred.” See above screenshot.
Even if you just spend 5 or 10 minutes tagging the imagery, this will still go a long way to supporting FEMA’s response efforts. You can also help by spreading the word and recruiting others to your cause. Thank you!
My colleague Kirk Morris recently pointed me to this very neat study on iterative versus parallel models of crowdsourcing for the analysis of satellite imagery. The study was carried out by French researcher & engineer Nicolas Maisonneuve for the next GISscience2012 conference.
Nicolas finds that after reaching a certain threshold, adding more volunteers to the parallel model does “not change the representativeness of opinion and thus will not change the consensual output.” His analysis also shows that the value of this threshold has significant impact on the resulting quality of the parallel work and thus should be chosen carefully. In terms of the iterative approach, Nicolas finds that “the first iterations have a high impact on the final results due to a path dependency effect.” To this end, “stronger commitment during the first steps are thus a primary concern for using such model,” which means that “asking expert/committed users to start,” is important.
Nicolas’s study also reveals that the parellel approach is better able to correct wrong annotations (wrong analysis of the satellite imagery) than the iterative model for images that are fairly straightforward to interpret. In contrast, the iterative model is better suited for handling more ambiguous imagery. But there is a catch: the potential path dependency effect in the iterative model means that “mistakes could be propagated, generating more easily type I errors as the iterations proceed.” In terms of spatial coverage, the iterative model is more efficient since the parallel model leverages redundancy to ensure data quality. Still, Nicolas concludes that the “parallel model provides an output which is more reliable than that of a basic iterative [because] the latter is sensitive to vandalism or knowledge destruction.”
So the question that naturally follow is this: how can parallel and iterative methodologies be combined to produce a better overall result? Perhaps the parallel approach could be used as the default to begin with. However, images that are considered difficult to interpret would get pushed from the parallel workflow to the iterative workflow. The latter would first be processed by experts in order to create favorable path dependency. Could this hybrid approach be the wining strategy?
Crisis mapping for disaster preparedness is nothing new. In 2004, my colleague Suha Ulgen spearheaded an innovative project in Istanbul that combined public participation and mobile geospatial technologies for the purposes of disaster mitigation. Suha subsequently published an excellent overview of the project entitled “Public Participation Geographic Information Sharing Systems for Co-mmunity Based Urban Disaster Mitigation,” available in this edited book on Geo-Information for Disaster Management. I have referred to this project in count-less conversations since 2007 so it is high time I blog about it as well.
Suha’s project included a novel “Neighborhood Geographic Information Sharing System,” which “provided volunteers with skills and tools for identification of seismic risks and response assets in their neighborhoods. Field data collection volunteers used low-cost hand-held computers and data compiled was fed into a geospatial database accessible over the Internet. Interactive thematic maps enabled discussion of mitigation measures and action alternatives. This pilot evolved into a proposal for sustained implementation with local fire stations.” Below is a screenshot of the web-based system that enabled data entry and query.
There’s no reason why a similar approach could not be taken today, one that uses a dedicated smart phone app combined with integrated gamification and social networking features. The idea would be to make community mapping fun and rewarding; a way to foster a more active and connected community—which would in turn build more social capital. In the event of a disaster, this same smart phone app would allow users to simply “check in” to receive information on the nearest shelter areas (response assets) as well as danger zones such as overpasses, etc. This is why geo-fencing is so important for crisis mapping.
(Incidentally, Suha’s project also included a “School Commute Contingency Pilot” designed to track school-bus routes in Istanbul and thus “stimulate contingency planning for commute-time emergencies when 400,000 students travel an average of 45 minutes each way on 20,000 service buses. [GPS] data loggers were used to determine service bus routes displayed on printed maps high-lighting nearest schools along the route.” Suha proposed that “bus-drivers, parents and school managers be issued route maps with nearest schools that could serve as both meeting places and shelters”).
Fast forward to 2012 and the Humanitarian OpenStreetMap’s (HOT) novel project “Community Mapping for Exposure in Indonesia,” which resulted in the mapping of over 160,000 buildings and numerous village level maps in under ten months. The team also organized a university competition to create incentives for the mapping of urban areas. “The students were not only tasked to digitize buildings, but to also collect building information such building structure, wall type, roof type and the number of floors.” This contributed to the mapping and codification of some 30,000 buildings.
As Suha rightly noted almost 10 years ago, “for disaster mitigation measures to be effective they need to be developed in recognition of the local differences and adopted by the active participation of each community.” OSM’s work in Indonesia fully embodies the importance of mapping local differences and provides important insights on how to catalyze community participation. The buildup of social capital is another important outcome of these efforts. Social capital facilitates collective action and increases local capacity for self-organization, resulting in greater social resilience. In sum, these novel projects demonstrate that technologies used for crisis mapping can be used for disaster preparedness, mitigation and resilience.
The Humanitarian OpenStreetMap Team’s (HOT) response to Haiti remains one of the most remarkable examples of what’s possible when volunteers, open source software and open data intersect. When the 7.0 magnitude earthquake struck on January 12th, 2010, the Google Map of downtown Port-au-Prince was simply too incomplete to be used for humanitarian response. Within days, however, several hundred volunteers from the OpenStreetMap (OSM) commu-nity used satellite imagery to trace roads, shelters and other important features to create the most detailed map of Haiti ever made.
The video animation above shows just how spectacular this initiative was. More than 1.4 million edits were made to the map during the first month following the earthquake. These individual edits are highlighted as bright flashes of light in the video. This detailed map went a long way to supporting the humanitarian community’s response in Haiti. In addition, the map enabled my colleagues and I at The Fletcher School to geo-locate reports from crowdsourced text messages from Mission 4636 on the Ushahidi Haiti Map.
HOT’s response was truly remarkable. They created wiki’s to facilitate mass collaboration such as this page on “What needs to be mapped?” They also used this “OSM Matrix” to depict which areas required more mapping:
The purpose of OSM’s new micro-tasking platform is to streamline mass and rapid collaboration on future satellite image tracing projects. I recently reached out to HOT’s Kate Chapman and Nicolas Chavent to get an overview of their new platform. After logging in using my OSM username and password, I can click through a list of various on-going projects. The one below relates to a very neat HOT project in Indonesia. As you can tell, the region that needs to be mapped on the right-hand side of the screen is divided into a grid.
After I click on “Take a task randomly”, the screen below appears, pointing me to one specific cell in the grid above. I then have the option of opening and editing this cell within JOSM, the standard interface for editing OpenStreetMap. I would then trace all roads and buildings in my square and submit the edit. (I was excited to also see a link to WalkingPapers which allows you to print out and annotate that cell using pen & paper and then digitize the result for import back into OSM).
There’s no doubt that this new Tasking Server will go a long way to coordinate and streamline future live tracing efforts such as for Somalia. For now, the team is mapping Somalia’s road network using their wiki approach. In the future, I hope that the platform will also enable basic feature tagging and back-end triangulation for quality assurance purposes—much like Tomnod. In the meantime, however, it’s important to note that OSM is far more than just a global open source map. OSM’s open data advocacy is imperative for disaster preparedness and response: open data saves lives.
My colleague Jennifer Leaning and I co-founded the Program on Crisis Mapping and Early (CM&EW) at the Harvard Humanitarian Initiative (HHI) back in June 2007. At the time, the term “Crisis Mapping” was virtually unheard of. In January 2008, Ushahidi demonstrated how crisis mapping could be combined with crowdsourcing and SMS.
In October 2009, my colleague Jen Ziemke and I launched the International Network of CrisisMappers with a dedicated Crisis Mappers Google Group, which currently has over 700 subscribers. Jen and I also co-organized the first International Conference on Crisis Mapping (ICCM 2009) last year and are now preparing for ICCM 2010, which will focus on Haiti and Beyond. Over 30 online videos on Crisis Mapping have also been produced and we recently launched a dedicated monthly WebCast series on CrisisMapping as well.
On January 21, 2010, I attended a speech by Secretary of State Hillary Clinton in which she noted the pivotal role of interactive maps and SMS in the disaster response to Haiti. In her own words:
“The technology community has set up interactive maps to help us identify needs and target resources. And on Monday, a seven-year-old girl and two women were pulled from the rubble of a collapsed supermarket by an American search-and-rescue team after they sent a text message calling for help. Now, these examples are manifestations of a much broader phenomenon. The spread of information networks is forming a new nervous system for our planet.”
The CrisisMappers community played an instrumental role in the disaster response to Haiti. The interactive maps that Clinton refers to include OpenStreetMap, Sahana, Telescience and Ushahidi. I like this idea of a new nervous system and hope the CrisisMappers community can continue growing this nervous system to ensure more rapid responses to crises. The term “crisis mapping” is at least beginning to make the rounds.
A Google search of “crisis mapping” in October 2009 returned 36,500 hits. Today, 5 months later, the search returns “123,000” hits. During this time, Crisis Mapping initiatives have been written about and featured on CNN, ABC News, MSNBC, BBC, Reuters, UK Guardian, Al-Jazeera, NPR, the New York Times, the Washington Post, the Boston Globe, Huffington Post, Newsweek, the Globe and Mail, Wired, NewScientist, PC World, DiscoveryNews, Forbes Magazine and the TED Blog.
Several members of the CrisisMappers Group are currently preparing to present their projects at this year’s Where 2.0 Conference:
I very much look forward to ICCM 2010 as I’m very curious to discuss what the next generation of crisis mapping technologies and applications will bring.
I thrive when working across disciplines, building diverse cross-cutting coalitions to create, translate and apply innovative strategies driven by shared values. This has enabled the 20+ organizations I’ve worked with, and those I’ve led, to accelerate meaningful and inclusive social impact.
Which is why I've been called a social entrepreneur and a translational leader by successful innovators. President Clinton once called me a digital pioneer, while recent colleagues describe me as kind, dedicated, values-driven, authentic, creative, ethical, and impactful.