Category Archives: Big Data

Social Media = Social Capital = Disaster Resilience?

Do online social networks generate social capital, which, in turn, increases resilience to disasters? How might one answer this question? For example, could we analyze Twitter data to capture levels of social capital in a given country? If so, do countries with higher levels of social capital (as measured using Twitter) demonstrate greater resiliences to disasters?

Twitter Heatmap Hurricane

These causal loops are fraught with all kinds of intervening variables, daring assumptions and econometric nightmares. But the link between social capital and disaster resilience is increasingly accepted. In “Building Resilience: Social Capital in Post-Disaster Recover,” Daniel Aldrich draws on both qualitative and quantita-tive evidence to demonstrate that “social resources, at least as much as material ones, prove to be the foundation for resilience and recovery.” A concise summary of his book is available in my previous blog post.

So the question that follows is whether the link between social media, i.e., online social networks and social capital can be established. “Although real-world organizations […] have demonstrated their effectiveness at building bonds, virtual communities are the next frontier for social capital-based policies,” writes Aldrich. Before we jump into the role of online social networks, however, it is important to recognize the function of “offline” communities in disaster response and resilience.

iran-reliefs

“During the disaster and right after the crisis, neighbors and friends—not private firms, government agencies, or NGOs—provide the necessary resources for resilience.” To be sure, “the lack of systematic assistance from government and NGOs [means that] neighbors and community groups are best positioned to undertake efficient initial emergency aid after a disaster. Since ‘friends, family, or coworkers of victims and also passersby are always the first and most effective responders, “we should recognize their role on the front line of disasters.”

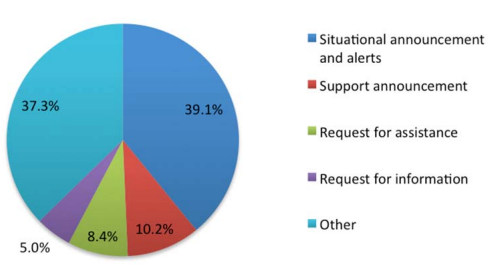
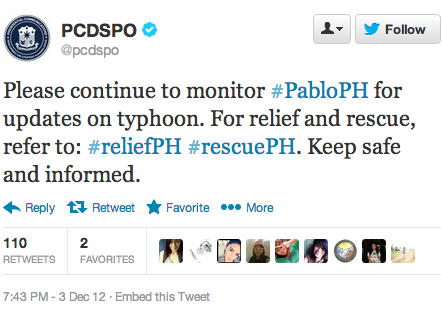
In sum, “social ties can serve as informal insurance, providing victims with information, financial help and physical assistance.” This informal insurance, “or mutual assistance involves friends and neighbors providing each other with information, tools, living space, and other help.” Data driven research on tweets posted during disasters reveal that many provide victims with information, help, tools, living space, assistance and other help. But this support is also provided to complete strangers since it is shared openly and publicly on Twitter. “[…] Despite—or perhaps because of—horrendous conditions after a crisis, survivors work together to solve their problems; […] the amount of (bounding) social capital seems to increase under difficult conditions.” Again, this bonding is not limited to offline dynamics but occurs also within and across online social networks. The tweet below was posted in the aftermath of Hurricane Sandy.

Sandy Tweets Mutual Aid

“By providing norms, information, and trust, denser social networks can implement a faster recovery.” Such norms also evolve on Twitter, as does information sharing and trust building. So is the degree of activity on Twitter directly proportional to the level of community resilience?

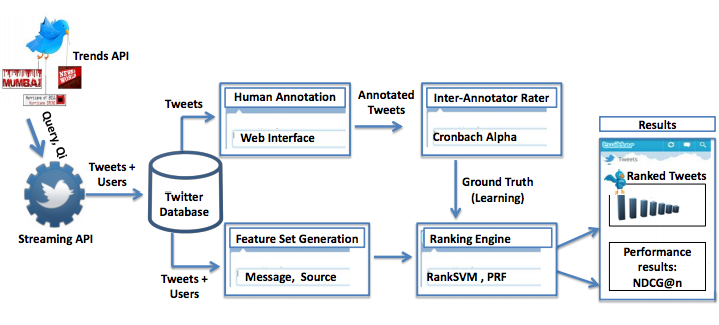
This data-driven study, “Do All Birds Tweet the Same? Characterizing Twitter Around the World,” may shed some light in this respect. The authors, Barbara Poblete, Ruth Garcia, Marcelo Mendoza and Alejandro Jaimes, analyze various aspects of social media–such as network structure–for the ten most active countries on Twitter. In total, the working dataset consisted close to 5 million users and over 5 billion tweets. The study is the largest one carried out to date on Twitter data, “and the first one that specifically examines differences across different countries.”

Screen Shot 2012-11-30 at 6.19.45 AM

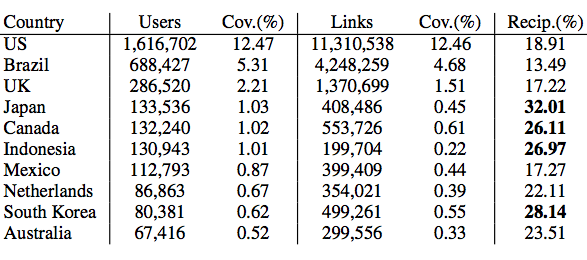
The network statistics per country above reveals that Japan, Canada, Indonesia and South Korea have highest percentage of reciprocity on Twitter. This is important because according to Poblet et al., “Network reciprocity tells us about the degree of cohesion, trust and social capital in sociology.” In terms of network density, “the highest values correspond to South Korea, Netherlands and Australia.” Incidentally, the authors find that “communities which tend to be less hierarchical and more reciprocal, also displays happier language in their content updates. In this sense countries with high conversation levels (@) … display higher levels of happiness too.”

If someone is looking for a possible dissertation topic, I would recommend the following comparative case study analysis. Select two of the four countries with highest percentage of reciprocity on Twitter: Japan, Canada, Indonesia and South Korea. The two you select should have a close “twin” country. By that I mean a country that has many social, economic and political factors in common. The twin countries should also be in geographic proximity to each other since we ultimately want to assess how they weather similar disasters. The paired can-didates that come to mind are thus: Canada & US and Indonesia & Malaysia.

Next, compare the countries’ Twitter networks, particularly degrees of  recipro-city since this metric appears to be a suitable proxy for social capital. For example, Canada’s reciprocity score is 26% compared to 19% for the US. In other words, quite a difference. Next, identify recent  disasters that both countries have experienced. Do the affected cities in the respective countries weather the disasters differently? Is one community more resilient than the other? If so, do you find a notable quantitative difference in their Twitter networks and degrees of reciprocity? If so, does a subsequent comparative qualitative analysis support these findings?

As cautioned earlier, these causal loops are fraught with all kinds of intervening variables, daring assumptions and econometric nightmares. But if anyone wants to brave the perils of applied social science research, and finds the above re-search questions of interest, then please do get in touch!

Debating the Value of Tweets For Disaster Response (Intelligently)

With every new tweeted disaster comes the same old question: what is the added value of tweets for disaster response? Only a handful of data-driven studies actually bother to move the debate beyond anecdotes. It is thus high time that a meta-level empirical analysis of the existing evidence be conducted. Only then can we move towards a less superficial debate on the use of social media for disaster response and emergency management.

In her doctoral research Dr. Sarah Vieweg found that between 8% and 24% of disaster tweets she studied “contain information that provides tactical, action-able information that can aid people in making decisions, advise others on how to obtain specific information from various sources, or offer immediate post-impact help to those affected by the mass emergency.” Two of the disaster datasets that Vieweg analyzed were the Red River Floods of 2009 and 2010. The tweets from the 2010 disaster resulted in a small increase of actionable tweets (from ~8% to ~9%). Perhaps Twitter users are becoming more adept at using Twitter during crises? The lowest number of actionable tweets came from the Red River Floods of 2009, whereas the highest came from the Haiti Earthquake of 2010. Again, there is variation—this time over space.

In this separate study, over 64,000 tweets generated during Thailand’s major floods in 2011 were analyzed. The results indicate that about 39% of these tweets belonged to the “Situational Awareness and Alerts” category. “Twitter messages in this category include up-to-date situational and location-based information related to the flood such as water levels, traffic conditions and road conditions in certain areas. In addition, emergency warnings from authorities advising citizens to evacuate areas, seek shelter or take other protective measures are also included.” About 8% of all tweets (over 5,000 unique tweets) were “Requests for Assistance,” while 5% were “Requests for Information Categories.”

TwitterDistribution

In this more recent study, researchers mapped flood-related tweets and found a close match between that resulting map and the official government flood map. In the map below, tweets were normalized, such that values greater than one mean more tweets than would be expected in normal Twitter traffic. “Unlike many maps of online phenomena, careful analysis and mapping of Twitter data does NOT simply mirror population densities. Instead con-centration of twitter activity (in this case tweets containing the keyword flood) seem to closely reflect the actual locations of floods and flood alerts even when we simply look at the total counts.” This also implies that a relatively high number of flood-related tweets must have contained accurate information.

TwitterMapUKfloods

Shifting from floods to fires, this earlier research analyzed some 1,700 tweets generated during Australia’s worst bushfire in history. About 65% of the tweets had “factual details,” i.e., “more than three of every five tweets had useful infor-mation.” In addition, “Almost 22% of the tweets had geographical data thus identifying location of the incident which is critical in crisis reporting.” Around 7% of the tweets were seeking information, help or answers. Finally, close to 5% (about 80 tweets) were considered “directly actionable.”

Preliminary findings from applied research that I am carrying out with my Crisis Computing team at QCRI also reveal variation in value. In one disaster dataset we studied, up to 56% of the tweets were found to be informative. But in two other datasets, we found the number of informative tweets to be very low. Meanwhile, a recent Pew Research study found that 34% of tweets during Hurricane Sandy “involved news organizations providing content, government sources offering information, people sharing their own eyewitness accounts and still more passing along information posted by others.” In addition, “fully 25% [of tweets] involved people sharing photos and videos,” thus indicating “the degree to which visuals have become a more common element of this realm.”

Finally, this recent study analyzed over 35 million tweets posted by ~8 million users based on current trending topics. From this data, the authors identified 14 major events reflected in the tweets. These included the UK riots, Libya crisis, Virginia earthquake and Hurricane Irene, for example. The authors found that “on average, 30% of the content about an event, provides situational awareness information about the event, while 14% was spam.”

So what can we conclude from these few studies? Simply that the value of tweets for disaster response can vary considerably over time and space. The debate should thus not center around whether tweets yield added value for disaster response but rather what drives this variation in value. Identifying these drivers may enable those with influence to incentivize high-value tweets.

This interesting study, “Do All Birds Tweet the Same? Characterizing Twitter Around the World,” reveals some very interesting drivers. The social network analysis (SNA) of some 5 million users and 5 billion tweets across 10 countries reveals that “users in the US give Twitter a more informative purpose, which is reflected in more globalized communities, which are more hierarchical.” The study is available here (PDF). This American penchant for posting “informative” tweets is obviously not universal. To this end, studying network typologies on Twitter may yield further insights on how certain networks can be induced—at a structural level—to post more informative tweets following major disasters.

Twitter Pablo Gov

Regardless of network typology, however, policy still has an important role to play in incentivizing high-value tweets. To be sure, if demand for such tweets is not encouraged, why would supply follow? Take the forward-thinking approach by the Government of the Philippines, for example. The government actively en-couraged users to use specific hashtags for disaster tweets days before Typhoon Pablo made landfall. To make this kind of disaster reporting via twitter more actionable, the Government could also encourage the posting of pictures and the use of a structured reporting syntax—perhaps a simplified version of the Tweak the Tweet approach. Doing so would not only provide the government with greater situational awareness, it would also facilitate self-organized disaster response initiatives.

In closing, perhaps we ought to keep in mind that even if only, say, 0.001% of the 20 million+ tweets generated during the first five days of Hurricane Sandy were actionable and only half of these were accurate, this would still mean over a thousand informative, real-time tweets, or about 15,000 words, or 25 pages of single-space, relevant, actionable and timely disaster information.

PS. While the credibility and veracity of tweets is an important and related topic of conversation, I have already written at length about this.

Automatically Ranking the Credibility of Tweets During Major Events

In their study, “Credibility Ranking of Tweets during High Impact Events,” authors Aditi Gupta and Ponnurangam Kumaraguru “analyzed the credibility of information in tweets corresponding to fourteen high impact news events of 2011 around the globe.” According to their analysis, “30% of total tweets  about an event contained situational information about the event while 14% was spam.” In addition, about 17% of total tweets contained situational awareness information that was credible.

Workflow

The study analyzed over 35 million tweets posted by ~8 million users based on current trending topics. From this data, the authors identified 14 major events reflected in the tweets. These included the UK riots, Libya crisis, Virginia earthquake and Hurricane Irene, for example.

“Using regression analysis, we identi ed the important content and sourced based features, which can predict the credibility of information in a tweet. Prominent content based features were number of unique characters, swear words, pronouns, and emoticons in a tweet, and user based features like the number of followers and length of username. We adopted a supervised machine learning and relevance feedback approach using the above features, to rank tweets according to their credibility score. The performance of our ranking algorithm signi cantly enhanced when we applied re-ranking strategy. Results show that extraction of credible information from Twitter can be automated with high confi dence.”

The paper is available here (PDF). For more applied research on “information forensics,” please see this link.

See also:

  • Analyzing Fake Content on Twitter During Boston Bombings [link]
  • Predicting the Credibility of Disaster Tweets Automatically [link]
  • Auto-Identifying Fake Images on Twitter During Disasters [link]
  • How to Verify Crowdsourced Information from Social Media [link]
  • Crowdsourcing Critical Thinking to Verify Social Media [link]

Why USAID’s Crisis Map of Syria is so Unique

While static, this crisis map includes a truly unique detail. Click on the map below to see a larger version as this may help you spot what is so striking.

For a hint, click this link. Still stumped? Look at the sources listed in the Key.


Using E-Mail Data to Estimate International Migration Rates

As is well known, “estimates of demographic flows are inexistent, outdated, or largely inconsistent, for most countries.” I would add costly to that list as well. So my QCRI colleague Ingmar Weber co-authored a very interesting study on the use of e-mail data to estimate international migration rates.

The study analyzes a large sample of Yahoo! emails sent by 43 million users between September 2009 and June 2011. “For each message, we know the date when it was sent and the geographic location from where it was sent. In addition, we could link the message with the person who sent it, and with the user’s demographic information (date of birth and gender), that was self reported when he or she signed up for a Yahoo! account. We estimated the geographic location from where each email message was sent using the IP address of the user.”

The authors used data on existing migration rates for a dozen countries and international statistics on Internet diffusion rates by age and gender in order to correct for selection bias. For example, “estimated number of migrants, by age group and gender, is multiplied by a correction factor to adjust for over-representation of more educated and mobile people in groups for which the Internet penetration is low.” The graphs below are estimates of age and gender-specific immigration rates for the Philippines. “The gray area represents the size of the bias correction.” This means that “without any correction for bias, the point estimates would be at the upper end of the gray area.” These methods “correct for the fact that the group of users in the sample, although very large, is not representative of the entire population.”

The results? Ingmar and his co-author Emilio Zagheni were able to “estimate migration rates that are consistent with the ones published by those few countries that compile migration statistics. By using the same method for all geographic regions, we obtained country statistics in a consistent way, and we generated new information for those countries that do not have registration systems in place (e.g., developing countries), or that do not collect data on out-migration (e.g., the United States).” Overall, the study documented a “global trend of increasing mobility,” which is “growing at a faster pace for females than males. The rate of increase for different age groups varies across countries.”

The authors argue that this approach could also be used in the context of “natural” disasters and man-made disasters. In terms of future research, they are interested in evaluating “whether sending a high proportion of e-mail messages to a particular country (which is a proxy for having a strong social network in the country) is related to the decision of actually moving to the country.” Naturally, they are also interested in analyzing Twitter data. “In addition to mobility or migration rates, we could evaluate sentiments pro or against migration for different geographic areas. This would help us understand how sentiments change near an international border or in regions with different migration rates and economic conditions.”

I’m very excited to have Ingmar at QCRI so we can explore these ideas further and in the context of humanitarian and development challenges. I’ve been dis-cussing similar research ideas with my colleagues at UN Global Pulse and there may be a real sweet spot for collaboration here, particularly with the recently launched Pulse Lab in Jakarta.” The possibility of collaborating with my collea-gues at Flowminder could also be really interesting given their important study of population movement following the Haiti Earthquake. In conclusion, I fully share the authors’ sentiment when they highlight the fact that it is “more and more important to develop models for data sharing between private com-panies and the academic world, that allow for both protection of users’ privacy & private companies’ interests, as well as reproducibility in scientific publishing.”

Rapidly Verifying the Credibility of Information Sources on Twitter

One of the advantages of working at QCRI is that I’m regularly exposed to peer-reviewed papers presented at top computing conferences. This is how I came across an initiative called “Seriously Rapid Source Review” or SRSR. As many iRevolution readers know, I’m very interested in information forensics as applied to crisis situations. So SRSR certainly caught my attention.

The team behind SRSR took a human centered design approach in order to integrate journalistic practices within the platform. There are four features worth noting in this respect. The first feature to note in the figure below is the automated filter function, which allows one to view tweets generated by “Ordinary People,” “Journalists/Bloggers,” “Organizations,” “Eyewitnesses” and “Uncategorized.” The second feature, Location, “shows a set of pie charts indica-ting the top three locations where the user’s Twitter contacts are located. This cue provides more location information and indicates whether the source has a ‘tie’ or other personal interest in the location of the event, an aspect of sourcing exposed through our preliminary interviews and suggested by related work.”


The third feature worth noting is the “Eyewitness” icon. The SRSR team developed the first ever automatic classifier to identify eyewitness reports shared on Twitter. My team and I at QCRI are developing a second one that focuses specifically on automatically classifying eyewitness reports during sudden-onset natural disasters. The fourth feature is “Entities,” which displays the top five entities that the user has mentioned in their tweet history. These include references to organizations, people and places, which can reveal important patterns about the twitter user in question.

Journalists participating in this applied research found the “Location” feature particularly important when assess the credibility of users on Twitter. They noted that “sources that had friends in the location of the event were more believable, indicating that showing friends’ locations can be an indicator of credibility.” One journalist shared the following: “I think if it’s someone without any friends in the region that they’re tweeting about then that’s not nearly as authoritative, whereas if I find somebody who has 50% of friends are in [the disaster area], I would immediately look at that.”

In addition, the automatic identification of “eyewitnesses” was deemed essential by journalists who participated in the SRSR study. This should not be surprising since “news organizations often use eyewitnesses to add credibility to reports by virtue of the correspondent’s on-site proximity to the event.” Indeed, “Witness-ing and reporting on what the journalist had witnessed have long been seen as quintessential acts of journalism.” To this end, “social media provides a platform where once passive witnesses can become active and share their eyewitness testimony with the world, including with journalists who may choose to amplify their report.”

In sum, SRSR could be used to accelerate the verification of social media con-tent, i.e., go beyond source verification alone. For more on SRSR, please see this computing paper (PDF), which was authored by Nicholas Diakopoulos, Munmun De Choudhury and Mor Naaman.

What Percentage of Tweets Generated During a Crisis Are Relevant for Humanitarian Response?

More than half-a-million tweets were generated during the first three days of Hurricane Sandy and well over 400,000 pictures were shared via Instagram. Last year, over one million tweets were generated every five minutes on the day that Japan was struck by a devastating earthquake and tsunami. Humanitarian organi-zations are ill-equipped to manage this volume and velocity of information. In fact, the lack of analysis of this “Big Data” has spawned all kinds of suppositions about the perceived value—or lack thereof—that social media holds for emer-gency response operations. So just what percentage of tweets are relevant for humanitarian response?

One of the very few rigorous and data-driven studies that addresses this question is Dr. Sarah Vieweg‘s 2012 doctoral dissertation on “Situational Awareness in Mass Emergency: Behavioral and Linguistic Analysis of Disaster Tweets.” After manually analyzing four distinct disaster datasets, Vieweg finds that only 8% to 20% of tweets generated during a crisis provide situational awareness. This implies that the vast majority of tweets generated during a crisis have zero added value vis-à-vis humanitarian response. So critics have good reason to be skeptical about the value of social media for disaster response.

At the same time, however, even if we take Vieweg’s lower bound estimate, 8%, this means that over 40,000 tweets generated during the first 72 hours of Hurricane Sandy may very well have provided increased situational awareness. In the case of Japan, more than 100,000 tweets generated every 5 minutes may have provided additional situational awareness. This volume of relevant infor-mation is much higher and more real-time than the information available to humanitarian responders via traditional channels.

Furthermore, preliminary research by QCRI’s Crisis Computing Team show that 55.8% of 206,764 tweets generated during a major disaster last year were “Informative,” versus 22% that were “Personal” in nature. In addition, 19% of all tweets represented “Eye-Witness” accounts, 17.4% related to information about “Casualty/Damage,” 37.3% related to “Caution/Advice,” while 16.6% related to “Donations/Other Offers.” Incidentally, the tweets were automatically classified using algorithms developed by QCRI. The accuracy rate of these ranged from 75%-81% for the “Informative Classifier,” for example. A hybrid platform could then push those tweets that are inaccurately classified to a micro-tasking platform for manual classification, if need be.

This research at QCRI constitutes the first phase of our work to develop a Twitter Dashboard for the Humanitarian Cluster System, which you can read more about in this blog post. We are in the process of analyzing several other twitter datasets in order to refine our automatic classifiers. I’ll be sure to share our preliminary observations and final analysis via this blog.

The Limits of Crowdsourcing Crisis Information and The Promise of Advanced Computing


First, I want to express my sincere gratitude to the dozen or so iRevolution readers who recently contacted me. I have indeed not been blogging for the past few weeks but this does not mean I have decided to stop blogging altogether. I’ve simply been ridiculously busy (and still am!). But I truly, truly appreciate the kind encouragement to continue blogging, so thanks again to all of you who wrote in.

Now, despite the (catchy?) title of this blog post, I am not bashing crowd-sourcing or worshipping on the alter of technology. My purpose here is simply to suggest that the crowdsourcing of crisis information is an approach that does not scale very well. I have lost count of the number of humanitarian organizations who said they simply didn’t have hundreds of volunteers available to manually monitor social media and create a live crisis map. Hence my interest in advanced computing solutions.

The past few months at the Qatar Computing Research Institute (QCRI) have made it clear to me that developing and applying advanced computing solutions to address major humanitarian challenges is anything but trivial. I have learned heaps about social computing, machine learning and big data analytics. So I am now more aware of the hurdles but am even more excited than before about the promise that advanced computing holds for the development of next-generation humanitarian technology.

The way forward combines both crowdsourcing and advanced computing. The next generation of humanitarian technologies will take a hybrid approach—at times prioritizing “smart crowdsourcing” and at other times leading with automated algorithms. I shall explain what I mean by smart crowdsourcing in a future post. In the meantime, the video above from my recent talk at TEDxSendai expands on the themes I have just described.

Innovation and the State of the Humanitarian System

Published by ALNAP, the 2012 State of the Humanitarian System report is an important evaluation of the humanitarian community’s efforts over the past two years. “I commend this report to all those responsible for planning and delivering life saving aid around the world,” writes UN Under-Secretary General Valerie Amos in the Preface. “If we are going to improve international humanitarian response we all need to pay attention to the areas of action highlighted in the report.” Below are some of the highlighted areas from the 100+ page evaluation that are ripe for innovative interventions.

Accessing Those in Need

Operational access to populations in need has not improved. Access problems continue and are primarily political or security-related rather than logistical. Indeed, “UN security restrictions often place sever limits on the range of UN-led assessments,” which means that “coverage often can be compromised.” This means that “access constraints in some contexts continue to inhibit an accurate assessment of need. Up to 60% of South Sudan is inaccessible for parts of the year. As a result, critical data, including mortality and morbidity, remain unavailable. Data on nutrition, for example, exist in only 25 of 79 countries where humanitarian partners have conducted surveys.”

Could satellite and/or areal imagery be used to measure indirect proxies? This would certainly be rather imperfect but perhaps better than nothing? Could crowdseeding be used?

Information and Communication Technologies

“The use of mobile devices and networks is becoming increasingly important, both to deliver cash and for communication with aid recipients.” Some humanitarian organizations are also “experimenting with different types of communication tools, for different uses and in different contexts. Examples include: offering emergency information, collecting information for needs assessments or for monitoring and evaluation, surveying individuals, or obtaining information on remote populations from an appointed individual at the community level.”

“Across a variety of interventions, mobile phone technology is seen as having great potential to increase efficiency. For example, […] the governments of Japan and Thailand used SMS and Twitter to spread messages about the disaster response.” Naturally, in some contexts, “traditional means like radios and call centers are most appropriate.”

In any case, “thanks to new technologies and initiatives to advance commu-nications with affected populations, the voices of aid recipients began, in a small way, to be heard.” Obviously, heard and understood are not the same thing–not to mention heard, understood and responded to. Moreover, as disaster affected communities become increasingly “digital” thanks to the spread of mobile phones, the number of voices will increase significantly. The humanitarian system is largely (if not completely) unprepared to handle this increase in volume (Big Data).

Consulting Local Recipients

Humanitarian organizations have “failed to consult with recipients […] or to use their input in programming.” Indeed, disaster-affected communities are “rarely given opportunities to assess the impact of interventions and to comment on performance.” In fact, “they are rarely treated as end-users of the service.” Aid recipients also report that “the aid they received did not address their ‘most important needs at the time.'” While some field-level accountability mechanisms do exist, they were typically duplicative and very project oriented. To this end, “it might be more efficient and effective to have more coordination between agencies regarding accountability approaches.”

While the ALNAP report suggests that these shortcomings could “be addressed in the near future by technical advances in methods of needs assessment,” the challenge here is not simply a technical one. Still, there are important efforts underway to address these issues.

Improving Needs Assessments

The Inter-Agency Standing Committee’s (IASC) Needs Assessment Task Force (NAFT) and the International NGO-led Assessment Capacities Project (ACAPS) are two such exempts of progress. OCHA serves as the secretariat for the NAFT through its Assessment and Classification of Emergencies (ACE) Team. ACAPS, which is a consortium of three international NGOs (X, Y and Z) and a member of NATF, aims to “strengthen the capacity of the humanitarian sector in multi-sectoral needs assessment.” ACAPS is considered to have “brought sound technical processes and practical guidelines to common needs assessment.” Note that both ACAPS and ACE have recently reached out to the Digital Humanitarian Network (DHNetwork) to partner on needs-assessment projects in South Sudan and the DRC.

Another promising project is the Humanitarian Emergency Settings Perceived Needs Scale (HESPER). This join initiative between WHO and King’s College London is designed to rapidly assess the “perceived needs of affected populations and allow their views to be taken into consideration. The project specifically aims to fill the gap between population-based ‘objective’ indicators […] and/or qualitative data based on convenience samples such as focus groups or key informant interviews.” On this note, some NGOs argue that “overall assessment methodologies should focus far more at the community (not individual) level, including an assessment of local capacities […],” since “far too often international aid actors assume there is no local capacity.”

Early Warning and Response

An evaluation of the response in the Horn of Africa found “significant disconnects between early warning systems and response, and between technical assessments and decision-makers.” According to ALNAP, “most commentators agree that the early warning worked, but there was a failure to act on it.” This disconnect is a concern I voiced back in 2009 when UN Global Pulse was first launched. To be sure, real-time information does not turn an organization into a real-time organization. Not surprisingly, most of the aid recipients surveyed for the ALNAP report felt that “the foremost way in which humanitarian organizations could improve would be to: ‘be faster to start delivering aid.'” Interestingly, “this stands in contrast to the survey responses of international aid practitioners who gave fairly high marks to themselves for timeliness […].”

Rapid and Skilled Humanitarians

While the humanitarian system’s surge capacity for the deployment of humanitarian personnel has improved, “findings also suggest that the adequate scale-up of appropriately skilled […] staff is still perceived as problematic for both operations and coordination.” Other evaluations “consistently show that staff in NGOs, UN agencies and clusters were perceived to be ill prepared in terms of basic language and context training in a significant number of contexts.” In addition, failures in knowledge and understanding of humanitarian principles were also raised. Furthermore, evaluations of mega-disasters “predictably note influxes or relatively new staff with limited experience.” Several evaluations noted that the lack of “contextual knowledge caused a net decrease in impact.” This lend one senior manager noted:

“If you don’t understand the political, ethnic, tribal contexts it is difficult to be effective… If I had my way I’d first recruit 20 anthropologists and political scientists to help us work out what’s going on in these settings.”

Monitoring and Evaluation

ALNAP found that monitoring and evaluation continues to be a significant shortcoming in the humanitarian system. “Evaluations have made mixed progress, but affected states are still notably absent from evaluating their own response or participating in joint evaluations with counterparts.” Moreover, while there have been important efforts by CDAC and others to “improve accountability to, and communication with, aid recipients,” there is “less evidence to suggest that this new resource of ground-level information is being used strategically to improve humanitarian interventions.” To this end, “relatively few evaluations focus on the views of aid recipients […].” In one case, “although a system was in place with results-based indicators, there was neither the time nor resources to analyze or use the data.”

The most common reasons cited for failing to meet community expectations include the “inability to meet the full spectrum of need, weak understanding of local context, inability to understand the changing nature of need, inadequate information-gathering techniques or an inflexible response approach.” In addition, preconceived notions of vulnerability have “led to inappropriate interventions.” A major study carried out by Tufts University and cited in the ALNAP report concludes that “humanitarian assistance remains driven by ‘anecdote rather than evidence’ […].” One important exception to this is the Danish Refugee Council’s work in Somalia.

Leadership, Risk and Principles

ALNAP identifies an “alarming evidence of a growing tendency towards risk aversion” and a “stifling culture of compliance.” In addition, adherence to humanitarian principles were found to have weakened as “many humanitarian organizations have willingly compromised a principled approach in their own conduct through close alignment with political and military activities and actors.” Moreover, “responses in highly politicized contexts are viewed as particularly problematic for the retention of humanitarian principles.” Humanitarian professionals who were interviewed by ALNAP for this report “highlighted multiple occasions when agencies failed to maintain an impartial response when under pressure from strong states, such as Pakistan and Sri Lanka.”

How People in Emergencies Use Communication to Survive

“Still Left in the Dark? How People in Emergencies Use Communication to Survive — And How Humanitarian Agencies Can Help” is an excellent report pub-lished by the BBC World Service Trust earlier this year. It is a follow up to the BBC’s 2008 study “Left in the Dark: The Unmet Need for Information in Humanitarian Emergencies.” Both reports are absolute must-reads. I highlight the most important points from the 2012 publication below.

Are Humanitarians Being Left in the Dark?

The disruptive impact of new information and communication technologies (ICTs) is hardly a surprise. Back in 2007, researchers studying the use of social media during “forest fires in California concluded that ‘these emergent uses of social media are pre-cursors of broader future changes to the institutional and organizational arrangements of disaster response.'” While the main danger in 2008 was that disaster-affected communities would continue to be left in the dark since humanitarian organizations were not prioritizing information delivery, in 2012, “it may now be the humanitarian agencies themselves […] who risk being left in the dark.” Why? “Growing access to new technologies make it more likely that those affected by disaster will be better placed to access information and communicate their own needs.” Question is: “are humanitarian agencies prepared to respond to, help and engage with those who are communicating with them and who demand better information?” Indeed, “one of the consequences of greater access to, and the spread of, communications technology is that communities now expect—and demand—interaction.”

Monitoring Rumors While Focusing on Interaction and Listening

The BBC Report invites humanitarian organizations to focus on meaningful interaction with disaster-affected communities, rather than simply on message delivery. “Where agencies do address the question of communication with affected communities, this still tends to be seen as a question of relaying infor-mation (often described as ‘messaging’) to an unspecified ‘audience’ through a channel selected as appropriate (usually local radio). It is to be delivered when the agency thinks that it has something to say, rather than in response to demand. In an environment in which […] interaction is increasingly expected, this approach is becoming more and more out of touch with community needs. It also represents a fundamental misunderstanding of the nature and potential of many technological tools particularly Twitter, which work on a real time many-to-many information model rather than a simple broadcast.”

Two-way communication with disaster-affected communities requires two-way listening. Without listening, there can be no meaningful communication. “Listening benefits agencies, as well as those with whom they communicate. Any agency that does not monitor local media—including social media—for misinformation or rumors about their work or about important issues, such as cholera awareness risks, could be caught out by the speed at which information can move.” This is an incredibly important point. Alas, humanitarian organ-izations have not caught up with recent advances in social computing and big data analytics. This is one of the main reasons I joined the Qatar Computing Research Institute (QCRI); i.e., to spearhead the development of next-generation humani-tarian technology solutions.

Combining SMS with Geofencing for Emergency Alerts

Meanwhile, in Haiti, “phone company Digicel responded to the 2010 cholera outbreak by developing methods that would send an SMS to anyone who travelled through an identified cholera hotspot, alerting them to the dangers and advising on basic precautions.” The later is an excellent example of geofencing in action. That said, “while responders tend to see communication as a process either of delivering information (‘messaging’) or extracting it, disaster survivors seem to see the ability to communicate and the process of communication itself as every bit as important as the information delivered.”

Communication & Community-Based Disaster Response Efforts

As the BBC Report notes, “there is also growing evidence that communities in emergencies are adept at leveraging communications technology to organize their own responses.” This is indeed true as these recent examples demonstrate:

“Communications technology is empowering first responders in new and extremely potent ways that are, at present, little understood by international humanitarians. While aid agencies hesitate, local communities are using commu-nications technology to reshape the way they prepare for and respond to emergencies.” There is a definite payoff to those agencies that employ an “integrated approach to communicating and engaging with disaster affected communities […]” since they are “viewed more positively by beneficiaries than those that [do] not.” Indeed, “when disaster survivors are able to communicate with aid agencies their perceptions become more positive.”

Using New Technologies to Manage Local Feedback Mechanisms

So why don’t more agencies follow suite? Many are concerned that establishing feedback systems will prove impossible to manage let alone sustain. They fear that “they would not be able to answer questions asked, that they [would] not have the skills or capacity to manage the anticipated volume of inputs and that they [would be] unequipped to deal with people who would (it is assumed) be both angry and critical.”

I wonder whether these aid agencies realize that many private sector companies have feedback systems that engage millions of customers everyday; that these companies are using social media and big data analytics to make this happen. Some are even crowdsourcing their customer service support. It is high time that the humanitarian community realize that the challenges they face aren’t that unique and that solutions have already been developed in other sectors.

There are only a handful of examples of positive deviance vis-a-vis the setting up of feedback systems in the humanitarian space. Oxfam found that simply com-bining the “automatic management of SMS systems” with “just one dedicated local staff member […] was enough to cope with demand.” When the Danish Refugee Council set up their own SMS complaints mechanism, they too expected be overwhelmed with criticisms. “To their surprise, more than half of the SMS’s they received via their feedback system […] have been positive, with people thanking the agency for their assistance […].” This appears to be a pattern since “many other agencies reported receiving fewer ‘difficult’ questions than anticipated.”

Naturally, “a systematic and resourced approach for feedback” is needed either way. Interestingly, “many aid agencies are in fact now running de facto feedback and information line systems without realizing it. […] most staff who work directly with disaster survivors will be asked for contact details by those they interact with, and will give their own personal mobile numbers.” These ad hoc “systems” are hardly efficient, well-resourced or systematic, however.

User-Generated Content, Representativeness and Ecosystems

Obviously, user-generated content shared via social media may not be represen-tative. “But, as costs fall and coverage increases, all the signs are that usage will increase rapidly in rural areas and among poorer people. […] As one Somali NGO staff member commented […], ‘they may not have had lunch — but they’ll have a mobile phone.'” Moreover, there is growing evidence that individuals turn to social media platforms for the first time as a result of crisis. “In Thailand, for example, the use of social media increased 20% when the 2010 floods began–with fairly equal increases found in metropolitan Bangkok and in rural provinces.”

While the vast majority of Haitians in Port-au-Prince are not on Twitter, “the city’s journalists overwhelmingly are and and see it as an essential source of news and updates.” Since most Haitians listen to radio, “they are, in fact, the indirect beneficiaries of Twitter information systems.” Another interesting fact: “In Kenya, 27% of radio listeners tune in via their mobile phones.” This highlights the importance of an ecosystem approach when communicating with disaster-affected communities. On a related note, recent statistics reveal that individuals in developing countries spend about 17.5% of their income on ICTs compared to just 1.5% in developing countries.