Tag Archives: Monitoring

Artificial Intelligence for Monitoring Elections (AIME)

AIME logo

I published a blog post with the same title a good while back. Here’s what I wrote at the time:

Citizen-based, crowdsourced election observation initiatives are on the rise. Leading election monitoring organizations are also looking to leverage citizen-based reporting to complement their own professional election monitoring efforts. Meanwhile, the information revolution continues apace, with the number of new mobile phone subscriptions up by over 1 billion in just the past 36 months alone. The volume of election-related reports generated by “the crowd” is thus expected to grow significantly in the coming years. But international, national and local election monitoring organizations are completely unprepared to deal with the rise of Big (Election) Data.

I thus introduced a new project to “develop a free and open source platform to automatically filter relevant election reports from the crowd.” I’m pleased to report that my team and I at QCRI have just tested AIME during an actual election for the very first time—the 2015 Nigerian Elections. My QCRI Research Assistant Peter Mosur (co-author of this blog post) collaborated directly with Oludotun Babayemi from Clonehouse Nigeria and Chuks Ojidoh from the Community Life Project & Reclaim Naija to deploy and test the AIME platform.

AIME is a free and open source (experimental) solution that combines crowd-sourcing with Artificial Intelligence to automatically identify tweets of interest during major elections. As organizations engaged in election monitoring well know, there can be a lot chatter on social media as people rally behind their chosen candidates, announce this to the world, ask their friends and family who they will be voting for, and updating others when they have voted while posting about election related incidents they may have witnessed. This can make it rather challenging to find reports relevant to election monitoring groups.

WP1

Election monitors typically monitor instances of violence, election rigging, and voter issues. These incidents are monitored because they reveal problems that arise with the elections. Election monitoring initiatives such as Reclaim Naija & Uzabe also monitor several other type of incidents but for the purposes of testing the AIME platform, we selected three types of events mentioned above. In order to automatically identify tweets related to these events, one must first provide AIME with example tweets. (Of course, if there is no Twitter traffic to begin with, then there won’t be much need for AIME, which is precisely why we developed an SMS extension that can be used with AIME).

So where does the crowdsourcing comes in? Users of AIME can ask the crowd to tag tweets related to election-violence, rigging and voter issues by simply clicking on tagging tweets posted to the AIME platform with the appropriate event type. (Several quality control mechanisms are built in to ensure data quality. Also, one does not need to use crowdsourcing to tag the tweets; this can be done internally as well or instead). What AIME does next is use a technique from Artificial Intelligence (AI) called statistical machine learning to understand patterns in the human-tagged tweets. In other words, it begins to recognize which tweets belong in which category type—violence, rigging and voter issues. AIME will then auto-classify new tweets that are related to these categories (and can auto-classify around 2 millions tweets or text messages per minute).

Screen Shot 2015-04-10 at 8.33.08 AM

Before creating our automatic classifier for the Nigerian Elections, we first needed to collect examples of tweets related to election violence, rigging and voter issues in order to teach AIME. Oludotun Babayemi and Chuks Ojidoh kindly provided the expert local knowledge needed to identify the keywords we should be following on Twitter (using AIME). They graciously gave us many different keywords to use as well as a list of trusted Twitter accounts to follow for election-related messages. (Due to difficulties with AIME, we were not able to use the trusted accounts. In addition, many of the suggested keywords were unusable since words like “aggressive”, “detonate”, and “security” would have resulted in large amount of false positives).

Here is the full list of keywords used by AIME:

Nigeria elections, nigeriadecides, Nigeria decides, INEC, GEJ, Change Nigeria, Nigeria Transformation, President Jonathan, Goodluck Jonathan, Sai Buhari, saibuhari, All progressives congress, Osibanjo, Sambo, Peoples Democratic Party, boko haram, boko, area boys, nigeria2015, votenotfight, GEJwinsit, iwillvoteapc, gmb2015, revoda, thingsmustchange,  and march4buhari   

Out of this list, “NigeriaDecides” was by far the most popular keyword used in the elections. It accounted for over 28,000 Tweets of a batch of 100,000. During the week leading up to the elections, AIME collected roughly 800,000 Tweets. Over the course of the elections and the few days following, the total number of collected Tweets jumped to well over 4 million.

We sampled just a handful of these tweets and manually tagged those related to violence, rigging and other voting issues using AIME. “Violence” was described as “threats, riots, arming, attacks, rumors, lack of security, vandalism, etc.” while “Election Rigging” was described as “Ballot stuffing, issuing invalid ballot papers, voter impersonation, multiple voting, ballot boxes destroyed after counting, bribery, lack of transparency, tampered ballots etc.” Lastly, “Voting Issues” was defined as “Polling station logistics issues, technical issues, people unable to vote, media unable to enter, insufficient staff, lack of voter assistance, inadequate voting materials, underage voters, etc.”

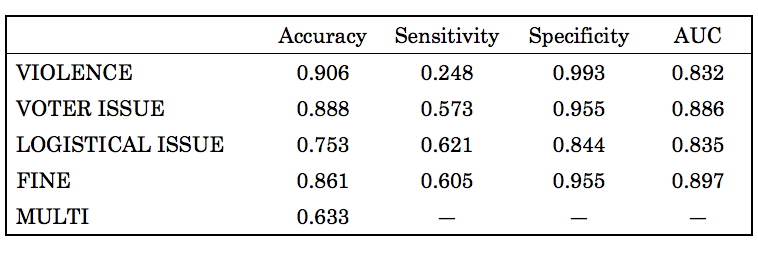
Any tweet that did not fall into these three categories was tagged as “Other” or “Not Related”. Our Election Classifiers were trained with a total of 571 human-tagged tweets which enabled AIME to automatically classify well over 1 million tweets (1,263,654 to be precise). The results in the screenshot below show accurate AIME was at auto-classifying tweets based on the different event types define earlier. AUC is what captures the “overall accuracy” of AIME’s classifiers.

AIME_Nigeria

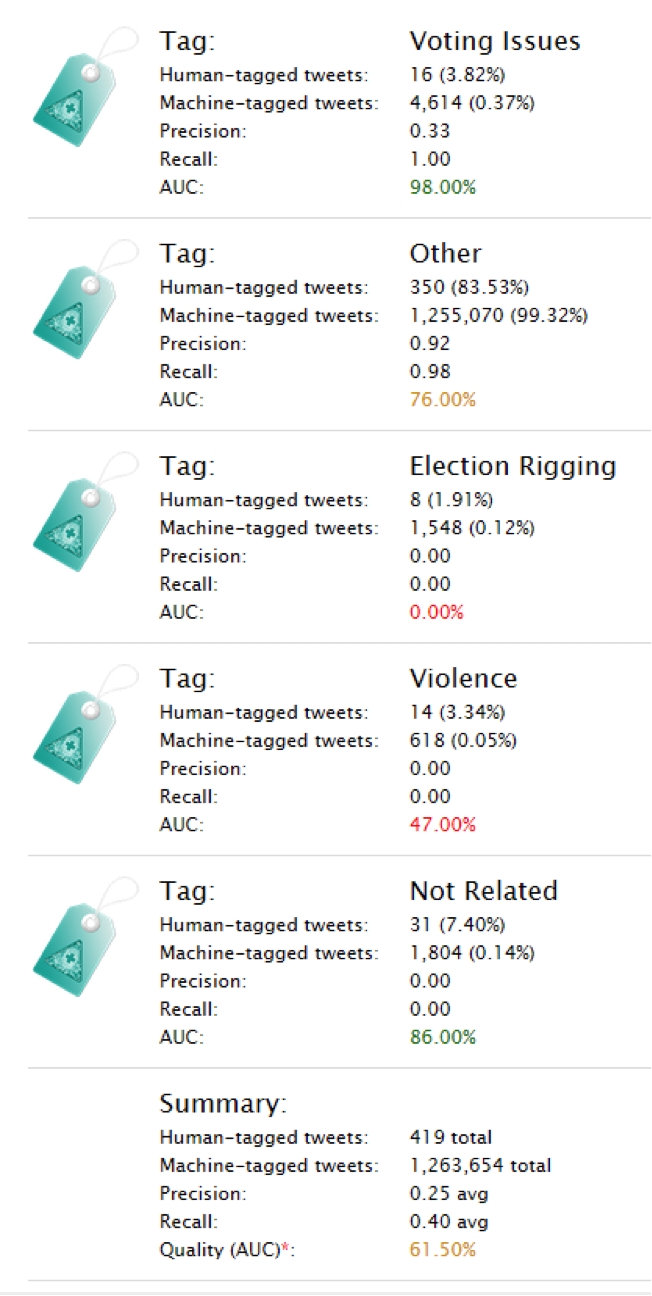
AIME was rather good at correctly tagging tweets related to “Voting Issues” (98% accuracy) but drastically poor at tagging related to “Election Rigging” (0%). This is not AIME’s fault : ) since it only had 8 examples to learn from. As for “Violence”, the accuracy score was 47%, which is actually surprising given that AIME only had 14 human-tagged examples to learn from. Lastly, AIME did fairly well at auto-classifying unrelated tweets (accuracy of 86%).

Conclusion: this was the first time we tested AIME during an actual election and we’ve learned a lot in the process. The results are not perfect but enough to press on and experiment further with the AIME platform. If you’d like to test AIME yourself (and if you fully recognize that the tool is experimental and still under development, hence not perfect), then feel free to get in touch with me here. We have 2 slots open for testing. In the meantime, big thanks to my RA Peter for spearheading both this deployment and the subsequent research.

Automatically Classifying Crowdsourced Election Reports

As part of QCRI’s Artificial Intelligence for Monitoring Elections (AIME) project, I liaised with Kaggle to work with a top notch Data Scientist to carry out a proof of concept study. As I’ve blogged in the past, crowdsourced election monitoring projects are starting to generate “Big Data” which cannot be managed or analyzed manually in real-time. Using the crowdsourced election reporting data recently collected by Uchaguzi during Kenya’s elections, we therefore set out to assess whether one could use machine learning to automatically tag user-generated reports according to topic, such as election-violence. The purpose of this post is to share the preliminary results from this innovative study, which we believe is the first of it’s kind.

uchaguzi

The aim of this initial proof-of-concept study was to create a model to classify short messages (crowdsourced election reports) into several predetermined categories. The classification models were developed by applying a machine learning technique called gradient boosting on word features extracted from the text of the election reports along with their titles. Unigrams, bigrams and the number of words in the text and title were considered in the model development. The tf-idf weighting function was used following internal validation of the model.

The results depicted above confirm that classifiers can be developed to automatically classify short election observation reports crowdsourced from the public. The classification was generated by 10-fold cross validation. Our classifier is able to correctly predict whether a report is related to violence with an accuracy of 91%, for example. We can also accurately predict  89% of reports that relate to “Voter Issues” such as registration issues and reports that indicate positive events, “Fine” (86%).

The plan for this Summer and Fall is to replicate this work for other crowdsourced election datasets from Ghana, Liberia, Nigeria and Uganda. We hope the insights gained from this additional research will reveal which classifiers and/or “super classifiers” are portable across certain countries and election types. Our hypothesis, based on related crisis computing research, is that classifiers for certain types of events will be highly portable. However, we also hypothesize that the application of most classifiers across countries will result in lower accuracy scores. To this end, our Artificial Intelligence for Monitoring Elections platform will allow election monitoring organizations (end users) to create their own classifiers on the fly and thus meet their own information needs.

bio

Big thanks to Nao for his excellent work on this predictive modeling project.

Artificial Intelligence for Monitoring Elections (AIME)

Citizen-based, crowdsourced election observation initiatives are on the rise. Leading election monitoring organizations are also looking to leverage citizen-based reporting to complement their own professional election monitoring efforts. Meanwhile, the information revolution continues apace, with the number of new mobile phone subscriptions up by over 1 billion in just the past 36 months alone. The volume of election-related reports generated by “the crowd” is thus expected to grow significantly in the coming years. But international, national and local election monitoring organizations are completely unprepared to deal with the rise of Big (Election) Data.

Liberia2011

The purpose of this collaborative research project, AIME, is to develop a free and open source platform to automatically filter relevant election reports from the crowd. The platform will include pre-defined classifiers (e.g., security incidents,  intimidation, vote-buying, ballot stuffing etc.) for specific countries and will also allow end-users to create their own classifiers on the fly. The project, launched by QCRI and several key partners, will specifically focus on unstructured user-generated content from SMS and Twitter. AIME partners include a major international election monitoring organization and several academic research centers. The AIME platform will use the technology being developed for QCRI’s AIDR project: Artificial Intelligence for Disaster Response.

Bio

  • Acknowledgements Fredrik Sjoberg kindly provided the Uchaguzi data which he scraped from the public website at the time.
  • Qualification: Professor Michael Best has rightly noted that these preliminary results are overstated given that the machine learning analysis was carried out on corpus of pre-structured reports.

Social Network Analysis for Digital Humanitarian Response

Monitoring social media for digital humanitarian response can be a massive undertaking. The sheer volume and velocity of tweets generated during a disaster makes real-time social media monitoring particularly challenging if not near impossible. However, two new studies argue that there is “a better way to track the spread of information on Twitter that is much more powerful.”

Twitter-Hadoop31

Manuel Garcia-Herranz and his team at the Autonomous University of Madrid in Spain use small groups of “highly connected Twitter users as ‘sensors’ to detect the emergence of new ideas. They point out that this works because highly co-nnected individuals are more likely to receive new ideas before ordinary users.” The test their hypothesis, the team studied 40 million Twitters users who “together totted up 1.5 billion follows’ and sent nearly half a billion tweets, including 67 million containing hashtags.”

They found that small groups of highly connected Twitter users detect “new hashtags about seven days earlier than the control group.  In fact, the lead time varied between nothing at all and as much as 20 days.” Manuel and his team thus argue that “there’s no point in crunching these huge data sets. You’re far better off picking a decent sensor group and watching them instead.” In other words, “your friends could act as an early warning system, not just for gossip, but for civil unrest and even outbreaks of disease.”

The second study, “Identifying and Characterizing User Communities on Twitter during Crisis Events,” (PDF) is authored by Aditi Gupta et al. Aditi and her co-lleagues analyzed three major crisis events (Hurricane Irene, Riots in England and Earthquake in Virginia) to “to identify the different user communities, and characterize them by the top central users.” Their findings are in line with those shared by the team in Madrid. “[T]he top users represent the topics and opinions of all the users in the community with 81% accuracy on an average.” In sum, “to understand a community, we need to monitor and analyze only these top users rather than all the users in a community.”

How could these findings be used to prioritize the monitoring of social media during disasters? See this blog post for more on the use of social network analysis (SNA) for humanitarian response.

Traditional vs. Crowdsourced Election Monitoring: Which Has More Impact?

Max Grömping makes a significant contribution to the theory and discourse of crowdsourced election monitoring in his excellent study: “Many Eyes of Any Kind? Comparing Traditional and Crowdsourced Monitoring and their Contribu-tion to Democracy” (PDF). This 25-page study is definitely a must-read for anyone interested in this topic. That said, Max paints a false argument when he writes: “It is believed that this new methodology almost magically improves the quality of elections […].” Perhaps tellingly, he does not reveal who exactly believes in this false magic. Nor does he cite who subscribes to the view that  “[…] crowdsourced citizen reporting is expected to have significant added value for election observation—and by extension for democracy.”

My doctoral dissertation focused on the topic of crowdsourced election observa-tion in countries under repressive rule. At no point in my research or during interviews with activists did I come across this kind of superficial mindset or opinion. In fact, my comparative analysis of crowdsourced election observation showed that the impact of these initiatives was at best minimal vis-a-vis electoral accountability—particularly in the Sudan. That said, my conclusions do align with Max’s principle findings: “the added value of crowdsourcing lies mainly in the strengthening of civil society via a widened public sphere and the accumulation of social capital with less clear effects on vertical and horizontal accountability.”

This is huge! Traditional monitoring campaigns don’t strengthen civil society or the public sphere. Traditional monitoring teams are typically composed of inter-national observers and thus do not build social capital domestically. At times, traditional election monitoring programs may even lead to more violence, as this recent study revealed. But the point is not to polarize the debate. This is not an either/or argument but rather a both/and issue. Traditional and crowdsourced election observation efforts can absolutely complement each other precisely because they each have a different comparative advantage. Max concurs: “If the crowdsourced project is integrated with traditional monitoring from the very beginning and thus serves as an additional component within the established methodology of an Election Monitoring Organization, the effect on incentive structures of political parties and governments should be amplified. It would then include the best of both worlds: timeliness, visualization and wisdom of the crowd as well as a vetted methodology and legitimacy.”

Recall Jürgen Habermas and his treatise that “those who take on the tools of open expression become a public, and the presence of a synchronized public increasingly constrains un-democratic rulers while expanding the right of that public.” Why is this important? Because crowdsourced election observation projects can potentially bolster this public sphere and create local ownership. Furthermore, these efforts can help synchronize shared awareness, an important catalyzing factor of social movements, according to Habermas. Furthermore, my colleague Phil Howard has convincingly demonstrated that a large active online civil society is a key causal factor vis-a-vis political transitions towards more democratic rule. This is key because the use of crowdsourcing and crowd-mapping technologies often requires some technical training, which can expand the online civil society that Phil describes and render that society more active (as occurred in Egypt during the 2010 Parliamentary Elections—see  dissertation).

The problem? There is very little empirical research on crowdsourced election observation projects let alone assessments of their impact. Then again, these efforts at crowdsourcing are only a few years old and many do’ers in this space are still learning how to be more effective through trial and error. Incidentally, it is worth noting that there has also been very little empirical analysis on the impact of traditional monitoring efforts: “Further quantitative testing of the outlined mechanisms is definitely necessary to establish a convincing argument that election monitoring has positive effects on democracy.”

In the second half of his important study, Max does an excellent job articulating the advantages and disadvantages of crowdsourced election observation. For example, he observes that many crowdsourced initiatives appear to be spon-taneous rather than planned. Therein lies part of the problem. As demonstrated in my dissertation, spontaneous crowdsourced election observation projects are highly unlikely to strengthen civil society let alone build any kind of social capital. Furthermore, in order to solicit a maximum number of citizen-generated election reports, a considerable amount of upfront effort on election awareness raising and education needs to take place in addition to partnership outreach not to mention a highly effective media strategy.

All of this requires deliberate, calculated planning and preparation (key to an effective civil society), which explains why Egyptian activists were relatively more successful in their crowdsourced election observation efforts compared to their counterparts in the Sudan (see dissertation). This is why I’m particularly skeptical of Max’s language on the “spontaneous mechanism of protection against electoral fraud or other abuses.” That said, he does emphasize that “all this is of course contingent on citizens being informed about the project and also the project’s relevance in the eyes of the media.”

I don’t think that being informed is enough, however. An effective campaign not only seeks to inform but to catalyze behavior change, no small task. Still Max is right to point out that a crowdsourced election observation project can “encou-rage citizens to actively engage with this information, to either dispute it, confirm it, or at least register its existence.” To this end, recall that political change is a two-step process, with the second—social step—being where political opinions are formed (Katz and Lazarsfeld 1955). “This is the step in which the Internet in general, and social media in particular, can make a difference” (Shirky 2010). In sum, Max argues that “the public sphere widens because this engagement, which takes place in the context of the local all over the country, is now taken to a wider audience by the means of mapping and real-time reporting.” And so, “even if crowdsourced reports are not acted upon, the very engagement of citizens in the endeavor to directly make their voices heard and hold their leaders accountable widens the public sphere considerably.”

Crowdsourcing efforts are fraught with important and very real challenges, as is already well known. Reliability of crowdsourced information, risk of hate speech spread via uncontrolled reports, limited evidence of impact, concerns over security and privacy of citizen reporters, etc. That said, it is important to note that this “field” is evolving and many in this space are actively looking for solutions to these challenges. During the 2010 Parliamentary Elections in Egypt, the U-Shahid project was able to verify over 90% of the crowdsourced reports. The “field” of information forensics is becoming more sophisticated and variants to crowdsourcing such as bounded crowdsourcing and crowdseeding are not only being proposed but actually implemented.

The concern over unconfirmed reports going viral has little to do with crowd-sourcing. Moreover, the vast majority of crowdsourced election observation initiatives I have studied moderate all content before publication. Concerns over security and privacy are issues not limited to crowdsourced election observation and speak to a broader challenge. There are already several key initiatives underway in the humanitarian and crisis mapping community to address these important challenges. And lest we forget, there are few empirical studies that demonstrate the impact of traditional monitoring efforts in the first place.

In conclusion, traditional monitors are sometimes barred from observing an election. In the past, there have been few to no alternatives to this predicament. Today, crowdsourced efforts are sure to swell up. Furthermore, in the event that traditional monitors conclude that an election was stolen, there’s little they can do to catalyze a local social movement to place pressure on the thieves. This is where crowdsourced election observation efforts could have an important contribution. To quote Max: “instead of being fearful of the ‘uncontrollable crowd’ and criticizing the drawbacks of crowdsourcing, […] governments would be well-advised to embrace new social media. Citizens […] will use new techno-logies and new channels for information-sharing anyway, whether endorsed by their governments or not. So, governments might as well engage with ICTs and crowdsourcing proactively.”

Big thanks to Max for this very valuable contribution to the discourse and to my colleague Tiago Peixoto for flagging this important study.

Big Data Philanthropy for Humanitarian Response

My colleague Robert Kirkpatrick from Global Pulse has been actively promoting the concept of “data philanthropy” within the context of development. Data philanthropy involves companies sharing proprietary datasets for social good. I believe we urgently need big (social) data philanthropy for humanitarian response as well. Disaster-affected communities are increasingly the source of big data, which they generate and share via social media platforms like twitter. Processing this data manually, however, is very time consuming and resource intensive. Indeed, large numbers of digital humanitarian volunteers are often needed to monitor and process user-generated content from disaster-affected communities in near real-time.

Meanwhile, companies like Crimson Hexagon, Geofeedia, NetBase, Netvibes, RecordedFuture and Social Flow are defining the cutting edge of automated methods for media monitoring and analysis. So why not set up a Big Data Philanthropy group for humanitarian response in partnership with the Digital Humanitarian Network? Call it Corporate Social Responsibility (CRS) for digital humanitarian response. These companies would benefit from the publicity of supporting such positive and highly visible efforts. They would also receive expert feedback on their tools.

This “Emergency Access Initiative” could be modeled along the lines of the International Charter whereby certain criteria vis-a-vis the disaster would need to be met before an activation request could be made to the Big Data Philanthropy group for humanitarian response. These companies would then provide a dedicated account to the Digital Humanitarian Network (DHNet). These accounts would be available for 72 hours only and also be monitored by said companies to ensure they aren’t being abused. We would simply need to  have relevant members of the DHNet trained on these platforms and draft the appropriate protocols, data privacy measures and MoUs.

I’ve had preliminary conversations with humanitarian colleagues from the United Nations and DHnet who confirm that “this type of collaboration would be see very positively from the coordination area within the traditional humanitarian sector.” On the business development end, this setup would enable companies to get their foot in the door of the humanitarian sector—a multi-billion dollar industry. Members of the DHNet are early adopters of humanitarian technology and are ideally placed to demonstrate the added value of these platforms since they regularly partner with large humanitarian organizations. Indeed, DHNet operates as a partnership model. This would enable humanitarian professionals to learn about new Big Data tools, see them in action and, possibly, purchase full licenses for their organizations. In sum, data philanthropy is good for business.

I have colleagues at most of the companies listed above and thus plan to actively pursue this idea further. In the meantime, I’d be very grateful for any feedback and suggestions, particularly on the suggested protocols and MoUs. So I’ve set up this open and editable Google Doc for feedback.

Big thanks to the team at the Disaster Information Management Research Center (DIMRC) for planting the seeds of this idea during our recent meeting. Check out their very neat Emergency Access Initiative.

Behind the Scenes: The Digital Operations Center of the American Red Cross

The Digital Operations Center at the American Red Cross is an important and exciting development. I recently sat down with Wendy Harman to learn more about the initiative and to exchange some lessons learned in this new world of digital  humanitarians. One common challenge in emergency response is scaling. The American Red Cross cannot be everywhere at the same time—and that includes being on social media. More than 4,000 tweets reference the Red Cross on an average day, a figure that skyrockets during disasters. And when crises strike, so does Big Data. The Digital Operations Center is one response to this scaling challenge.

Sponsored by Dell, the Center uses customized software produced by Radian 6 to monitor and analyze social media in real-time. The Center itself sits three people who have access to six customized screens that relate relevant information drawn from various social media channels. The first screen below depicts some of key topical areas that the Red Cross monitors, e.g., references to the American Red Cross, Storms in 2012, and Delivery Services.

Circle sizes in the first screen depict the volume of references related to that topic area. The color coding (red, green and beige) relates to sentiment analysis (beige being neutral). The dashboard with the “speed dials” right underneath the first screen provides more details on the sentiment analysis.

Lets take a closer look at the circles from the first screen. The dots “orbiting” the central icon relate to the categories of key words that the Radian 6 platform parses. You can click on these orbiting dots to “drill down” and view the individual key words that make up that specific category. This circles screen gets updated in near real-time and draws on data from Twitter, Facebook, YouTube, Flickr and blogs. (Note that the distance between the orbiting dots and the center does not represent anything).

An operations center would of course not be complete without a map, so the Red Cross uses two screens to visualize different data on two heat maps. The one below depicts references made on social media platforms vis-a-vis storms that have occurred during the past 3 days.

The screen below the map highlights the bio’s of 50 individual twitter users who have made references to the storms. All this data gets generated from the “Engagement Console” pictured below. The purpose of this web-based tool, which looks a lot like Tweetdeck, is to enable the Red Cross to customize the specific types of information they’re looking form, and to respond accordingly.

Lets look at the Consul more closely. In the Workflow section on the left, users decide what types of tags they’re looking for and can also filter by priority level. They can also specify the type of sentiment they’re looking, e.g., negative feelings vis-a-vis a particular issue. In addition, they can take certain actions in response to each information item. For example, they can reply to a tweet, a Facebook status update, or a blog post; and they can do this directly from the engagement consul. Based on the license that the Red Cross users, up to 25 of their team members can access the Consul and collaborate in real-time when processing the various tweets and Facebook updates.

The Consul also allows users to create customized timelines, charts and wordl graphics to better understand trends changing over time in the social media space. To fully leverage this social media monitoring platform, Wendy and team are also launching a digital volunteers program. The goal is for these volunteers to eventually become the prime users of the Radian platform and to filter the bulk of relevant information in the social media space. This would considerably lighten the load for existing staff. In other words, the volunteer program would help the American Red Cross scale in the social media world we live in.

Wendy plans to set up a dedicated 2-hour training for individuals who want to volunteer online in support of the Digital Operations Center. These trainings will be carried out via Webex and will also be available to existing Red Cross staff.


As  argued in this previous blog post, the launch of this Digital Operations Center is further evidence that the humanitarian space is ready for innovation and that some technology companies are starting to think about how their solutions might be applied for humanitarian purposes. Indeed, it was Dell that first approached the Red Cross with an expressed interest in contributing to the organization’s efforts in disaster response. The initiative also demonstrates that combining automated natural language processing solutions with a digital volunteer net-work seems to be a winning strategy, at least for now.

After listening to Wendy describe the various tools she and her colleagues use as part of the Operations Center, I began to wonder whether these types of tools will eventually become free and easy enough for one person to be her very own operations center. I suppose only time will tell. Until then, I look forward to following the Center’s progress and hope it inspires other emergency response organizations to adopt similar solutions.

Analyzing U-Shahid’s Election Monitoring Reports from Egypt

I’m excited to be nearing the completion of my dissertation research. As regular iRevolution readers will know, the second part of my dissertation is a qualitative and comparative analysis of the use of the Ushahidi platform in both Egypt and the Sudan. As part of this research, I am carrying out some content analysis of the reports mapped on U-Shahid and SudanVoteMonitor. The purpose of this blog post is to share my preliminary analysis of the 2,700 election monitoring reports published on U-Shahid during Egypt’s Parliamentary Elections in November & December 2010.

All of U-Shahid‘s reports are available in this Excel file. The reports were originally submitted in Arabic, so I’ve had them translated into English for my research. While I’ve spent a few hours combing through these reports, I’m sure that I didn’t pick up on all the interesting ones, so if any iRev readers do go through the data, I’d super grateful if you could let me know about any other interesting tid-bits you uncover.

Before I get to the content analysis, I should note that the Development and Institutionalization Support Center (DISC)—the Egyptian group based in Cairo that launched the U-Shahid project—used both crowdsourcing and “blogger-sourcing.” That is, the group trained some 130 bloggers and activists in five key cities around Egypt to monitor the elections and report their observations in real-time on the live map they set up. For the crowdsourced reports, DISC worked with a seasoned journalist from Thomson-Reuters to set up verification guidelines that allowed them to validate the vast majority of such reports.

My content analysis of the reports focused primarily on those that seemed to shed the most transparency on the elections and electoral campaigns. To this end, the analysis sought to pick up any trends or recurring patterns in the U-Shahid reports. The topics most frequently addressed in the reports included bribes for buying off votes, police closing off roads leading to polling centers, the destruction and falsification of election ballets, evidence of violence in specific locations, the closing of polling centers before the official time and blocking local election observers from entering polling centers.

What is perhaps most striking about the reports, however, are how specific they are and not only in terms of location, e.g., polling center. For example, reports that document the buying of votes often include the amount paid for the vote. This figure varied from 20 Egyptian Pounds (about $3) to 300 Egyptian Pounds (around $50). As to be expected, perhaps, the price increased through the election period, with one report citing that the bribe price at one location had gone from 40 Pounds to 100 over night.

Another report submitted on December 5, 2010 was even more specific: “Buying out votes in Al Manshiaya Province as following: 7:30[am] price of voter was 100 pound […]. At 12[pm] the price of voter was 250 pound, at 3 pm the price was 200 pound, at 5 pm the price was 300 pound for half an hour, and at 6 pm the price was 30 pound.” Another report revealed “bribe-fixing” by noting that votes ranged from 100-150 Pounds as a result of a “coalition between delegates to reduce the price in Ghirbal, Alexandria.” Other reports documented non-financial bribes, including mobile phones, food, gas and even “sex stimulators”, “Viagra” and “Tramadol tablets”.

Additional incidents mapped on the Ushahidi platform included reports of deliberate power cuts to prevent people from voting. As a result, one voter complained in “Al Saaida Zaniab election center: we could not find my name in voters lists, despite I voted in the same committee. Nobody helped to find my name on list because the electricity cut out.” In general, voters also complained about the lack of phosphoric ink for voting and the fact that they were not asked for their IDs to vote.

Reports also documented harassment and violence by thugs, often against Muslim Brotherhood candidates, the use of Quran verses in election speeches and the use of mini buses at polling centers to bus in people from the National Party. For example, one reported noted that “Oil Minister Samir Fahmy who is National nominee for Al Nassr City for Peoples Council uses his power to mobilize employees to vote for him. The employees used the companies buses carrying the nominee’ pictures to go to the election centers.” Several hundred reports included pictures and videos, some clearly documenting obvious election fraud. In contrast, however, there were also several reports that documented calm, “everything is ok” around certain voting centers.

In a future blog post, I’ll share the main findings from my interviews with the key Egyptian activists who were behind the U-Shahid project. In the meantime, if you choose to look through the election monitoring reports, please do let me know if you find anything else of interest, thank you!

Crisis Mapping for Monitoring & Evaluation

I was pleasantly surprised when local government ministry representatives in the Sudan (specifically Kassala) directly requested training on how to use the UNDP’s Threat and Risk Mapping Analysis (TRMA) platforms to monitor and evaluate their own programs.

Introduction

The use of crisis mapping for monitoring and evaluation (M&E) had cropped up earlier this year in separate conversations with the Open Society Institute (OSI) and MercyCorps. The specific platform in mind was Ushahidi, and the two organizations were interested in exploring the possibility of using the platform to monitor the impact of their funding and/or projects.

As far as I know, however, little to no rigorous research has been done on the use of crisis mapping for M&E. The field of M&E is far more focused on change over time than over space. Clearly, however, post-conflict recovery programs are implemented in both time and space. Furthermore, any conflict sensitivity programming must necessarily take into account spatial factors.

CartaMetrix

The only reference to mapping for M&E that I was able to find online was one paragraph in relation to the Cartametrix 4D map player. Here’s the paragraph (which I have split into to ease legibility) and below a short video demo I created:

“The Cartametrix 4D map player is visually compelling and fun to use, but in terms of tracking results of development and relief programs, it can be much more than a communications/PR tool. Through analyzing impact and results across time and space, the 4D map player also serves as a good program management tool. The map administrator has the opportunity to set quarterly, annual, and life of project indicator targets based on program components, regions, etc.

Tracking increases in results via the 4D map players, gives a program manager a sense of the pace at which targets are being reached (or not). Filtering by types of activities also provides for a quick and easy way to visualize which types of activities are most effectively resulting in achievements toward indicator targets. Of course, depending on the success of the program, an organization may or may not want to make the map (or at least all facets of the map) public. Cartametrix understands this and is able to create internal program management map applications alongside the publicly available map that doesn’t necessarily present all of the available data and analysis tools.”

Mapping Baselines

I expect that it will only be a matter of time until the M&E field recognizes the added value of mapping. Indeed, why not use mapping as a contributing tools in the M&E process, particularly within the context of formative evaluation?

Clearly, mapping can be one contributing tool in the M&E process. To be sure, baseline data can be collected, time-stamped and mapped. Mobile phones further facilitate this spatially decentralized process of information collection. Once baseline data is collected, the organization would map the expected outcomes of the projects they’re rolling out and estimated impact date against this baseline data.

The organization would then implement local development and/or conflict management programs  in certain geographical areas and continue to monitor local tensions by regularly collecting geo-referenced data on the indicators that said projects are set to influence. Again, these trends would be compared to the initial baseline.

These program could then be mapped and data on local tensions animated over time and space. The dynamic mapping would provide an intuitive and compelling way to demonstrate impact (or the lack thereof) in certain geographical areas where the projects were rolled out as compared to other similar areas with no parallel projects. Furthermore, using spatial analysis for M&E could also be a way to carry out a gap analysis and to assess whether resources are being allocated efficiently in more complex environments.

Next Steps

One of my tasks at TRMA is to develop a short document on using crisis mapping for M&E so if anyone has any leads on applied research in this area, I would be much obliged.

Patrick Philippe Meier

Blackberry Burried by India?

I just spoke with a colleague at RIM/Blackberry who mentioned that the Indian news is abuzz in response to the government’s demand that they be granted access to all calls and emails from every Blackberry in the country. RIM has some 400,000 Blackberry users in India which is an important source of revenue. Indeed, Blackberry users in India spend some $28/month; the global average is $22 and the average mobile phone user in India only spends some $5 a month.

BBerry

The government argues that these measures are a question of national security given fears of terrorism in the country. The security agencies have therefore asked that Blackberry deposit its decryption keys or allow communications to be intercepted. The latest news is that India’s ministry of telecommunications has requested RIM to put up servers in India, which would help securities agencies monitor the services.

In my opinion, all this does is send a message to potential terrorists not to use Blackberries.

Patrick Philippe Meier