Personal Reflections: 3 Years After the Haiti Earthquake

The devastating earthquake that struck Port-au-Prince on January 12, 2010 killed as many as 200,000 people. My fiancée and five close friends were in Haiti at the time and narrowly escaped a collapsing building. They were some of the lucky few survivors. But I had no knowledge that they had survived until 8 hours or so after the earthquake because we were unable get any calls through. The Haiti Crisis Map I subsequently spearheaded still stands as the most psycho-logically and emotionally difficult project I’ve ever been a part of.

The heroes of this initiative and the continuing source of my inspiration today were the hundreds and hundreds of volunteers who ensured the Haiti Crisis Map remained live for so many weeks. The majority of these volunteers were of course the Haitian Diaspora as well as Haitians in country. I had the honor of meeting and working with one of these heroes while in Port-au-Prince, Kurt Jean-Charles, the CEO of the Haitian software company Solutions.ht. I invited Kurt to give the Keynote at the 2010 International Crisis Mappers Conference (ICCM 2010) and highly recommend watching the video above. Kurt speaks directly from the heart.

HaitianDiaspora

Another personal hero of mine (pictured above) is Sabina Carlson—now Sabina Carlson Robillard following her recent wedding to Louino in Port-au-Prince! She volunteered as the Haitian Diaspora Liaison for the Haiti Crisis Map and has been living in Cité Soleil ever since. Needless to say, she continues to inspire all of us who have had the honor of working with her and learning from her.

Finally, but certainly not (!) least, the many, many hundreds of amazing volun-teers who tirelessly translated tens of thousands of text messages for this project. Thanks to you, some 1,500 messages from the disaster-affected population were added to the live crisis map of Haiti. This link points to the only independent, rigorous and professional evaluation of the project that exists. I highly reco-mmend reading this report as it comprises a number of important lessons learned in crisis mapping and digital humanitarian response.

Fonkoze

In the meantime, please consider making a donation to Fonkoze, an outstanding local organization committed to the social and economic improvement of the Haitian poor. Fonkoze is close to my heart not only because of the great work that they do but also because its staff and CEO were the ones who ensured the safe return of my fiancée and friends after the earthquake. In fact, my fiancée has continued to collaborate with them ever since and still works on related projects in Haiti. She is headed back to Port-au-Prince this very weekend. To make a tax deductible donation to Fonkoze, please visit this link. Thank you.

My thoughts & prayers go out to all those who lost loved ones in Haiti years ago.

Comparing the Quality of Crisis Tweets Versus 911 Emergency Calls

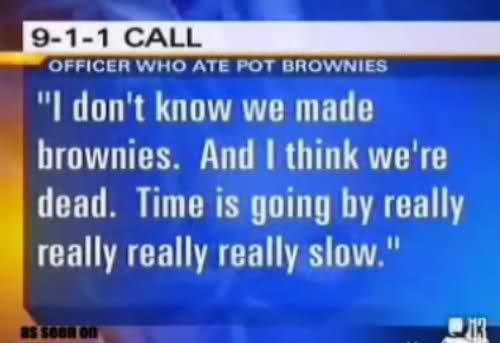
In 2010, I published this blog post entitled “Calling 911: What Humanitarians Can Learn from 50 Years of Crowdsourcing.” Since then, humanitarian colleagues have become increasingly open to the use of crowdsourcing as a methodology to  both collect and process information during disasters.  I’ve been studying the use of twitter in crisis situations and have been particularly interested in the quality, actionability and credibility of such tweets. My findings, however, ought to be placed in context and compared to other, more traditional, reporting channels, such as the use of official emergency telephone numbers. Indeed, “Information that is shared over 9-1-1 dispatch is all unverified information” (1).

911ex

So I did some digging and found the following statistics on 911 (US) & 999 (UK) emergency calls:

  • “An astounding 38% of some 10.4 million calls to 911 [in New York City] during 2010 involved such accidental or false alarm ‘short calls’ of 19 seconds or less — that’s an average of 10,700 false calls a day”.  – Daily News
  • “Last year, seven and a half million emergency calls were made to the police in Britain. But fewer than a quarter of them turned out to be real emergencies, and many were pranks or fakes. Some were just plain stupid.” – ABC News

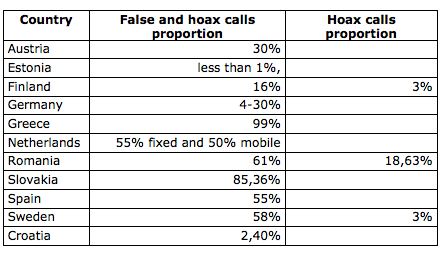
I also came across the table below in this official report (PDF) published in 2011 by the European Emergency Number Association (EENA). The Greeks top the chart with a staggering 99% of all emergency calls turning out to be false/hoaxes, while Estonians appear to be holier than the Pope with less than 1% of such calls.

Screen Shot 2012-12-11 at 4.45.34 PM

Point being: despite these “data quality” issues, European law enforcement agencies have not abandoned the use of emergency phone numbers to crowd-source the reporting of emergencies. They are managing the challenge since the benefit of these number still far outweigh the costs. This calculus is unlikely to change as law enforcement agencies shift towards more mobile-based solutions like the use of SMS for 911 in the US. This important shift may explain why tra-ditional emergency response outfits—such as London’s Fire Brigade—are putting in place processes that will enable the public to report via Twitter.

For more information on the verification of crowdsourced social media informa-tion for disaster response, please follow this link.

What Waze Can Teach Us About Crowdsourcing and Crisis Mapping

I recently tried out Waze, “the world’s fastest-growing community-based traffic and navigation app.” The smart phone app enables drivers to easily share real-time traffic and road information, “saving everyone time and gas money on their daily commute.” Waze is quite possibly the most successful live, crowdsourced mapping platform there is. Over 30 million drivers use the app to “outsmart traffic and get everyone the best route to work and back, every day.”

Why is Waze so successful? Because the creators of this app recognize full well that “Traffic is more than just red lines on the map.” Likewise, Crisis Mapping is also more than just dots on the map. But unlike Waze, groups like Ushahidi have not adopted dynamic geo-fencing features (despite my best efforts back in 2011). With Waze, drivers get automatically alerted before they approach police, accidents, road hazards or traffic jams, all shared by other drivers in real time. “It’s like a personal heads-up from a few million of your friends on the road.” The creators of Waze have also integrated gaming and social networking features into their app, something I also lobbied Ushahidi to do years ago. Not only is updating Waze super easy and fast to update, it is also fun and rewarding—which reminds me of the “Fisher Price Theory of Crisis Mapping.”

Just like drivers on the motorway, humanitarians do not have the time to keep watching and analyzing dots on a map. They have to keep their hands “on the wheel” and focus on the more important tasks at hand. Crisis Mapping platforms therefore have to be hands-free and more voice-based to limit the distraction of tactile data entry. In other words, the interface needs to become invisible. As computing pioneer Mark Weiser noted, “The best technology should be invisible, get out of your way, and let you live your life.” My colleague Amber Case add that “We shouldn’t have to fiddle with interfaces. We should be humans; machines should be machines; each amplifying the best of both. Wouldn’t that make for a nice reality?” This is what Waze is doing by integrating very neat user-interface features and voice-based controls, which improve situational awareness and facilitates real-time decision-making.

In conclusion, Waze’s clever user-centered design features are also relevant to map-based development and human rights projects in the majority world (i.e. developing countries). Otherwise, the value of digital maps is more like that of news articles—that is, informative but not necessarily operational and actionable for local decision-making purposes.

bio

See also: Waze Helps Drivers Get Around Damage from Oklahoma Tornadoes

Tweeting is Believing? Analyzing Perceptions of Credibility on Twitter

What factors influence whether or not a tweet is perceived as credible? According to this recent study, users have “difficulty discerning truthfulness based on con-tent alone, with message topic, user name, and user image all impacting judg-ments of tweets and authors to varying degrees regardless of the actual truth-fulness of the item.”

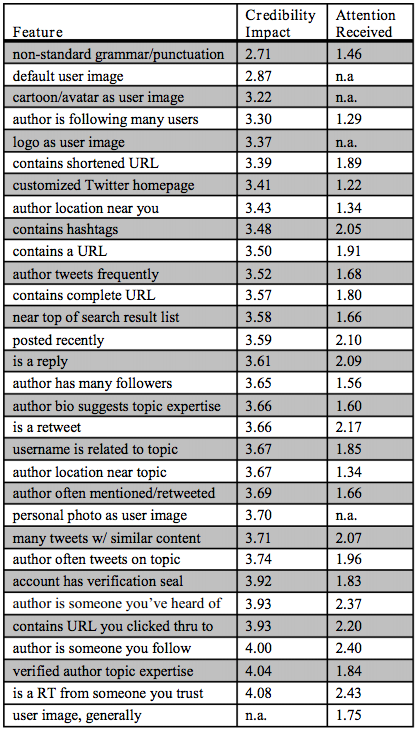
For example, “Features associated with low credibility perceptions were the use of non-standard grammar and punctuation, not replacing the default account image, or using a cartoon or avatar as an account image. Following a large number of users was also associated with lower author credibility, especially when unbalanced in comparison to follower count […].” As for features enhan-cing a tweet’s credibility, these included “author influence (as measured by follower, retweet, and  mention counts), topical expertise (as established through a Twitter homepage bio, history of on-topic tweeting, pages outside of Twitter, or having a location relevant to the topic of the tweet), and reputation (whether an author is someone a user follows, has heard of, or who has an official Twitter account verification seal). Content related features viewed as credibility-enhancing were containing a URL leading to a high-quality site, and the existence of other tweets conveying similar information.”

 In general, users’ ability to “judge credibility in practice is largely limited to those features visible at-a-glance in current UIs (user picture, user name, and tweet content). Conversely, features that often are obscured in the user interface, such as the bio of a user, receive little attention despite their ability to impact cred-ibility judgments.” The table below compares a features’s perceived credibility impact with the attention actually allotted to assessing that feature.

“Message topic influenced perceptions of tweet credibility, with science tweets receiving a higher mean tweet credibility rating than those about either politics  or entertainment. Message topic had no statistically significant impact on perceptions of author credibility.” In terms of usernames, “Authors with topical names were considered more credible than those with traditional user names, who were in turn considered more credible than those with internet name styles.” In a follow up experiment, the study analyzed perceptions of credibility vis-a-vis a user’s image, i.e., the profile picture associated with a given Twitter account. “Use of the default Twitter icon significantly lowers ratings of content and marginally lowers ratings of authors […]” in comparison to generic, topical, female and male images.

Obviously, “many of these metrics can be faked to varying extents. Selecting a topical username is trivial for a spam account. Manufacturing a high follower to following ratio or a high number of retweets is more difficult but not impossible. User interface changes that highlight harder to fake factors, such as showing any available relationship between a user’s network and the content in question, should help.” Overall, these results “indicate a discrepancy between features people rate as relevant to determining credibility and those that mainstream social search engines make available.” The authors of the study conclude by suggesting changes in interface design that will enhance a user’s ability to make credibility judgements.

“Firstly, author credentials should be accessible at a glance, since these add value and users rarely take the time to click through to them. Ideally this will include metrics that convey consistency (number of tweets on topic) and legitimization by other users (number of mentions or retweets), as well as details from the author’s Twitter page (bio, location, follower/following counts). Second, for con-tent assessment, metrics on number of retweets or number of times a link has been shared, along with who is retweeting and sharing, will provide consumers with context for assessing credibility. […] seeing clusters of tweets that conveyed similar messages was reassuring to users; displaying such similar clusters runs counter to the current tendency for search engines to strive for high recall by showing a diverse array of retrieved items rather than many similar ones–exploring how to resolve this tension is an interesting area for future work.”

In sum, the above findings and recommendations explain why platforms such as RapportiveSeriously Rapid Source Review (SRSR) and CrisisTracker add so much value to the process of assessing the credibility of tweets in near real-time. For related research: Predicting the Credibility of Disaster Tweets Automatically and: Automatically Ranking the Credibility of Tweets During Major Events.

Social Media = Social Capital = Disaster Resilience?

Do online social networks generate social capital, which, in turn, increases resilience to disasters? How might one answer this question? For example, could we analyze Twitter data to capture levels of social capital in a given country? If so, do countries with higher levels of social capital (as measured using Twitter) demonstrate greater resiliences to disasters?

Twitter Heatmap Hurricane

These causal loops are fraught with all kinds of intervening variables, daring assumptions and econometric nightmares. But the link between social capital and disaster resilience is increasingly accepted. In “Building Resilience: Social Capital in Post-Disaster Recover,” Daniel Aldrich draws on both qualitative and quantita-tive evidence to demonstrate that “social resources, at least as much as material ones, prove to be the foundation for resilience and recovery.” A concise summary of his book is available in my previous blog post.

So the question that follows is whether the link between social media, i.e., online social networks and social capital can be established. “Although real-world organizations […] have demonstrated their effectiveness at building bonds, virtual communities are the next frontier for social capital-based policies,” writes Aldrich. Before we jump into the role of online social networks, however, it is important to recognize the function of “offline” communities in disaster response and resilience.
iran-reliefs

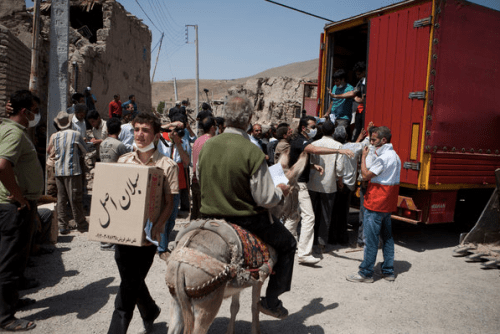
“During the disaster and right after the crisis, neighbors and friends—not private firms, government agencies, or NGOs—provide the necessary resources for resilience.” To be sure, “the lack of systematic assistance from government and NGOs [means that] neighbors and community groups are best positioned to undertake efficient initial emergency aid after a disaster. Since ‘friends, family, or coworkers of victims and also passersby are always the first and most effective responders, “we should recognize their role on the front line of disasters.”

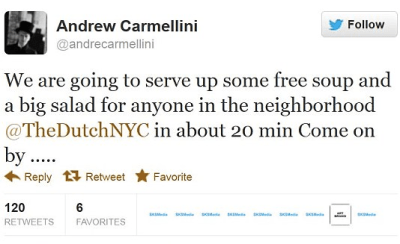
In sum, “social ties can serve as informal insurance, providing victims with information, financial help and physical assistance.” This informal insurance, “or mutual assistance involves friends and neighbors providing each other with information, tools, living space, and other help.” Data driven research on tweets posted during disasters reveal that many provide victims with information, help, tools, living space, assistance and other help. But this support is also provided to complete strangers since it is shared openly and publicly on Twitter. “[…] Despite—or perhaps because of—horrendous conditions after a crisis, survivors work together to solve their problems; […] the amount of (bounding) social capital seems to increase under difficult conditions.” Again, this bonding is not limited to offline dynamics but occurs also within and across online social networks. The tweet below was posted in the aftermath of Hurricane Sandy.
Sandy Tweets Mutual Aid

“By providing norms, information, and trust, denser social networks can implement a faster recovery.” Such norms also evolve on Twitter, as does information sharing and trust building. So is the degree of activity on Twitter directly proportional to the level of community resilience?

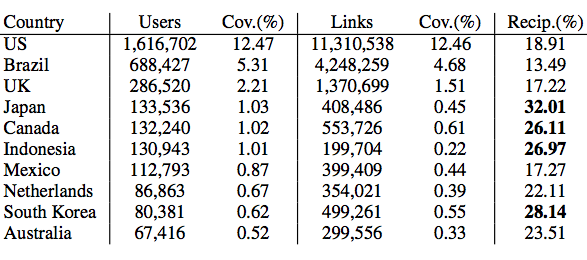
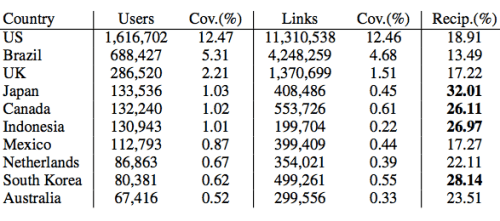
This data-driven study, “Do All Birds Tweet the Same? Characterizing Twitter Around the World,” may shed some light in this respect. The authors, Barbara Poblete, Ruth Garcia, Marcelo Mendoza and Alejandro Jaimes, analyze various aspects of social media–such as network structure–for the ten most active countries on Twitter. In total, the working dataset consisted close to 5 million users and over 5 billion tweets. The study is the largest one carried out to date on Twitter data, “and the first one that specifically examines differences across different countries.”
Screen Shot 2012-11-30 at 6.19.45 AM

The network statistics per country above reveals that Japan, Canada, Indonesia and South Korea have highest percentage of reciprocity on Twitter. This is important because according to Poblet et al., “Network reciprocity tells us about the degree of cohesion, trust and social capital in sociology.” In terms of network density, “the highest values correspond to South Korea, Netherlands and Australia.” Incidentally, the authors find that “communities which tend to be less hierarchical and more reciprocal, also displays happier language in their content updates. In this sense countries with high conversation levels (@) … display higher levels of happiness too.”

If someone is looking for a possible dissertation topic, I would recommend the following comparative case study analysis. Select two of the four countries with highest percentage of reciprocity on Twitter: Japan, Canada, Indonesia and South Korea. The two you select should have a close “twin” country. By that I mean a country that has many social, economic and political factors in common. The twin countries should also be in geographic proximity to each other since we ultimately want to assess how they weather similar disasters. The paired can-didates that come to mind are thus: Canada & US and Indonesia & Malaysia.

Next, compare the countries’ Twitter networks, particularly degrees of  recipro-city since this metric appears to be a suitable proxy for social capital. For example, Canada’s reciprocity score is 26% compared to 19% for the US. In other words, quite a difference. Next, identify recent  disasters that both countries have experienced. Do the affected cities in the respective countries weather the disasters differently? Is one community more resilient than the other? If so, do you find a notable quantitative difference in their Twitter networks and degrees of reciprocity? If so, does a subsequent comparative qualitative analysis support these findings?

As cautioned earlier, these causal loops are fraught with all kinds of intervening variables, daring assumptions and econometric nightmares. But if anyone wants to brave the perils of applied social science research, and finds the above re-search questions of interest, then please do get in touch!

Debating the Value of Tweets For Disaster Response (Intelligently)

With every new tweeted disaster comes the same old question: what is the added value of tweets for disaster response? Only a handful of data-driven studies actually bother to move the debate beyond anecdotes. It is thus high time that a meta-level empirical analysis of the existing evidence be conducted. Only then can we move towards a less superficial debate on the use of social media for disaster response and emergency management.

In her doctoral research Dr. Sarah Vieweg found that between 8% and 24% of disaster tweets she studied “contain information that provides tactical, action-able information that can aid people in making decisions, advise others on how to obtain specific information from various sources, or offer immediate post-impact help to those affected by the mass emergency.” Two of the disaster datasets that Vieweg analyzed were the Red River Floods of 2009 and 2010. The tweets from the 2010 disaster resulted in a small increase of actionable tweets (from ~8% to ~9%). Perhaps Twitter users are becoming more adept at using Twitter during crises? The lowest number of actionable tweets came from the Red River Floods of 2009, whereas the highest came from the Haiti Earthquake of 2010. Again, there is variation—this time over space.

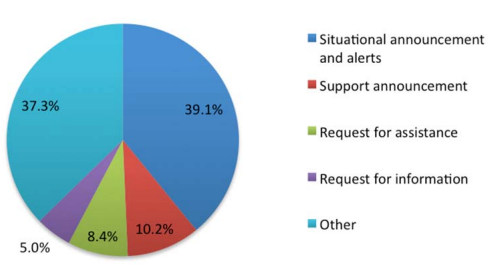
In this separate study, over 64,000 tweets generated during Thailand’s major floods in 2011 were analyzed. The results indicate that about 39% of these tweets belonged to the “Situational Awareness and Alerts” category. “Twitter messages in this category include up-to-date situational and location-based information related to the flood such as water levels, traffic conditions and road conditions in certain areas. In addition, emergency warnings from authorities advising citizens to evacuate areas, seek shelter or take other protective measures are also included.” About 8% of all tweets (over 5,000 unique tweets) were “Requests for Assistance,” while 5% were “Requests for Information Categories.”

TwitterDistribution

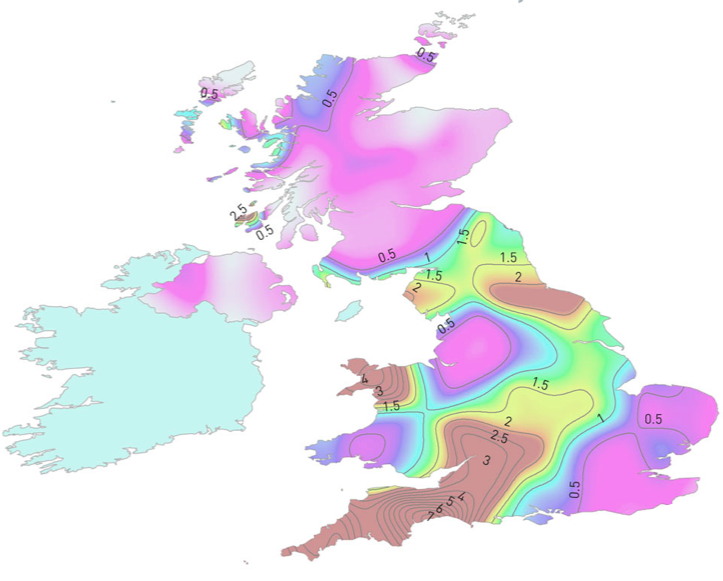
In this more recent study, researchers mapped flood-related tweets and found a close match between that resulting map and the official government flood map. In the map below, tweets were normalized, such that values greater than one mean more tweets than would be expected in normal Twitter traffic. “Unlike many maps of online phenomena, careful analysis and mapping of Twitter data does NOT simply mirror population densities. Instead con-centration of twitter activity (in this case tweets containing the keyword flood) seem to closely reflect the actual locations of floods and flood alerts even when we simply look at the total counts.” This also implies that a relatively high number of flood-related tweets must have contained accurate information.

TwitterMapUKfloods

Shifting from floods to fires, this earlier research analyzed some 1,700 tweets generated during Australia’s worst bushfire in history. About 65% of the tweets had “factual details,” i.e., “more than three of every five tweets had useful infor-mation.” In addition, “Almost 22% of the tweets had geographical data thus identifying location of the incident which is critical in crisis reporting.” Around 7% of the tweets were seeking information, help or answers. Finally, close to 5% (about 80 tweets) were considered “directly actionable.”

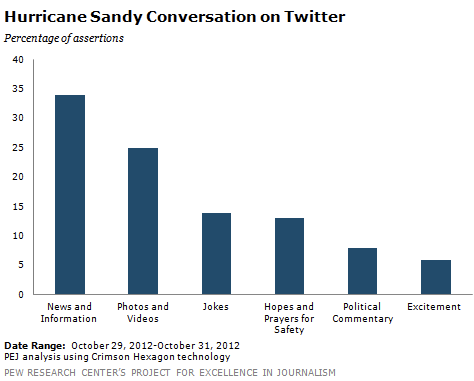
Preliminary findings from applied research that I am carrying out with my Crisis Computing team at QCRI also reveal variation in value. In one disaster dataset we studied, up to 56% of the tweets were found to be informative. But in two other datasets, we found the number of informative tweets to be very low. Meanwhile, a recent Pew Research study found that 34% of tweets during Hurricane Sandy “involved news organizations providing content, government sources offering information, people sharing their own eyewitness accounts and still more passing along information posted by others.” In addition, “fully 25% [of tweets] involved people sharing photos and videos,” thus indicating “the degree to which visuals have become a more common element of this realm.”

Finally, this recent study analyzed over 35 million tweets posted by ~8 million users based on current trending topics. From this data, the authors identified 14 major events reflected in the tweets. These included the UK riots, Libya crisis, Virginia earthquake and Hurricane Irene, for example. The authors found that “on average, 30% of the content about an event, provides situational awareness information about the event, while 14% was spam.”

So what can we conclude from these few studies? Simply that the value of tweets for disaster response can vary considerably over time and space. The debate should thus not center around whether tweets yield added value for disaster response but rather what drives this variation in value. Identifying these drivers may enable those with influence to incentivize high-value tweets.

This interesting study, “Do All Birds Tweet the Same? Characterizing Twitter Around the World,” reveals some very interesting drivers. The social network analysis (SNA) of some 5 million users and 5 billion tweets across 10 countries reveals that “users in the US give Twitter a more informative purpose, which is reflected in more globalized communities, which are more hierarchical.” The study is available here (PDF). This American penchant for posting “informative” tweets is obviously not universal. To this end, studying network typologies on Twitter may yield further insights on how certain networks can be induced—at a structural level—to post more informative tweets following major disasters.

Twitter Pablo Gov

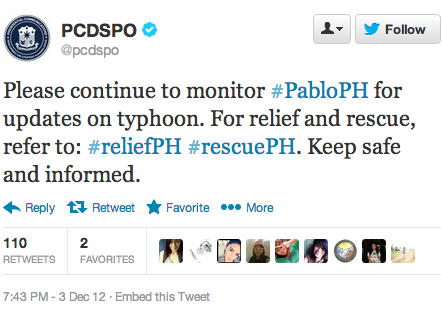
Regardless of network typology, however, policy still has an important role to play in incentivizing high-value tweets. To be sure, if demand for such tweets is not encouraged, why would supply follow? Take the forward-thinking approach by the Government of the Philippines, for example. The government actively en-couraged users to use specific hashtags for disaster tweets days before Typhoon Pablo made landfall. To make this kind of disaster reporting via twitter more actionable, the Government could also encourage the posting of pictures and the use of a structured reporting syntax—perhaps a simplified version of the Tweak the Tweet approach. Doing so would not only provide the government with greater situational awareness, it would also facilitate self-organized disaster response initiatives.

In closing, perhaps we ought to keep in mind that even if only, say, 0.001% of the 20 million+ tweets generated during the first five days of Hurricane Sandy were actionable and only half of these were accurate, this would still mean over a thousand informative, real-time tweets, or about 15,000 words, or 25 pages of single-space, relevant, actionable and timely disaster information.

PS. While the credibility and veracity of tweets is an important and related topic of conversation, I have already written at length about this.

Analyzing Tweets From Australia’s Worst Bushfires

As many as 400 fires were identified in Victoria on February 7, 2010. These resulted in Australia’s highest ever loss of life from a bushfire; 173 people were killed and over 400 injured. This analysis of 1,684 tweets generated during these fires found that they were “laden with actionable factual information which contrasts with earlier claims that tweets are of no value made of mere random personal notes.”

Of the 705 unique users who exchanged tweets during the fires, only two could be considered “official sources of communication”; both accounts were held by ABC Radio Melbourne. “This demonstrates the lack of state or government based initiatives to use social media tools for official communication purposes. Perhaps the growth in Twitter usage for political campaigns will force policy makers to reconsider.” In any event, about 65% of the tweets had “factual details,” i.e., “more than three of every five tweets had useful information.” In addition, “Almost 22% of the tweets had geographical data thus identifying location of the incident which is critical in crisis reporting.” Around 7% of the tweets were see-king information, help or answers. Finally, close to 5% (about 80 tweets) were “directly actionable.”

While 5% is obviously low, there’s no reason why this figure has to remain this low. If humanitarian organizations were to create demand for posting actionable information on Twitter, this would likely increase the supply of more actionable content. Take for example the pro-active role taken by the Philippines Govern-ment vis-a-vis the use of Twitter for disaster response. In any case, the findings from the above study do reveal that 65% of tweets had useful information. Surely contacting the publishers of those tweets could produce even more directly actionable content—which is why the BBC’s User-Generated Content Hub (UGC) uses follow-up as strategy to verify content posted on social media.

Finally, keep in mind that calls to emergency numbers like “911” in the US and “000” in Australia are not spontaneously actionable. That is, human operators who handle these emergency calls ask a series of detailed questions in order to turn the information into structured, actionable content. Some of these standard questions are: What is your emergency? What is your current location? What is your phone number? What is happening? When did the incident occur? Are there injuries? etc. In other words, without being prompted with specific questions, callers are unlikely to provide as much actionable information. The same is true for the use of twitter in crisis response.


Does Social Capital Drive Disaster Resilience?

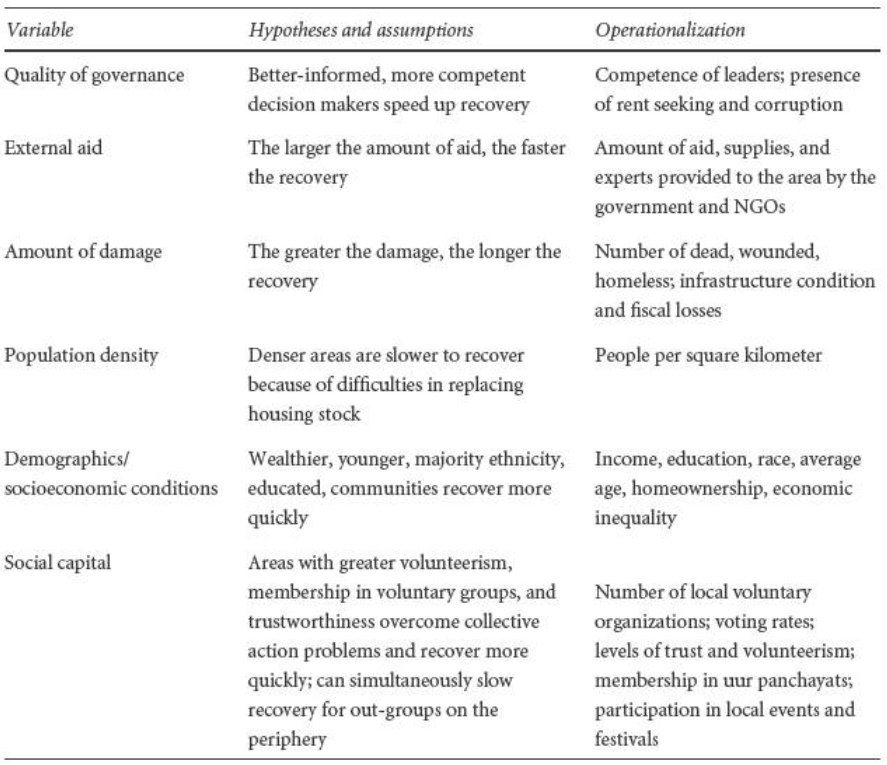
The link between social capital and disaster resilience is increasingly accepted. In “Building Resilience: Social Capital in Post-Disaster Recover,” Daniel Aldrich draws on both qualitative and quantitative evidence to demonstrate that “social resources, at least as much as material ones, prove to be the foundation for re-silience and recovery.” His case studies suggest that social capital is more important for disaster resilience than physical and financial capital, and more im-portant than conventional explanations.

Screen Shot 2012-11-30 at 6.03.23 AM

Aldrich argues that social capital catalyzes increased “participation among networked members; providing information and knowledge to individuals in the group; and creating trustworthiness.” The author goes so far as using “the phrases social capital and social networks nearly interchangeably.” He finds that “higher levels of social capital work together more effectively to guide resources to where they are needed.” Surveys confirm that “after disasters, most survivors see social connections and community as critical for their recovery.” To this end, “deeper reservoirs of social capital serve as informal insurance and mutual assistance for survivors,” helping them “overcome collective action constraints.”

Capacity for self-organization is thus intimately related to resilience since “social capital can overcome obstacles to collective action that often prevent groups from accomplishing their goals.” In other words, “higher levels of social capital reduce transaction costs, increase the probability of collective action, and make cooperation among individuals more likely.” Social capital is therefore “an asset, a functioning propensity for mutually beneficial collective action […].”

In contrast, communities exhibiting “less resilience fail to mobilize collectively and often must wait for recover guidance and assistance […].”  This implies that vulnerable populations are not solely characterized in terms of age, income, etc., but in terms of “their lack of connections and embeddedness in social networks.” Put differently, “the most effective—and perhaps least expensive—way to mitigate disasters is to create stronger bonds between individuals in vulnerable populations.”

Social Capital

The author brings conceptual clarity to the notion of social capital when he unpacks the term into Bonding Capital, Bridging Capital and Linking Capital. The figure above explains how these differ but relate to each other. The way this relates and applies to digital humanitarian response is explored in this blog post.

How Can Digital Humanitarians Best Organize for Disaster Response?

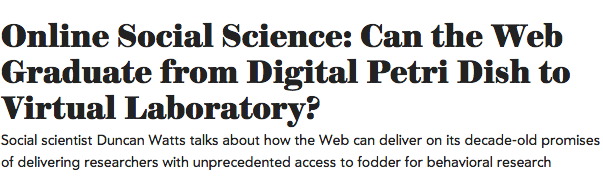
My colleague Duncan Watts recently spoke with Scientific American about a  new project I am collaborating on with him & colleagues at Microsoft Research. I first met Duncan while at the Santa Fe Institute (SFI) back in 2006. We recently crossed paths again (at 10 Downing Street, of all places), and struck up a conver-sation about crisis mapping and the Standby Volunteer Task Force (SBTF). So I shared with him some of the challenges we were facing vis-a-vis the scaling up of our information processing workflows for digital humanitarian response. Duncan expressed a strong interest in working together to address some of these issues. As he told Scientific American, “We’d like to help them by trying to understand in a more scientific manner how to scale up information processing organizations like the SBTF without over-loading any part of the system.”

Scientific American Title

Here are the most relevant sections of his extended interview:

In addition to improving research methods, how might the Web be used to deliver timely, meaningful research results?

Recently, a handful of volunteer “crisis mapping” organizations such as The Standby Task Force [SBTF] have begun to make a difference in crisis situations by performing real-time monitoring of information sources such as Facebook, Twitter and other social media, news reports and so on and then superposing these reports on a map interface, which then can be used by relief agencies and affected populations alike to improve their under-standing of the situation. Their efforts are truly inspiring, and they have learned a lot from experience. We want to build off that real-world model through Web-based crisis-response drills that test the best ways to comm-unicate and coordinate resources during and after a disaster.

How might you improve upon existing crisis-mapping efforts?

The efforts of these crisis mappers are truly inspiring, and groups like the SBTF have learned a lot about how to operate more effectively, most from hard-won experience.  At the same time, they’ve encountered some limita-tions to their model, which depends critically on a relatively small number of dedicated individuals, who can easily get overwhelmed or burned out. We’d like to help them by trying to understand in a more scientific manner how to scale up information processing organizations like the SBTF without over-loading any part of the system.

How would you do this in the kind of virtual lab environment you’ve been describing?

The basic idea is to put groups of subjects into simulated crisis-mapping drills, systematically vary different ways of organizing them, and measure how quickly and accurately they collectively process the corresponding information. So for any given drill, the organizer would create a particular disaster scenario, including downed power lines, fallen trees, fires and flooded streets and homes. The simulation would then generate a flow of information, like a live tweet stream that resembles the kind of on-the-ground reporting that occurs in real events, but in a controllable way.

As a participant in this drill, imagine you’re monitoring a Twitter feed, or some other stream of reports, and that your job is to try to accurately recreate the organizer’s disaster map based on what you’re reading. So for example, you’re looking at Twitter feeds for everything during hurricane Sandy that has “#sandy” associated with it. From that information, you want to build a map of New York and the tri-state region that shows everywhere there’s been lost power, everywhere there’s a downed tree, everywhere where there’s a fire.

You could of course try to do this on your own, but as the rate of infor-mation flow increased, any one person would get overwhelmed; so it would be necessary to have a group of people working on it together. But depen-ding on how the group is organized, you could imagine that they’d do a better or worse job, collectively. The goal of the experiment then would be to measure the performance of different types of organizations—say with different divisions of labor or different hierarchies of management—and discover which work better as a function of the complexity of the scenario you’ve presented and the rate of information being generated. This is something that we’re trying to build right now.

What’s the time frame for implementing such crowdsourced disaster mapping drills?

We’re months away from doing something like this. We still need to set up the logistics and are talking to a colleague [Patrick Meier] who works as a crisis mapper to get a better understanding of how they do things so that we can design the experiment in a way that is motivated by a real problem.

How will you know when your experiments have created something valuable for better managing disaster responses?

There’s no theory that says, here’s the best way to organize n people to process the maximum amount of information reliably. So ideally we would like to design an experiment that is close enough to realistic crisis-mapping scenarios that it could yield some actionable insights. But the experiment would also need to be sufficiently simple and abstract so that we learn something about how groups of people process information that generalizes beyond the very specific case of crisis mapping.

As a scientist, I want to identify causal mechanisms in a nice, clean way and reduce the problem to its essence. But as someone who cares about making a difference in the real world, I would also like to be able to go back to my friend who’s a crisis mapper and say we did the experiment, and here’s what the science says you should do to be more effective.

The full interview is available at Scientific AmericanStay tuned for further up-dates on this research.

Automatically Ranking the Credibility of Tweets During Major Events

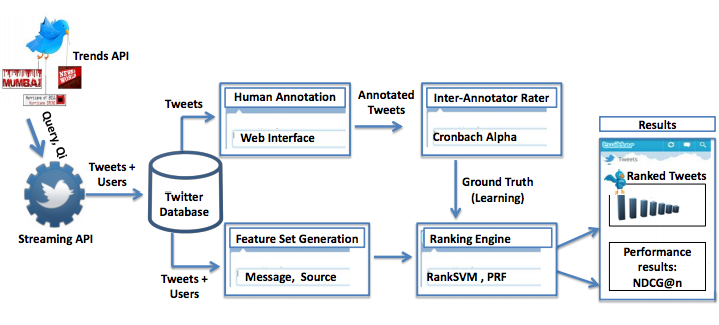
In their study, “Credibility Ranking of Tweets during High Impact Events,” authors Aditi Gupta and Ponnurangam Kumaraguru “analyzed the credibility of information in tweets corresponding to fourteen high impact news events of 2011 around the globe.” According to their analysis, “30% of total tweets  about an event contained situational information about the event while 14% was spam.” In addition, about 17% of total tweets contained situational awareness information that was credible.

Workflow

The study analyzed over 35 million tweets posted by ~8 million users based on current trending topics. From this data, the authors identified 14 major events reflected in the tweets. These included the UK riots, Libya crisis, Virginia earthquake and Hurricane Irene, for example.

“Using regression analysis, we identi ed the important content and sourced based features, which can predict the credibility of information in a tweet. Prominent content based features were number of unique characters, swear words, pronouns, and emoticons in a tweet, and user based features like the number of followers and length of username. We adopted a supervised machine learning and relevance feedback approach using the above features, to rank tweets according to their credibility score. The performance of our ranking algorithm signi cantly enhanced when we applied re-ranking strategy. Results show that extraction of credible information from Twitter can be automated with high confi dence.”

The paper is available here (PDF). For more applied research on “information forensics,” please see this link.

See also:

  • Analyzing Fake Content on Twitter During Boston Bombings [link]
  • Predicting the Credibility of Disaster Tweets Automatically [link]
  • Auto-Identifying Fake Images on Twitter During Disasters [link]
  • How to Verify Crowdsourced Information from Social Media [link]
  • Crowdsourcing Critical Thinking to Verify Social Media [link]