Tag Archives: Response

The First Ever Spam Filter for Disaster Response

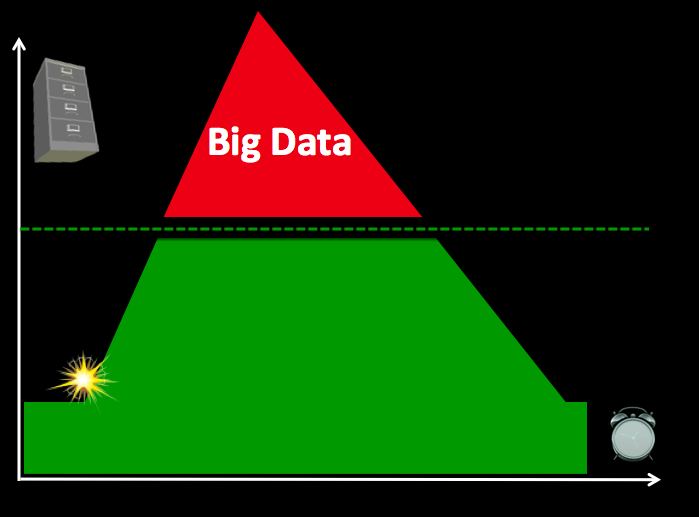
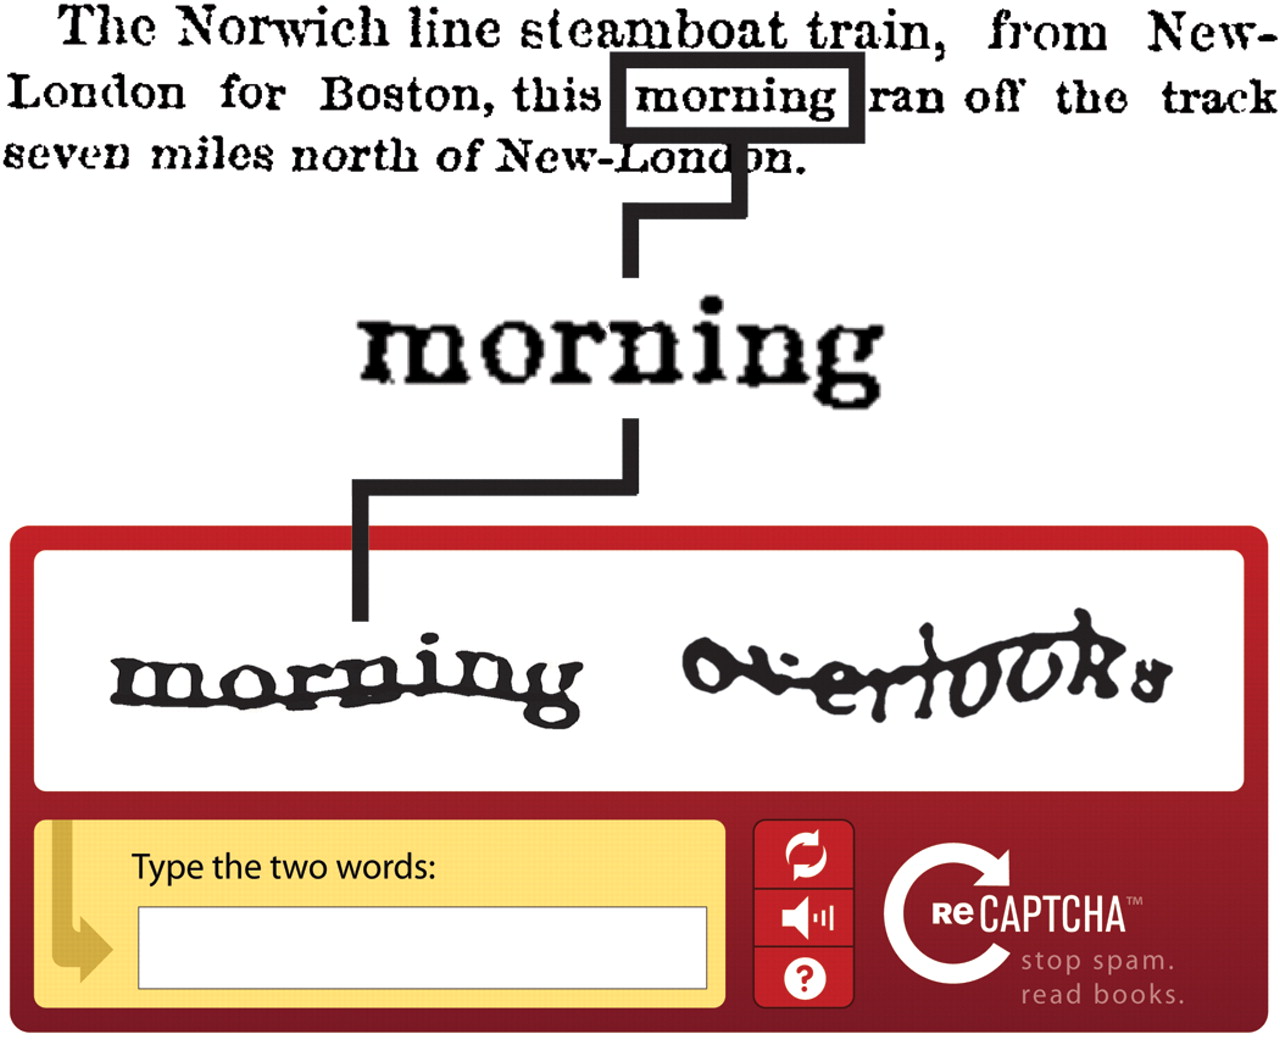
While spam filters provide additional layers of security to websites, they can also be used to process all kinds of information. Perhaps most famously, for example, the reCAPTCHA spam filter was used to transcribe the New York Times’ entire paper-based archives. See my previous blog post to learn how this was done and how spam filters can also be used to process information for disaster response. Given the positive response I received from humanitarian colleagues who read the blog post, I teamed up with my colleagues at QCRI to create the first ever spam filter for disaster response.

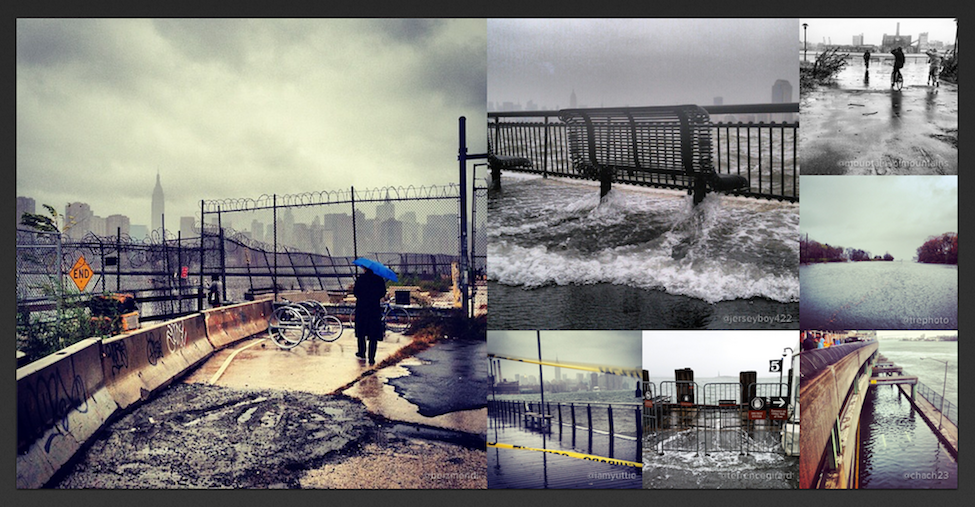
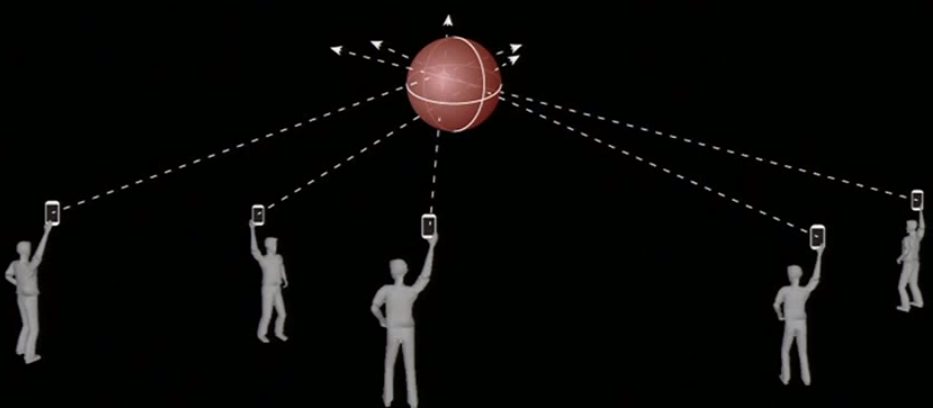
During international disasters, the humanitarian community (often lead by the UN’s Office for the Coordination of Humanitarian Affairs, OCHA) needs to carry out rapid damage assessments. Recently, these assessments have included the analysis of pictures shared on social media following a disaster. For example, OCHA activated the Digital Humanitarian Network (DHN) to collect and quickly tag pictures that capture evidence of damage in response to Typhoon Pablo in the Philippines (as described here and TEDx talk above). Some of these pictures, which were found on Twitter, were also geo-referenced by DHN volunteers. This enabled OCHA to create (over night) the unique damage assessment map below.

Typhon PABLO_Social_Media_Mapping-OCHA_A4_Portrait_6Dec2012

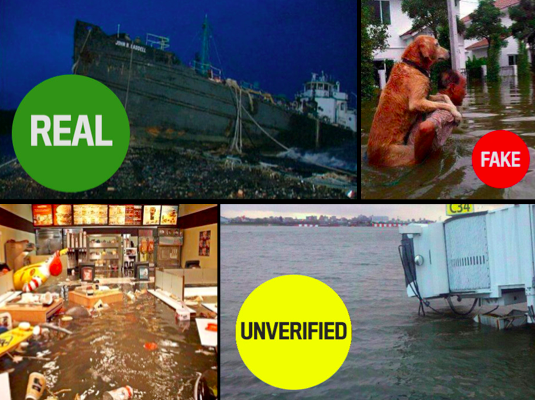
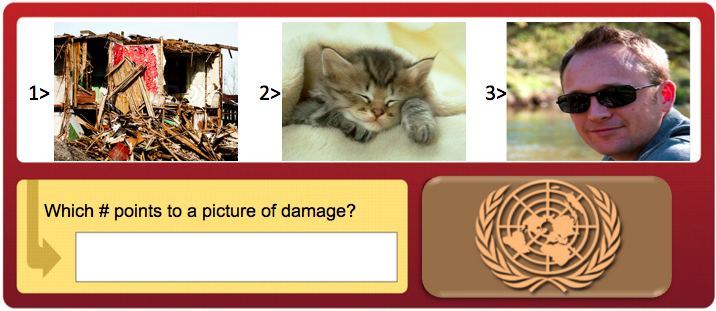
OCHA intends to activate the DHN again in future disasters to replicate this type of rapid damage assessment operation. This is where spam filters come in. The DHN often needs support to quickly tag these pictures (which may number in the tens of thousands). Adding a spam filter that requires email users to tag which image captures disaster damage not only helps OCHA and other organizations carry out a rapid damage assessment, but also increases the security of email systems at the same time. And it only takes 3 seconds to use the spam filter.

OCHA reCAPTCHA

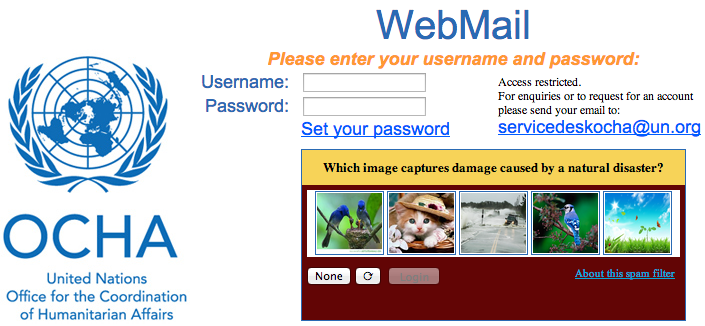
My team and I at QCRI have thus developed a spam filter plugin that can be easily added to email login pages like OCHA’s as shown above. When the Digital Humanitarian Network requires additional hands on deck to tag pictures during disasters, this plugin can simply be switched on. My team at QCRI can easily push the images to the plugin and pull data on which images have been tagged as showing disaster damage. The process for the end user couldn’t be simpler. Enter your username and password as normal and then simply select the picture below that shows disaster damage. If there are none, then simply click on “None” and then “Login”. The spam filter uses a predictive algorithm and an existing data-base of pictures as a control mechanism to ensure that the filter cannot be gamed. On that note, feel free to test the plugin here. We’d love your feedback as we continue testing.

recpatcha2

The desired outcome? Each potential disaster picture is displayed to 3 different email account users. Only if each of the 3 users tag the same picture as capturing disaster damage does that picture get automatically forwarded to members of the Digital Humanitarian Network. To tag more pictures after logging in, users are invited to do so via MicroMappers, which launches this September in partnership with OCHA. MicroMappers enables members of the public to participate in digital disaster response efforts with a simple click of the mouse.

I would ideally like to see an innovative and forward-thinking organization like OCHA pilot the plugin for a two week feasibility test. If the results are positive and promising, then I hope OCHA and other UN agencies engaged in disaster response adopt the plugin more broadly. As mentioned in my previous blog post, the UN employs well over 40,000 people around the world. Even if “only” 10% login in one day, that’s still 4,000 images effortlessly tagged for use by OCHA and others during their disaster relief operations. Again, this plugin would only be used in response to major disasters when the most help is needed. We’ll be making the code for this plugin freely available and open source.

Please do get in touch if you’d like to invite your organization to participate in this innovative humanitarian technology project. You can support disaster response efforts around the world by simply logging into your email account, web portal, or Intranet!

bio

TEDx: Microtasking for Disaster Response

My TEDx talk on Digital Humanitarians presented at TEDxTraverseCity. I’ve automatically forwarded the above video to a short 4 minute section of the talk in which I highlight how the Digital Humanitarian Network (DHN) used micro-tasking to support the UN Office for the Coordination of Humanitarian Affairs (OCHA) in response to Typhoon Pablo in the Philippines. See this blog post to learn more about the operation. As a result of this innovative use of micro-tasking, my team and I at QCRI are collaborating with UN OCHA colleagues to launch MicroMappers—a dedicated set of microtasking apps specifically designed for disaster response. These will go live in September 2013.


bio


Disaster Response Plugin for Online Games

The Internet Response League (IRL) was recently launched for online gamers to participate in supporting disaster response operations. A quick introduction to IRL is available here. Humanitarian organizations are increasingly turning to online volunteers to filter through social media reports (e.g. tweets, Instagram photos) posted during disasters. Online gamers already spend millions of hours online every day and could easily volunteer some of their time to process crisis information without ever having to leave the games they’re playing.

A message like this would greet you upon logging in. (Screenshot is from World of Warcraft and has been altered)

Lets take World of Warcraft, for example. If a gamer has opted in to receive disaster alerts, they’d see screens like the one above when logging in or like the one below whilst playing a game.

In game notification should have settings so as to not annoy players. (Screenshot is from World of Warcraft and has been altered)

If a gamer accepts the invitation to join the Internet Response League, they’d see the “Disaster Tagging” screen below. There they’d tag as many pictures as wish by clicking on the level of disaster damage they see in each photo. Naturally, gamers can exit the disaster tagging area at any time to return directly to their game.

A rough concept of what the tagging screen may look like. (Screenshot is from World of Warcraft and has been altered)

Each picture would be tagged by at least 3 gamers in order to ensure the accuracy of the tagging. That is, if 3 volunteers tag the same image as “Severe”, then we can be reasonably assured that the picture does indeed show infrastructure damage. These pictures would then be sent back to IRL and shared with humanitarian organizations for rapid damage assessment analysis. There are already precedents for this type of disaster response tagging. Last year, the UN asked volunteers to tag images shared on Twitter after a devastating Typhoon hit the Philippines. More specifically, they asked them to tag images that captured the damage caused by the Typhoon. You can learn more about this humanitarian response operation here.

IRL is now looking to develop a disaster response plugin like the one described above. This way, gaming companies will have an easily embeddable plugin that they can insert into their gaming environments. For more on this plugin and the latest updates on IRL, please visit the IRL website here. We’re actively looking for feedback and welcome collaborators and partnerships.

Bio

Acknowledgements: Screenshots created by my colleague Peter Mosur who is the co-founder of the IRL.

Automatically Identifying Fake Images Shared on Twitter During Disasters

Artificial Intelligence (AI) can be used to automatically predict the credibility of tweets generated during disasters. AI can also be used to automatically rank the credibility of tweets posted during major events. Aditi Gupta et al. applied these same information forensics techniques to automatically identify fake images posted on Twitter during Hurricane Sandy. Using a decision tree classifier, the authors were able to predict which images were fake with an accuracy of 97%. Their analysis also revealed retweets accounted for 86% of all tweets linking to fake images. In addition, their results showed that 90% of these retweets were posted by just 30 Twitter users.

Fake Images

The authors collected the URLs of fake images shared during the hurricane by drawing on the UK Guardian’s list and other sources. They compared these links with 622,860 tweets that contained links and the words “Sandy” & “hurricane” posted between October 20th and November 1st, 2012. Just over 10,300 of these tweets and retweets contained links to URLs of fake images while close to 5,800 tweets and retweets pointed to real images. Of the ~10,300 tweets linking to fake images, 84% (or 9,000) of these were retweets. Interestingly, these retweets spike about 12 hours after the original tweets are posted. This spike is driven by just 30 Twitter users. Furthermore, the vast majority of retweets weren’t made by Twitter followers but rather by those following certain hashtags. 

Gupta et al. also studied the profiles of users who tweeted or retweeted fake images  (User Features) and also the content of their tweets (Tweet Features) to determine whether these features (listed below) might be predictive of whether a tweet posts to a fake image. Their decision tree classifier achieved an accuracy of over 90%, which is remarkable. But the authors note that this high accuracy score is due to “the similar nature of many tweets since since a lot of tweets are retweets of other tweets in our dataset.” In any event, their analysis also reveals that Tweet-based Features (such as length of tweet, number of uppercase letters, etc.), were far more accurate in predicting whether or not a tweeted image was fake than User-based Features (such as number of friends, followers, etc.). One feature that was overlooked, however, is gender.

Information Forensics

In conclusion, “content and property analysis of tweets can help us in identifying real image URLs being shared on Twitter with a high accuracy.” These results reinforce the proof that machine computing and automated techniques can be used for information forensics as applied to images shared on social media. In terms of future work, the authors Aditi Gupta, Hemank Lamba, Ponnurangam Kumaraguru and Anupam Joshi plan to “conduct a larger study with more events for identification of fake images and news propagation.” They also hope to expand their study to include the detection of “rumors and other malicious content spread during real world events apart from images.” Lastly, they “would like to develop a browser plug-in that can detect fake images being shared on Twitter in real-time.” There full paper is available here.

Needless to say, all of this is music to my ears. Such a plugin could be added to our Artificial Intelligence for Disaster Response (AIDR) platform, not to mention our Verily platform, which seeks to crowdsource the verification of social media reports (including images and videos) during disasters. What I also really value about the authors’ approach is how pragmatic they are with their findings. That is, by noting their interest in developing a browser plugin, they are applying their data science expertise for social good. As per my previous blog post, this focus on social impact is particularly rare. So we need more data scientists like Aditi Gupta et al. This is why I was already in touch with Aditi last year given her research on automatically ranking the credibility of tweets. I’ve just reached out to her again to explore ways to collaborate with her and her team.

bio

What is Big (Crisis) Data?

What does Big Data mean in the context of disaster response? Big (Crisis) Data refers to the relatively large volumevelocity and variety of digital information that may improve sense making and situational awareness during disasters. This is often referred to the 3 V’s of Big Data.

Screen Shot 2013-06-26 at 7.49.49 PM

Volume refers to the amount of data (20 million tweets were posted during Hurricane Sandy) while Velocity refers to the speed at which that data is generated (over 2,000 tweets per second were generated following the Japan Earthquake & Tsunami). Variety refers to the variety of data generated, e.g., Numerical (GPS coordinates), Textual (SMS), Audio (phone calls), Photographic (satellite Imagery) and Video-graphic (YouTube). Sources of Big Crisis Data thus include both public and private sources such images posted as social media (Instagram) on the one hand, and emails or phone calls (Call Record Data) on the other. Big Crisis Data also relates to both raw data (the text of individual Facebook updates) as well as meta-data (the time and place those updates were posted, for example).

Ultimately, Big Data describe datasets that are too large to be effectively and quickly computed on your average desktop or laptop. In other words, Big Data is relative to the computing power—the filters—at your finger tips (along with the skills necessary to apply that computing power). Put differently, Big Data is “Big” because of filter failure. If we had more powerful filters, said “Big” Data would be easier to manage. As mentioned in previous blog posts, these filters can be created using Human Computing (crowdsourcing, microtasking) and/or Machine Computing (natural language processing, machine learning, etc.).

BigData1

Take the above graph, for example. The horizontal axis represents time while the vertical one represents volume of information. On a good day, i.e., when there are no major disasters, the Digital Operations Center of the American Red Cross monitors and manually reads about 5,000 tweets. This “steady state” volume and velocity of data is represented by the green area. The dotted line just above denotes an organization’s (or individual’s) capacity to manage a given volume, velocity and variety of data. When disaster strikes, that capacity is stretched and often overwhelmed. More than 3 million tweets were posted during the first 48 hours after the Category 5 Tornado devastated Moore, Oklahoma, for example. What happens next is depicted in the graph below.

BigData 2

Humanitarian and emergency management organizations often lack the internal surge capacity to manage the rapid increase in data generated during disasters. This Big Crisis Data is represented by the red area. But the dotted line can be raised. One way to do so is by building better filters (using Human and/or Machine Computing). Real world examples of Human and Machine Computing used for disaster response are highlighted here and here respectively.

BigData 3

A second way to shift the dotted line is with enlightened leadership. An example is the Filipino Government’s actions during the recent Typhoon. More on policy here. Both strategies (advanced computing & strategic policies) are necessary to raise that dotted line in a consistent manner.

Bio

See also:

  • Big Data for Disaster Response: A List of Wrong Assumptions [Link]

Using Crowdring for Disaster Response?

35 million missed calls.

That’s the number of calls that 75-year old social justice leader Anna Hazare received from people across India who supported his efforts to fight corruption. Two weeks earlier, he had invited India to join his movement by making “missed calls” to a local number. Missed calls, known as beeping or flashing, are calls that are intentionally dropped after ringing. The advantage of making missed call is that neither the caller or recipient is charged. This tactic is particularly common in emerging economies to avoid paying for air time or SMS. To build on this pioneering work, Anna and his team are developing a mobile petition tool called Crowdring, which turns a free “missed call” into a signature on a petition.

crowdring_pic

Communicating with disaster-affected communities is key for effective disaster response. Crowdring could be used to poll disaster affected communities. The service could also be used in combination with local community radio stations. The latter would broadcast a series of yes or no questions; ringing once would signify yes, twice would mean no. Some questions that come to mind:

  1. Do you have enough drinking water? 
  2. Are humanitarian organizations doing a good job?
  3. Is someone in your household displaying symptoms of cholera?

By receiving these calls, humanitarians would automatically be able to create a database of phone numbers with associated poll results. This means they could text them right back for more information or to arrange an in person meeting. You can learn more about Crowdring in this short video below.

bio

How ReCAPTCHA Can Be Used for Disaster Response

We’ve all seen prompts like this:

recaptcha_pic

More than 100 million of these ReCAPTCHAs get filled out every day on sites like Facebook, Twitter and CNN. Google uses them to simultaneously filter out spam and digitize Google Books and archives of the New York Times. For example:

recaptcha_pic2

So what’s the connection to disaster response? In early 2010, I blogged about using massive multiplayer games to tag crisis information and asked: What is the game equivalent of reCAPTCHA for tagging crisis information? (Big thanks to friend and colleague Albert Lin for reminding me of this recently). Well, the game equivalent is perhaps the Internet Response League (IRL). But what if we simply used ReCPATCHA itself for disaster response?

Humanitarian organizations like the American Red Cross regularly monitor Twitter for disaster-related information. But they are often overwhelmed with millions of tweets during major events. While my team and I at QCRI are developing automated solutions to manage this Big (Crisis) Data, we could also  use the ReCAPTCHA methodology. For example, our automated classifiers can tell us with a certain level of accuracy whether a tweet is disaster-related, whether it refers to infrastructure damage, urgent needs, etc. If the classifier is not sure—say the tweet is scored as having a 50% chance of being related to infrastructure damage—then we could automatically post it to our version of ReCAPCHA (see below). Perhaps a list of 3 tweets could be posted with the user prompted to tag which one of the 3 is damage-related. (The other two tweets could come from a separate database of random tweets).

ReCaptcha_pic3

There are reportedly 44,000 United Nations employees around the globe. World Vision also employs over 40,000, the International Committee of the Red Cross (ICRC) has more than 12,000 employees while Oxfam has about 7,000. That’s 100,000 people right there who probably log onto their work emails at least once a day. Why not insert a ReCaptcha when they log in? We could also add  ReCAPTCHAs to these organizations’ Intranets & portals like Virtual OSOCC. On a related note, Google recently added images from Google Street View to ReCAPTCHAS. So we could automatically collect images shared on social media during disasters and post them to our own disaster response ReCAPTCHAs:

Image ReCAPTCHA

In sum, as humanitarians log into their emails multiple times a day, they’d be asked to tag which tweets and/or pictures relate to on ongoing disaster. Last year, we tagged tweets and images in support of the UN’s disaster response efforts in the Philippines following Typhoon Pablo. Adding a customized ReCAPTCHA for disaster response would help us tap a much wider audience of “volunteers”, which would mean an even more rapid turn around time for damage assessments following major disasters.

Bio

Using Waze, Uber, AirBnB and SeeClickFix for Disaster Response

After the Category 5 Tornado in Oklahoma, map editors at Waze used the service to route drivers around the damage. While Uber increased their car service fares during Hurricane Sandy, they could have modified their App to encourage the shared use of Uber cars to fill unused seats. This would have taken some work, but AirBnB did modify their platform overnight to let over 1,400 kindhearted New Yorkers offer free housing to victims of the hurricane. SeeClick fix was used also to report over 800 issues in just 24 hours after Sandy made landfall. These included reports on the precise location of power outages, flooding, downed trees, downed electric lines, and other storm damage. Following the Boston Marathon Bombing, SeeClick fix was used to quickly find emergency housing for those affected by the tragedy.

Disaster-affected populations have always been the real first responders. Paid emergency response professionals cannot be everywhere at the same time, but the crowd is always there. Disasters are collective experiences; and today, disaster-affected crowds are increasingly “digital crowds” as well—that is, both a source and consumer of that digital information. In other words, they are also the first digital responders. Thanks to connection technologies like Waze, Uber, AirBnB and SeeClickFix, disaster affected communities can self-organize more quickly than ever before since these new technologies drastically reduce the cost and time necessary to self-organize. And because resilience is a function of a community’s ability to self-organize, these new technologies can also render disaster-prone populations more resilient by fostering social capital, thus enabling them to bounce back more quickly after a crisis.

When we’re affected by disasters, we tend to use the tools that we are most familiar with, i.e. those we use on a daily basis when there is no disaster. That’s why we often see so many Facebook updates, Instagram pictures, tweets, YouTube videos, etc., posted during a disaster. The same holds true for services like Waze and AirBnB, for example. So I’m thrilled to see more examples of these platforms used as humanitarian technologies and equally heartened to know that the companies behind these tools are starting to play a more active role during disasters, thus helping people help themselves. Each of these platforms have the potential to become hyper-local match.com’s for disaster response. Facilitating this kind of mutual-aid not only builds social capital, which is critical to resilience, it also shifts the burden and pressure off the shoulders of paid responders who are often overwhelmed during major disasters.

In sum, these useful everyday technologies also serve to crowdsource and democratize disaster response. Do you know of other examples? Other everyday smartphone apps and web-based apps that get used for disaster response? If so, I’d love to know. Feel free to post your examples in the comments section below. Thanks!

bio

Could CrowdOptic Be Used For Disaster Response?

Crowds—rather than sole individuals—are increasingly bearing witness to disasters large and small. Instagram users, for example, snapped 800,000 #Sandy pictures during the hurricane last year. One way to make sense of this vast volume and velocity of multimedia content—Big Data—during disasters is with PhotoSynth, as blogged here. Another perhaps more sophisticated approach would be to use CrowdOptic, which automatically zeros in on the specific location that eyewitnesses are looking at when using their smartphones to take pictures or recording videos.

Instagram-Hurricane-Sandy

How does it work? CrowdOptic simply triangulates line-of-sight intersections using sensory metadata from pictures and videos taken using a smartphone. The basic approach is depicted in the figure below. The areas of intersection is called a focal cluster. CrowdOptic automatically identifies the location of these clusters.

Cluster

“Once a crowd’s point of focus is determined, any content generated by that point of focus is automatically authenticated, and a relative significance is assigned based on CrowdOptic’s focal data attributes […].” These include: (1) Number of Viewers; (2) Location of Focus; (3) Distance to Epicenter; (4) Cluster Timestamp, Duration; and (5) Cluster Creation, Dissipation Speed.” CrowdOptic can also be used on live streams and archival images & videos. Once a cluster is identified, the best images/videos pointing to this cluster are automatically selected.

Clearly, all this could have important applications for disaster response and information forensics. My colleagues and I recently collected over 12,000 Instagram pictures and more than 5,000 YouTube videos posted to Twitter during the first 48 hours of the Tornado in Oklahoma. These could be uploaded to CrowdOptic for cluster identification. Any focal cluster with several viewers would almost certainly be authentic, particularly if the time-stamps are similar. These clusters could then be tagged by digital humanitarian volunteers based on whether they depict evidence of disaster damage. Indeed, we could have tested out CrowdOptic during in the disaster response efforts we carried out for the United Nations following the devastating Philippines Typhoon. Perhaps CrowdOptic could facilitate rapid damage assessments in the future. Of course, the value of CrowdOptic ultimately depends on the volume of geotagged images and videos shared on social media and the Web.

https://youtube.com/watch?v=2gt4lgq4ZW8%3Fversion%3D3%26hl%3Den_US

I once wrote a blog post entitled, “Wag the Dog, or How Falsifying Crowdsourced Data Can Be a Pain.” While an image or video could certainly be falsified, trying to fake several focal clusters of multimedia content with dozens of viewers each would probably require the equivalent organization capacity of a small movie-production or commercial. So I’m in touch with the CrowdOptic team to explore the possibility of carrying out a proof of concept based on the multimedia data we’ve collected following the Oklahoma Tornados. Stay tuned!

bio

Data Mining Wikipedia in Real Time for Disaster Response

My colleague Fernando Diaz has continued working on an interesting Wikipedia project since he first discussed the idea with me last year. Since Wikipedia is increasingly used to crowdsource live reports on breaking news such as sudden-onset humanitarian crisis and disasters, why not mine these pages for structured information relevant to humanitarian response professionals?

wikipedia-logo

In computing-speak, Sequential Update Summarization is a task that generates useful, new and timely sentence-length updates about a developing event such as a disaster. In contrast, Value Tracking tracks the value of important event-related attributes such as fatalities and financial impact. Fernando and his colleagues will be using both approaches to mine and analyze Wikipedia pages in real time. Other attributes worth tracking include injuries, number of displaced individuals, infrastructure damage and perhaps disease outbreaks. Pictures of the disaster uploaded to a given Wikipedia page may also be of interest to humanitarians, along with meta-data such as the number of edits made to a page per minute or hour and the number of unique editors.

Fernando and his colleagues have recently launched this tech challenge to apply these two advanced computing techniques to disaster response based on crowdsourced Wikipedia articles. The challenge is part of the Text Retrieval Conference (TREC), which is being held in Maryland this November. As part of this applied research and prototyping challenge, Fernando et al. plan to use the resulting summarization and value tracking from Wikipedia to verify related  crisis information shared on social media. Needless to say, I’m really excited about the potential. So Fernando and I are exploring ways to ensure that the results of this challenge are appropriately transferred to the humanitarian community. Stay tuned for updates. 

bio


See also: Web App Tracks Breaking News Using Wikipedia Edits [Link]