Monthly Archives: May 2013

Crowdsourcing Crisis Information from Syria: Twitter Firehose vs API

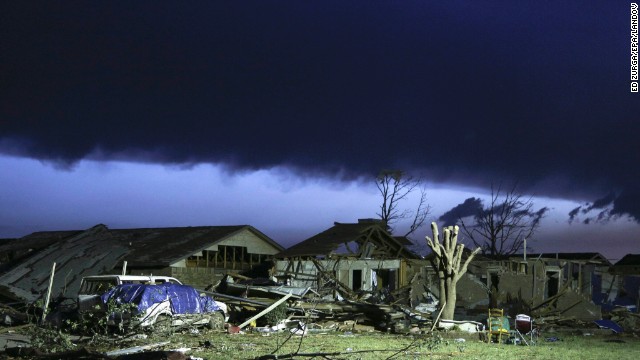
Over 400 million tweets are posted every day. But accessing 100% of these tweets (say for disaster response purposes) requires access to Twitter’s “Firehose”. The latter, however, can be prohibitively expensive and also requires serious infrastructure to manage. This explains why many (all?) of us in the Crisis Computing & Humanitarian Technology space use Twitter’s “Streaming API” instead. But how representative are tweets sampled through the API vis-a-vis overall activity on Twitter? This is important question is posed and answered in this new study using Syria as a case study.

Tweets Syria

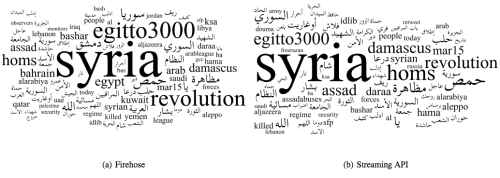
The analysis focused on “Tweets collected in the region around Syria during the period from December 14, 2011 to January 10, 2012.” The first dataset was collected using Firehose access while the second was sampled from the API. The tag clouds above (click to enlarge) displays the most frequent top terms found in each dataset. The hashtags and geoboxes used for the data collection are listed in the table below.

Syria List

The graph below shows the number of tweets collected between December 14th, 2011 and January 10th, 2012. This amounted 528,592 tweets from the API and 1,280,344 tweets from the Firehose. On average, the API captures 43.5% of tweets available on the Firehose. “One of the more interesting results in this dataset is that as the data in the Firehose spikes, the Streaming API coverage is reduced. One possible explanation for this phenomenon could be that due to the Western holidays observed at this time, activity on Twitter may have reduced causing the 1% threshold to go down.”

Syria Graph

The authors, Fred Morstatter, Jürgen Pfeffer, Huan Liu and Kathleen Carley, also carry out hashtag analysis using each dataset. “Here we see mixed results at small values of n [top hashtags], indicating that the Streaming data may not be good for finding the top hashtags. At larger values of n, we see that the Streaming API does a better job of estimating the top hashtags in the Firehose data.” In addition, the analysis reveals that the “Streaming API data does not consistently find the top hashtags, in some cases revealing reverse correlation with the Firehose data […]. This could be indicative of a filtering process in Twitter’s Streaming API which causes a misrepresentation of top hashtags in the data.”

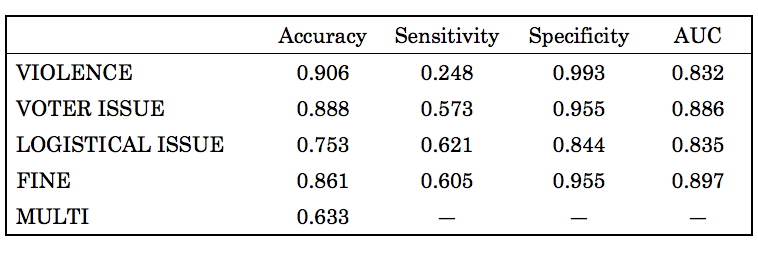
In terms of social network analysis, the the authors were able to show that “50% to 60% of the top 100 key-players [can be identified] when creating the networks based on one day of Streaming API data.” Aggregating more days’ worth of data “can increase the accuracy substantially. For network level measures, first in-depth analysis revealed interesting correlation between network centralization indexes and the proportion of data covered by the Streaming API.”

Finally, study also compares the geolocation of tweets. More specifically, the authors assess how the “geographic distribution of the geolocated tweets is affected by the sampling performed by the Streaming API. The number of geotagged tweets is low, with only 16,739 geotagged tweets in the Streaming data (3.17%) and 18,579 in the Firehose data (1.45%).” Still, the authors find that “despite the difference in tweets collected on the whole we get 90.10% coverage of geotagged tweets.”

In sum, the study finds that “the results of using the Streaming API depend strongly on the coverage and the type of analysis that the researcher wishes to perform. This leads to the next question concerning the estimation of how much data we actually get in a certain time period.” This is critical if researchers want to place their results into context and potentially apply statistical methods to account (and correct) for bias. The authors suggest that in some cases the Streaming API coverage can be estimated. In future research, they hope to “find methods to compensate for the biases in the Streaming API to provide a more accurate picture of Twitter activity to researchers.” In particularly they want to “determine whether the methodology presented here will yield similar results for Twitter data collected from other domains, such as natural, protest & elections.”

The authors will present their paper at this year’s International Conference on Weblogs and Social Media (ICWSM). So I look forward to meeting them there to discuss related research we are carrying out at QCRI.

bio

 See also:

Results: Analyzing 2 Million Disaster Tweets from Oklahoma Tornado

Thanks to the excellent work carried out by my colleagues Hemant Purohit and Professor Amit Sheth, we were able to collect 2.7 million tweets posted in the aftermath of the Category 4 Tornado that devastated Moore, Oklahoma. Hemant, who recently spent half-a-year with us at QCRI, kindly took the lead on carrying out some preliminary analysis of the disaster data. He sampled 2.1 million tweets posted during the first 48 hours for the analysis below.

oklahoma-tornado-20

About 7% of these tweets (~146,000 tweets) were related to donations of resources and services such as money, shelter, food, clothing, medical supplies and volunteer assistance. Many of the donations-related tweets were informative in nature, e.g.: “As President Obama said this morning, if you want to help the people of Moore, visit [link]”. Approximately 1.3% of the tweets (about 30,000 tweets) referred to the provision of financial assistance to the disaster-affected population. Just over 400 unique tweets sought non-monetary donations, such as “please help get the word out, we are accepting kid clothes to send to the lil angels in Oklahoma.Drop off.

Exactly 152 unique tweets related to offers of help were posted within the first 48 hours of the Tornado. The vast majority of these were asking how to get involved in helping others affected by the disaster. For example: “Anyone know how to get involved to help the tornado victims in Oklahoma??#tornado #oklahomacity” and “I want to donate to the Oklahoma cause shoes clothes even food if I can.” These two offers of help are actually automatically “matchable”, making the notion of a “Match.com” for disaster response a distinct possibility. Indeed, Hemant has been working with my team and I at QCRI to develop algorithms (classifiers) that not only identify relevant needs/offers from Twitter automatically but also suggests matches as a result.

Some readers may be suprised to learn that “only” several hundred unique tweets (out of 2+million) were related to needs/offers. The first point to keep in mind is that social media complements rather than replaces traditional information sources. All of us working in this space fully recognize that we are looking for the equivalent of needles in a haystack. But these “needles” may contain real-time, life-saving information. Second, a significant number of disaster tweets are retweets. This is not a negative, Twitter is particularly useful for rapid information dissemination during crises. Third, while there were “only” 152 unique tweets offering help, this still represents over 130 Twitter users who were actively seeking ways to help pro bono within 48 hours of the disaster. Plus, they are automatically identifiable and directly contactable. So these volunteers could also be recruited as digital humanitarian volunteers for MicroMappers, for example. Fourth, the number of Twitter users continues to skyrocket. In 2011, Twitter had 100 million monthly active users. This figure doubled in 2012. Fifth, as I’ve explained here, if disaster responders want to increase the number of relevant disaster tweets, they need to create demand for them. Enlightened leadership and policy is necessary. This brings me to point six: we were “only” able to collect ~2 million tweets but suspect that as many as 10 million were posted during the first 48 hours. So humanitarian organizations along with their partners need access to the Twitter Firehose. Hence my lobbying for Big Data Philanthropy.

Finally, needs/offers are hardly the only type of useful information available on Twitter during crises, which is why we developed several automatic classifiers to extract data on: caution and advice, infrastructure damage, casualties and injuries, missing people and eyewitness accounts. In the near future, when our AIDR platform is ready, colleagues from the American Red Cross, FEMA, UN, etc., will be able create their own classifiers on the fly to automatically collect information that is directly relevant to them and their relief operations. AIDR is spearheaded by QCRI colleague ChaTo and myself.

For now though, we simply emailed relevant geo-tagged and time-stamped data on needs/offers to colleagues at the American Red Cross who had requested this information. We also shared data related to gas leaks with colleagues at FEMA and ESRI, as per their request. The entire process was particularly insightful for Hemant and I, so we plan to follow up with these responders to learn how we can best support them again until AIDR becomes operational. In the meantime, check out the Twitris+ platform developed by Amit, Hemant and team at Kno.e.sis

bio

See also: Analysis of Multimedia Shared on Twitter After Tornado [Link

How Online Gamers Can Support Disaster Response

IRL

FACT: Over half-a-million pictures were shared on Instagram and more than 20 million tweets posted during Hurricane Sandy. The year before, over 100,000 tweets per minute were posted following the Japan Earthquake and Tsunami. Disaster-affected communities are now more likely than ever to be on social media, which dramatically multiplies the amount of user-generated crisis information posted during disasters. Welcome to Big Data—Big Crisis Data.

Humanitarian organizations and emergency management responders are completely unprepared to deal with this volume and velocity of crisis information. Why is this a problem? Because social media can save lives. Recent empirical studies have shown that an important percentage of social media reports include valuable, informative & actionable content for disaster response. Looking for those reports, however, is like searching for needles in a haystack. Finding the most urgent tweets in an information stack of over 20 million tweets (in real time) is indeed a major challenge.

FACT: More than half a billion people worldwide play computer and video games for at least an hour a day. This amounts to over 3.5 billion hours per week. In the US alone, gamers spend over 4 million hours per week online. The average young person will spend 10,000 hours of gaming by the age of 21. These numbers are rising daily. In early 2013, “World of Warcraft” reached 9.6 million subscribers worldwide, a population larger than Sweden. The online game “League of Legends” has over 12 million unique users every day while more than 20 million users log on to Xbox Live every day.

What if these gamers had been invited to search through the information haystack of 20 million tweets posted during Hurricane Sandy? Lets assume gamers were asked to tag which tweets were urgent without ever leaving their games. This simple 20-second task would directly support disaster responders like the American Red Cross. But the Digital Humanitarian Network (DHN) would have taken more than 100 hours or close to 5 days, assuming all their volunteers were working 24/7 with no breaks. In contrast, the 4 million gamers playing WoW (excluding China) would only need  90 seconds to do this. The 12 million gamers on League of Legends would have taken just 30 seconds.

While some of the numbers proposed above may seem unrealistic, there is absolutely no denying that drawing on this vast untapped resource would significantly accelerate the processing of crisis information during major disasters. In other words, gamers worldwide can play a huge role in supporting disaster response operations. And they want to: gamers playing “World of Warcraft” raised close to $2 million in donations to support relief operations following the Japan Earthquake. They also raised another $2.3 million for victims of Superstorm Sandy. Gamers can easily donate their time as well. This is why my colleague Peter Mosur and I are launching the Internet Response League (IRL). Check out our dedicated website to learn more and join the cause.

bio 


Project Loon: Google Blimps for Disaster Response (Updated)

A blimp is a floating airship that does not have any internal supporting framework or keel. The airship is typically filled with helium and is controlled remotely using steerable fans. Projet Loon is a Google initiative to launch a fleet of Blimps to extend Internet/wifi access across Africa and Asia. Some believe that “these high-flying networks would spend their days floating over areas outside of major cities where Internet access is either scarce or simply nonexistent.” Small-scale prototypes are reportedly being piloted in South Africa “where a base station is broadcasting signals to wireless access boxes in high schools over several kilometres.” The US military has been using similar technology for years.

Blimp

Google notes that the technology is “well-suited to provide low cost connectivity to rural communities with poor telecommunications infrastructure, and for expanding coverage of wireless broadband in densely populated urban areas.” Might Google Blimps also be used by Google’s Crisis Response Team in the future? Indeed, Google Blimps could be used to provide Internet access to disaster-affected communities. The blimps could also be used to capture very high-resolution aerial imagery for damage assessment purposes. Simply adding a digital camera to said blimps would do the trick. In fact, they could simply take the fourth-generation cameras used for Google Street View and mount them on the blimps to create Google Sky View. As always, however, these innovations are fraught with privacy and data protection issues. Also, the use of UAVs and balloons for disaster response has been discussed for years already.

bio

Over 2 Million Tweets from Oklahoma Tornado Automatically Processed (Updated)

Update: We have now processed a total of 2 million tweets (up from 1 million).

My colleague Hemant Purohit at QCRI has been working with us on automatically extracting needs and offers of help posted on Twitter during disasters. When the 2-mile wide, Category 4 Tornado struck Moore, Oklahoma, he immediately began to collect relevant tweets about the Tornado’s impact and applied the algorithms he developed at QCRI to extract needs and offers of help.

tornado_ok

As long-time readers of iRevolution will know, this is an approach I’ve been advocating for and blogging about for years, including the auto-matching of needs and offers. These algorithms (classifiers) will also be made available as part of our Artificial Intelligence for Disaster Response (AIDR) platform. In the meantime, we have contacted our colleagues at the American Red Cross’s Digital Operations Center (DigiOps) to offer the results of the processed data, i.e., 1,000+ tweets requesting & offering help. If you are an established organization engaged in relief efforts following the Tornado, please feel free to get in touch with us (patrick@iRevolution.net) so we can make the data available to you. 

Bio

Automatically Classifying Crowdsourced Election Reports

As part of QCRI’s Artificial Intelligence for Monitoring Elections (AIME) project, I liaised with Kaggle to work with a top notch Data Scientist to carry out a proof of concept study. As I’ve blogged in the past, crowdsourced election monitoring projects are starting to generate “Big Data” which cannot be managed or analyzed manually in real-time. Using the crowdsourced election reporting data recently collected by Uchaguzi during Kenya’s elections, we therefore set out to assess whether one could use machine learning to automatically tag user-generated reports according to topic, such as election-violence. The purpose of this post is to share the preliminary results from this innovative study, which we believe is the first of it’s kind.

uchaguzi

The aim of this initial proof-of-concept study was to create a model to classify short messages (crowdsourced election reports) into several predetermined categories. The classification models were developed by applying a machine learning technique called gradient boosting on word features extracted from the text of the election reports along with their titles. Unigrams, bigrams and the number of words in the text and title were considered in the model development. The tf-idf weighting function was used following internal validation of the model.

The results depicted above confirm that classifiers can be developed to automatically classify short election observation reports crowdsourced from the public. The classification was generated by 10-fold cross validation. Our classifier is able to correctly predict whether a report is related to violence with an accuracy of 91%, for example. We can also accurately predict  89% of reports that relate to “Voter Issues” such as registration issues and reports that indicate positive events, “Fine” (86%).

The plan for this Summer and Fall is to replicate this work for other crowdsourced election datasets from Ghana, Liberia, Nigeria and Uganda. We hope the insights gained from this additional research will reveal which classifiers and/or “super classifiers” are portable across certain countries and election types. Our hypothesis, based on related crisis computing research, is that classifiers for certain types of events will be highly portable. However, we also hypothesize that the application of most classifiers across countries will result in lower accuracy scores. To this end, our Artificial Intelligence for Monitoring Elections platform will allow election monitoring organizations (end users) to create their own classifiers on the fly and thus meet their own information needs.

bio

Big thanks to Nao for his excellent work on this predictive modeling project.

How Crowdsourced Disaster Response in China Threatens the Government

In 2010, Russian volunteers used social media and a live crisis map to crowdsource their own disaster relief efforts as massive forest fires ravaged the country. These efforts were seen by many as both more effective and visible than the government’s response. In 2011, Egyptian volunteers used social media to crowdsource their own humanitarian convoy to provide relief to Libyans affected by the fighting. In 2012, Iranians used social media to crowdsource and coordinate grassroots disaster relief operations following a series of earthquakes in the north of the country. Just weeks earlier, volunteers in Beijing crowd-sourced a crisis map of the massive flooding in the city. That map was immediately available and far more useful than the government’s crisis map. In early 2013, a magnitude 7  earthquake struck Southwest China, killing close to 200 and injuring more than 13,000. The response, which was also crowdsourced by volunteers using social media and mobile phones, actually posed a threat to the Chinese Government.

chinaquake

“Wang Xiaochang sprang into action minutes after a deadly earthquake jolted this lush region of Sichuan Province […]. Logging on to China’s most popular social media sites, he posted requests for people to join him in aiding the survivors. By that evening, he had fielded 480 calls” (1). While the government had declared the narrow mountain roads to the disaster-affected area blocked to unauthorized rescue vehicles, Wang and hitchhiked his way through with more than a dozen other volunteers. “Their ability to coordinate — and, in some instances, outsmart a government intent on keeping them away — were enhanced by Sina Weibo, the Twitter-like microblog that did not exist in 2008 but now has more than 500 million users” (2). And so, “While the military cleared roads and repaired electrical lines, the volunteers carried food, water and tents to ruined villages and comforted survivors of the temblor […]” (3). Said Wang: “The government is in charge of the big picture stuff, but we’re doing the work they can’t do” (4).

In response to this same earthquake, another volunteer, Li Chengpeng, “turned to his seven million Weibo followers and quickly organized a team of volunteers. They traveled to the disaster zone on motorcycles, by pedicab and on foot so as not to clog roads, soliciting donations via microblog along the way. What he found was a government-directed relief effort sometimes hampered by bureaucracy and geographic isolation. Two days after the quake, Mr. Li’s team delivered 498 tents, 1,250 blankets and 100 tarps — all donated — to Wuxing, where government supplies had yet to arrive. The next day, they hiked to four other villages, handing out water, cooking oil and tents. Although he acknowledges the government’s importance during such disasters, Mr. Li contends that grass-roots activism is just as vital. ‘You can’t ask an NGO to blow up half a mountain to clear roads and you can’t ask an army platoon to ask a middle-aged woman whether she needs sanitary napkins, he wrote in a recent post” (5).

chinaquake2

As I’ve blogged in the past (here and here, for example), using social media to crowdsourced grassroots disaster response efforts serves to create social capital and strengthen collective action. This explains why the Chinese government (and others) faced a “groundswell of social activism” that it feared could “turn into government opposition” following the earthquake (6). So the Communist Party tried to turn the disaster into a “rallying cry for political solidarity. ‘The more difficult the circumstance, the more we should unite under the banner of the party,’ the state-run newspaper People’s Daily declared […], praising the leadership’s response to the earthquake” (7).

This did not quell the rise in online activism, however, which has “forced the government to adapt. Recently, People’s Daily announced that three volunteers had been picked to supervise the Red Cross spending in the earthquake zone and to publish their findings on Weibo. Yet on the ground, the government is hewing to the old playbook. According to local residents, red propaganda banners began appearing on highway overpasses and on town fences even before water and food arrived. ‘Disasters have no heart, but people do,’ some read. Others proclaimed: ‘Learn from the heroes who came here to help the ones struck by disaster’ (8). Meanwhile, the Central Propaganda Department issued a directive to Chinese newspapers and websites “forbidding them to carry negative news, analysis or commentary about the earthquake” (9). Nevertheless, “Analysts say the legions of volunteers and aid workers that descended on Sichuan threatened the government’s carefully constructed narrative about the earthquake. Indeed, some Chinese suspect such fears were at least partly behind official efforts to discourage altruistic citizens from coming to the region” (10).

Aided by social media and mobile phones, grassroots disaster response efforts present a new and more poignant “Dictator’s Dilemma” for repressive regimes. The original Dictator’s Dilemma refers to an authoritarian government’s competing interest in using information communication technology by expanding access to said technology while seeking to control the democratizing influences of this technology. In contrast, the “Dictator’s Disaster Lemma” refers to a repressive regime confronted with effectively networked humanitarian response at the grassroots level, which improves collective action and activism in political contexts as well. But said regime cannot prevent people from helping each other during natural disasters as this could backfire against the regime.

bio

See also:

 •  How Civil Disobedience Improves Crowdsourced Disaster Response [Link]

Crowdsourcing Critical Thinking to Verify Social Media During Crises

My colleagues and I at QCRI and the Masdar Institute will be launching Verily in the near future. The project has already received quite a bit of media coverage—particularly after the Boston marathon bombings. So here’s an update. While major errors were made in the crowdsourced response to the bombings, social media can help to find quickly find individuals and resources during a crisis. Moreover, time-critical crowdsourcing can also be used to verify unconfirmed reports circulating on social media.

Screen Shot 2013-05-19 at 5.51.06 PM

The errors made following the bombings were the result of two main factors:

(1) the crowd is digitally illiterate
(2) the platforms used were not appropriate for the tasks at hand

The first factor has to do with education. Most of us are still in Kindergarden when it comes to the appropriate use social media. We lack the digital or media literacy required for the responsible use of social media during crises. The good news, however, is that the major backlash from the mistakes made in Boston are already serving as an important lesson to many in the crowd who are very likely to think twice about retweeting certain content or making blind allegations on social media in the future. The second factor has to do with design. Tools like Reddit and 4Chan that are useful for posting photos of cute cats are not always the tools best designed for finding critical information during crises. The crowd is willing to help, this much has been proven. The crowd simply needs better tools to focus and rationalize to goodwill of it’s members.

Verily was inspired from the DARPA Red Balloon Challenge which leveraged social media & social networks to find the location of 10 red weather balloons planted across the continental USA (3 million square miles) in under 9 hours. So Verily uses that same time-critical mobilization approach—negative incentive recursive mechanism—to rapidly collect evidence around a particular claim during a disaster, such as “The bridge in downtown LA has been destroyed by the earthquake”. Users of Verily can share this verification challenge directly from the Verily website (e.g., Share via Twitter, FB, and Email), which posts a link back to the Verily claim page.

This time-critical mobilization & crowdsourcing element is the first main component of Verily. Because disasters are far more geographically bounded than the continental US, we believe that relevant evidence can be crowdsourced in a matter of minutes rather than hours. Indeed, while the degree of separation in the analog world is 6, that number falls closer to 4 on social media, and we believe falls even more in bounded geographical areas like urban centers. This means that the 20+ people living opposite that bridge in LA are only 2 or 3 hops from your social network and could be tapped via Verily to take pictures of the bridge from their window, for example.

pinterest_blog

The second main component is to crowdsource critical thinking which is key to countering the spread of false rumors during crises. The interface to post evidence on Verily is modeled along the lines of Pinterest, but with each piece of content (text, image, video), users are required to add a sentence or two to explain why they think or know that piece of evidence is authentic or not. Others can comment on said evidence accordingly. This workflow prompts users to think critically rather than blindly share/RT content on Twitter without much thought, context or explanation. Indeed, we hope that with Verily more people will share links back to Verily pages rather than to out of context and unsubstantiated links of images/videos/claims, etc.

In other words, we want to redirect traffic to a repository of information that incentivises critical thinking. This means Verily is also looking to be an educational tool; we’ll have simple mini-guides on information forensics available to users (drawn from the BBC’s UGC, NPR’s Andy Carvin, etc). While we’ll include dig ups/downs on perceived authenticity of evidence posted to Verily, this is not the main focus of Verily. Dig ups/downs are similar to retweets and simply do not capture/explain whether said digger has voted based on her/his expertise or any critical thinking.

If you’re interested in supporting this project and/or sharing feedback, then please feel free to contact me at any time. For more background information on Verily, kindly see this post.

Bio