Category Archives: Humanitarian Technologies

Using UAVs to Map Diamond Mines and Reduce Conflict in Africa

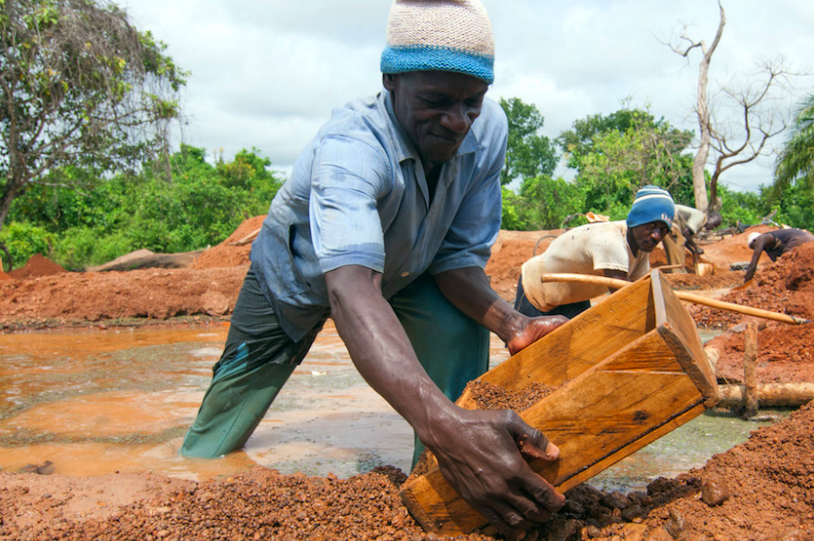
In June 2014, a joint USAID and USGS team used a small UAV to map artisanal diamond mining sites in Western Guinea. The purpose of this UAV mission was to support the “Kimberley Process (KP), an international initiative aimed at preventing the flow of conflict diamonds.” Adhering to the Process’s regulations is proving challenging for “countries whose diamonds are produced through artisanal and small-scale mining (ASM).” These mines are “often remote and spread over vast territories, and the diamonds found are frequently sold into informal networks,” which makes it “very difficult to track production—a key requirement of the KP.” National governments have recently taken important steps to formalize ASM by “registering miners, delineating mining zones, and establishing a legal flow chain through which production is intended to move. The ability to map and monitor artisanal diamond mining sites is a necessary step towards achieving formalization. Doing so helps to identify where mining is taking place, the extent of activities, the amount of production, and how the activity and production change over time.”

Screen Shot 2015-08-05 at 4.18.30 PM

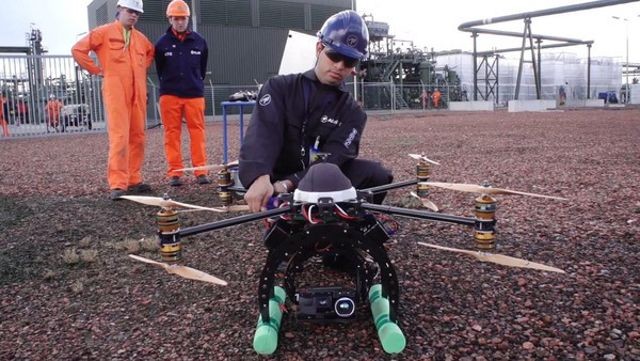
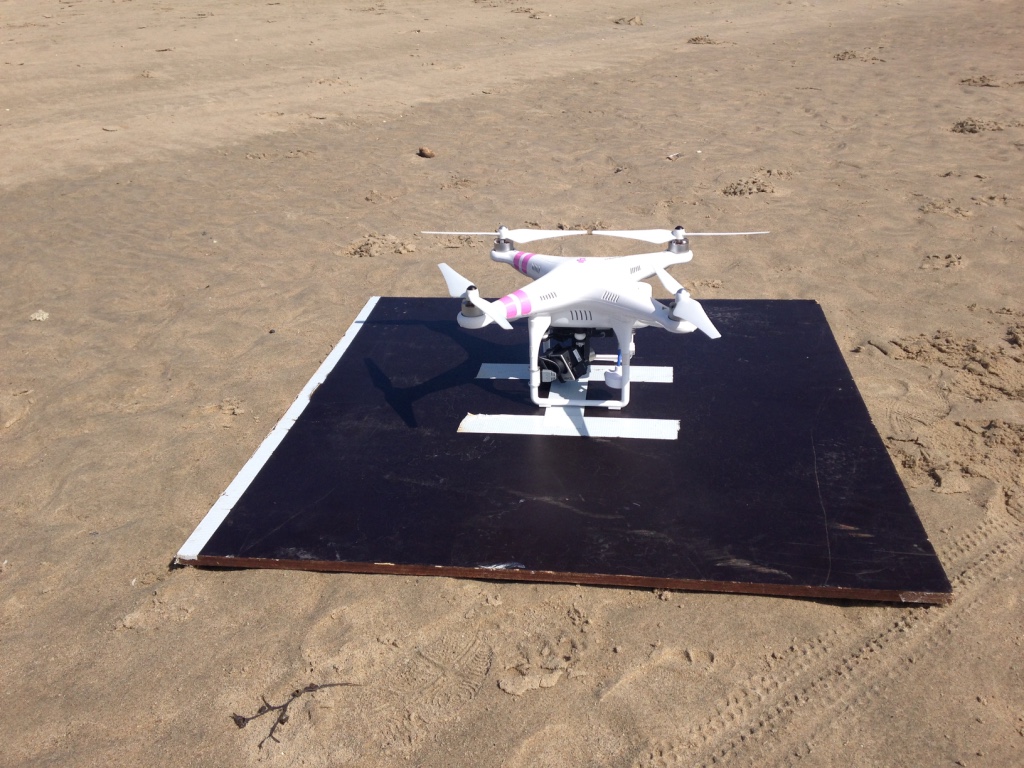
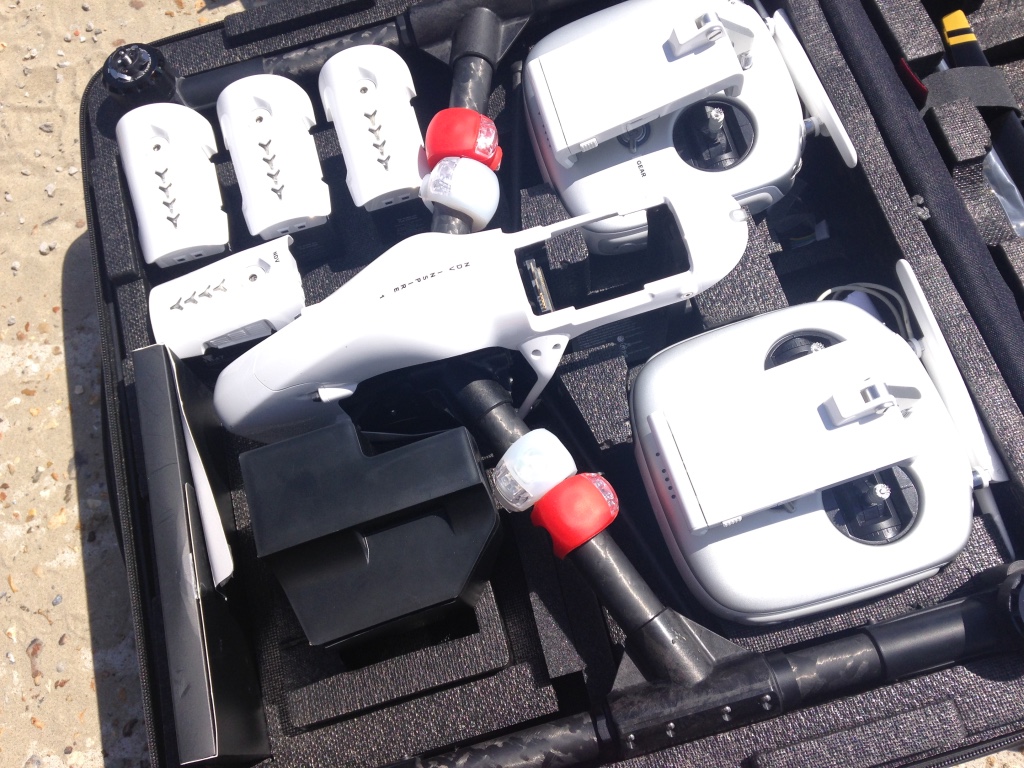
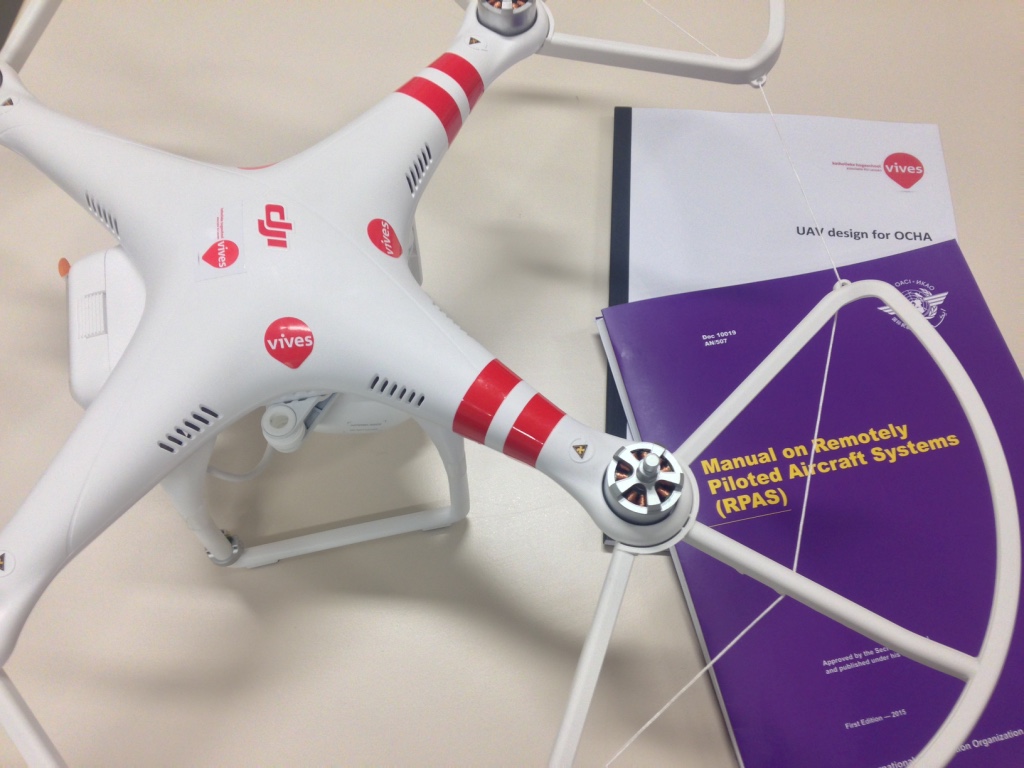
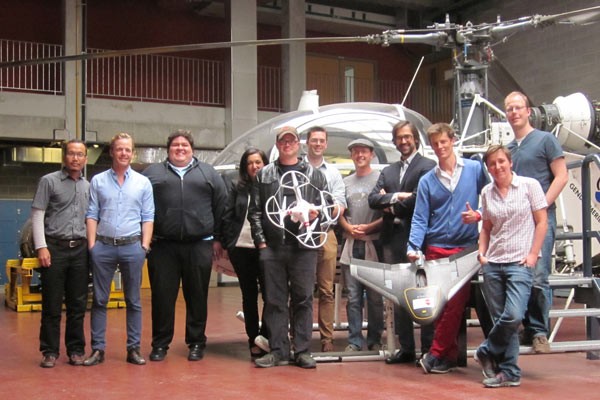
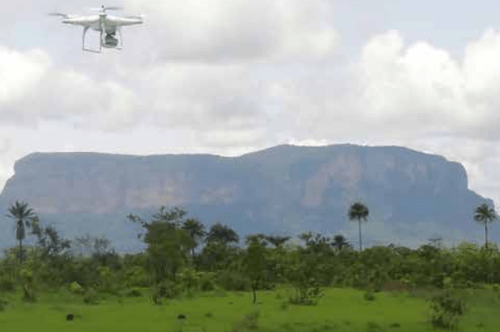
While the US Geological Survey (USGS) has been using satellite imagery to “identify ASM activities and estimate the production in diamond mining zones through-out the region,” satellite imagery presents a number of limitations. These include “atmospheric constraints (cloud cover, haze, smoke, etc.)” as well as “temporal resolutions that fail to capture the dynamic nature of ASM sites and spatial resolutions that can be inadequate for identifying fine-scale features.” Hence the use of UAVs to “support USAID’s Property Rights and Artisanal Diamond Development (PRADD) project’s efforts to formalize ASM in Guinea.” USAID and USGS deployed a joint team in June 2014 to “create detailed site maps and generate very-high resolution digital elevation models (DEMs) of the region to better inform diamond production evaluations.” The team flew a DJI Phantom 1, a multi-rotor UAV (pictured below) to “collect data at seven artisanal diamond mining sites in the Forecariah Prefecture of western Guinea.”  The DJI UAV was flown by Visual Line of Site (VLOS).

Screen Shot 2015-08-05 at 4.19.49 PM

The resulting aerial imagery allowed the team to “clearly distinguish active pits from inactive pits, locate and measure piles of extracted gravel and sedimentary layers, and detect changes in water color and sediment properties. The ability to map an entire site from one or two field locations is particularly beneficial for ASM research, as mine sites are often located in remote areas, can be several square kilometers in size, and sections of sites may be inaccessible or even dangerous for researchers to traverse due to a lack of roads, surficial disturbance due to mining, or other challenging terrain.” The team’s use of the multi-rotor UAV enabled them to “acquire complete aerial coverage of a site in under an hour.” A small fixed-wing UAV like an eBee would likely take under 15 minutes; but fixed-wings can be more challenging to operate (they do not take off and land vertically like the multi-rotors, for example) and can also cost a lot more.

Screen Shot 2015-08-05 at 3.46.57 PM

The team is using the nadir imagery collected from the UAVs to develop 10cm resolution Digital Elevation Models (DEM) of each mine site. In addition, USAID is using the “aerial videos and oblique still imagery captured using Camera 1 (wide angle lens) to conduct participatory mapping with local communities in Forecariah Prefecture to delineate mining and agricultural zones. This will assist with the formalization of property rights, thus reducing local-scale conflicts over land use.” Note that UAV regulations do not exist in Guinea, which is why it was “the team’s responsibility to identify a process for contacting the appropriate authorities in Guinea to acquire permission to fly the UAS. This involved receiving signed letters from the Minister of Mines and Geology, the Minister of Transportation, and consent from the ministers of Defense and the Interior.”

Screen Shot 2015-08-05 at 3.44.15 PM

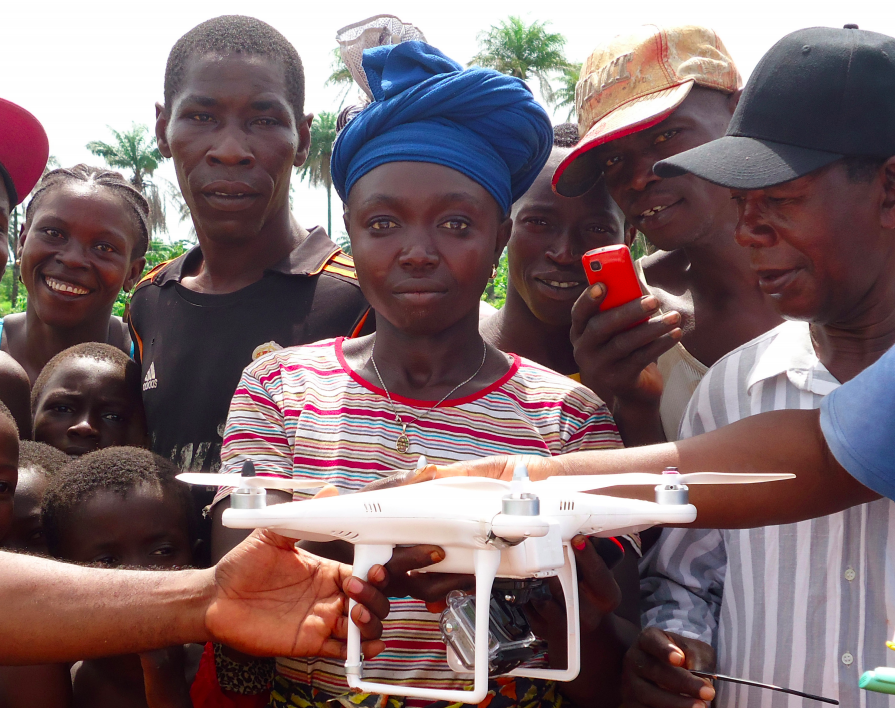
And this is especially refreshing (not least because of the Ebola outbreak at the time): “Equally as important as acquiring permission at the national government level was informing local communities near the field sites about the planned [UAV] mission.” To accomplish this, the team “traveled to villages and mining sites to conduct a public relations campaign to notify local populations that the [UAV] would be flown in the area and to explain why it was being flown and what to expect. During the flight missions the team immediately downloaded and played video collected by the [UAV] for miners & villagers as a follow-up to the information campaign and to let them see their local landscapes from a birds-eye perspective. These steps added significant time to the field mission, but were essential to gaining the trust of local populations.” These steps are also in line with the Code of Conduct produced by the Humanitarian UAV Network (UAViators) in early 2014. This Code of Conduct has since been revised by several dozen humanitarian organizations who have also drafted guidelines on community engagement and data ethics for UAV projects (more on this here).

Screen Shot 2015-08-05 at 4.21.28 PM

In conclusion, “an abundance of information is being gathered from these [images], ranging from the scope of mining activities, the location of mining within the landscape, the amount of activity at each site, the impact of mining on the surrounding environment, and the type of mining activities being conducted at the time of image collection.” The results will enable the “Guinean government to select appropriate zones to parcel for artisanal mining based on diamond potential, an important step towards formalization and resource governance. Interpretation of the data will also assist with the identification of abandoned mine sites that can be remediated into other income-generating activities, such as fish farming and vegetable gardens, thus helping to reduce the long-term environmental degradation caused by ASM.”

image003

I was recently introduced to Pete Chirico, one of the team members from USGS who deployed to Guinea. You can read more about his write-up of the Guinea mission here (PDF). Pete will soon be headed back to Africa to carry out a similar mission. I look forward to meeting up with him soon to learn more about his good work. The Guinea project represents the very first time that USAID made use of a UAV in one of its projects. Alas, many at USAID are not aware of this. I know this because I was recently invited by USAID to give a talk on UAV applications and this important precedent was not brought up. In any event, USAID’s former Administrator Rajiv Shah—pictured above with colleague Frank Pichel—was briefed on the initiative last year.

Rescue Robotics: An Introduction

I recently had the pleasure of meeting Dr. Robin Murphy when she participated in the 3-day Policy Forum on Humanitarian UAVs, which I organized and ran at the Rockefeller Center in Italy last month. Anyone serious about next generation humanitarian technology should read Robin’s book on rescue robotics. The book provides a superb introduction to the use of robotics in search and rescue missions and doubles as a valuable “how to manual” packed with deep insights, lessons learned and best practices. Rescue robots enable “responders and other stakeholders to sense and act at a distance from the site of a disaster or extreme incident.” While Robin’s focus is predominantly on the use of search-robots for rescue missions in the US, international humanitarian organizations should not overlook the important lessons learned from this experience.

WP2

As Robin rightly notes, ‘the impact of earthquakes, hurricanes, flooding […] is increasing, so the need for robots for all phases of a disaster, from prevention to response and recovery, will increase as well.” This is particularly true of aerial robots, or Unmanned Aerial Vehicles (UAVs), which represent the first wide-spread use of robotics in international humanitarian efforts. As such, this blog post relays some of the key insights from the field of rescue robots and aerial UAVs in particular. For another excellent book on the use of UAVs for search and rescue, please see Gene Robinson’s book entitled First to Deploy.

The main use-case for rescue robotics is data collection. “Rescue robots are a category of mobile robots that are generally small enough and portable enough to be transported, used and operated on demand by the group needing the information; such a robot is called a tactical, organic system […].” Tactical means that “the robot is directly controlled by stakeholders with ‘boots on the ground’—people who need to make fairly rapid decisions about the event. Organic means that the robot is deployed, maintained, transported, and tasked and directed by the stakeholder, though, of course, the information can be shared with other stakeholders […].” These mobile robots are “often referred to as unmanned systems to distinguish them from robots used for factory automation.”

WP1

There are three types or modalities of mobile robots: Unmanned Ground Vehicles (UGVs), Unmanned Marine Vehicles (UMVs) and Unmanned Aerial Vehicles (UAVs). UGVs are typically used to enter coal mines following cave-in’s or collapsed buildings to search for survivors. Indeed, “mine disasters are the most frequent users or requesters of rescue robots.” As an aside, I found it quite striking that “urban structures are likely to be manually inspected at least four times by different stakeholders” following a disaster. In any event, “few formal response organizations “own rescue robots, which explains the average lag time of 6.5 days for a robot to be used [in] disaster [response].” That said, Robin notes that this lag time is reduced to 0.5 day when a “command institution had a robot or an existing partnership with a group that had robots […].” While “robots are still far from perfect, they are useful.” Robin is careful to note that the failures and gaps described in her book “should not be used as reasons to reject use of a robot but rather as decision aids in selecting a currently available robot and for proactively preparing a field team for what to expect.”

The Florida State Emergency Response Team deployed the first documented use of small UAVs for disaster response following Hurricane Katrina in 2005. Robin Murphy’s Center for Robot-Assisted Search & Rescue (CRASAR) also flew two types of small UAVs to assist with the rescue phase: an AeroVironment Raven (fixed-wing UAV) and an iSENSYS T-Rex variant miniature helicopter (pictured below). Two flights were carried out to “determine whether people were stranded in the area around Pearlington, Mississippi, and if the cresting Pearl River was posing immediate threats.” These affected areas were “unreachable by truck due to trees in the road.” The Raven UAV unfortunately crashed “into a set of power lines […] while landing in a demolished neighborhood.” CRASAR subsequently carried out an additional 32 flights with an iSENSYS IP-3 miniature helicopter to examine “structural damage at seven multistory buildings.”

Screen Shot 2015-08-04 at 4.43.46 PM

The second documented deployment of UAVs in Robin’s book occurs in 2009, when a quadrotor used by the Sapienza University of Rome in the aftermath of the L’Aquila earthquake in 2009. Members of the University’s Cognitive Cooperative Robotics Lab deployed the UAV on behalf of the L’Aquila Fire Department. “The deployment in the debris concentrated on demonstrating mobility to fire rescue agencies.” The third documented use of UAVs occurred in Haiti after the 2010 Earthquake. An Elbit Skylark (fixed-wing) UAV was used to survey the state of a distant orphanage near Leogane, just outside the capital.

Several UAV deployments occurred in 2011. After the Christchurch Earthquake in New Zealand, a consumer Parrot AR drone was initially used to fly into a cathedral to inspect the damage (aerial photo bellow). That same year, a Pelican UAV was used in response to the Japan Earthquake and Tsunami to “test multi-robot collaborative mapping in a damaged building at Tohoku University.” In this case, multirobot means that “the UAV was carried by a UGV” to get the former inside the rubble so it could fly inside the damaged building. At least two additional UAVs were used for the emergency at the Fukushima Daiichi nuclear power plant. Note that a “recording radiological sensor was zip tied to [one of the UAVs] in order to get low-altitude surveys.” Still in 2011, two UAVs were used in Cyprus after an explosion damaged a power plant. The UAVs were deployed to “inspect the damage and create a three-dimensional image of the power plant.” This mission “suggested that multiple UAVs could simultaneously map a face of the structure, [thus] accelerating the reconnaissance process. Finally, at least two multiple fixed-wing UAVs were used in Bangkok following the Great Thailand Flood in 2011. These aerial robots were used to “monitor large areas and allow disaster scientists to predict and prevent flooding.”

Wp3

In 2012, a project funded by the European Union (EU) fielded to UAVs following earthquakes in Northern Italy to assess the exteriors of “two churches that had not been entered [for] safety reasons. The robots were successful and provided engineers and cultural historians with information that could not have been obtained otherwise.” UAV deployments following disasters in Haiti in 2012 and the Philippines in 2013 do not appear in the book, unfortunately. In any event, Robin notes that the main barrier to deploying UGVs, UMVs and UAVs “is not a technical issue but an administrative one.” I would add regulatory constraints as another major hurdle.

Robin’s book provides some excellent operational guidance on how to carry out rescue-robot missions successfully. These guidance notes also identify existing gaps in recent missions. One such gap is the “lack of ability to integrate UAV data with satellite imagery and other geographical sources,” an area that I’m actively working on (see MicroMappers). Robin makes an important observation on the gaps—or more precisely the data gaps that exist in the field of rescue robotics. “Surprisingly few deployments have been reported in the scientific or professional literature, and even fewer have been analyzed in any depth.” And even when “data are collected, many reports lack a unifying framework or conceptual model for analysis.”

This should not be surprising. Rescue robotics, and humanitarian UAVs in particular, “are new areas of discovery.” As such, “their newness means there is a lag in understanding how best to capture performance and even the dimensions that make up performance.” To be sure, “performance goes beyond simple binary declarations of mission success: it requires knowing what worked and why.” Furthermore, the use of UAVs in aid and development requires a “holistic evaluation of the technology in the larger socio-technical system.” I whole heartedly agree with Robin, which is precisely why I’ve been developing standardized indicators to assess the performance of humanitarian UAVs used for data collection, payload transportation and communication services in international humanitarian aid. Such standards are needed earlier rather than later since “the current state of reporting deployments is ad hoc,” which means “there is no guarantee that all deployments have been recorded, much less documented in a manner to support scientific understanding or improved devices and concepts of operations.” I’ll be writing more on the standardized indicators I’ve been developing in a future blog post.

As Robin also notes, “it is not easy to determine if a robot accomplished the mission optimally, was resilient to conditions it did not encounter, or missed an important cue of a victim or structural hazard.” What’s more, “good performance of a robot in one hurricane does not necessarily mean good performance in another hurricane because so many factors can be different.” Fact is, Rescue robotics have a “very small corpus of natural world observations […],” meaning that there is limited documentation based on direct observation of UAV missions in the field. This is also true of humanitarian UAVs. Unlike the science of rescue-robotics, many of the other sciences have a “large corpus of prior observations, and thus ideation may not require new fundamental observations of the natural world.” What does this mean for rescue robotics (and humanitarian UAVs)? According to Robin, the very small corpus of real world observations suggests that lab experimentation and simulations will have “limited utility as there is little information to create meaning models or to know what aspect of the natural world to duplicate.”

I’m still a strong proponent of simulations and disaster response exercises; they are key to catalyzing learning around emerging (humanitarian) technologies in non-high-stakes environments. But I certainly take Robin’s point. What’s very clear is that a lot more fieldwork is needed in rescue-robotics (and especially in the humanitarian UAV space). This fieldwork can be carried out in several ways:

  • Controlled Experimentation
  • Participation in an Exercise
  • Concept Experimentation
  • Participant-Observer Research

Controlled experimentation is “highly focused, either on testing a hypothesis or capturing a performance metric(s) […]. Participation in an exercise occurs in simulated-but-realistic environments. This type of fieldwork focuses on “reinforcing good practices […].” Concept experimentation can occur both in simulated environment and in the real world. “The experimentation is focused on generating concepts of how a new technology or protocol can be used […].” This type of experimentation also “identifies new uses or missions for the robot.” Lastly, “participant-observer” research is conducted while the robot is actually deployed to a disaster, and is a form of ethnography.” 

There are many more important, operational insights in Robin’s book. I highly recommend reading sections 3-6 in Chapter 6 since they provide very practical advice on how to carry out rescue-robotics missions. These section are packed with hands-on lessons learned and best practices, which very much mirror my own experience in the humanitarian UAV space, as documented in this best practices guide. For example, she emphasizes the critical importance of having a “Data Manager” as part of your deployment team. “The first priority of the data manager is to gather all the incoming data, and perform backups.” In addition, Robin Murphy strongly recommends that expert participant-observer researcher be embedded in the mission team—another suggestion I completely agree with. In terms of good etiquette, “Do not attempt first contact during a disaster,” is another suggestion that I wholeheartedly agree with. This is precisely why the UN asked UAV operators in Nepal to first check-in with the Humanitarian UAV Network (UAViators).

In closing, big thanks to Robin for writing this book and for participating in the recent Policy Forum on Humanitarian UAVs.

A Practical Introduction to UAVs for NGOs

The New America Foundation and Omidyar Network recently published an important primer on how NGOs across multiple sectors can begin to leverage UAVs (or drones). Entitled, “Drones and Aerial Observation: New Technologies for Property Rights, Human Rights & Global Development,” this new publication (PDF) is highly recommended to NGOs seeking to better understand the in’s and out’s of this new technology. UAVs represent the first wave of robotics to be used in the NGOs space. It is incumbent on us to both anticipate and channel the transformative impact that these aerial robots will inevitably have in order to lead by example and thereby inform the safe, responsible and effective use of this new technology. As per AmeriCare’s recent tweet about UAVs: “Technology can disrupt, destroy or transform. Our choice.”

Screen Shot 2015-07-30 at 2.06.27 PM

The UAV industry is expected to grow to $11.5 billion annually within 10 years. In the meantime, “governments worldwide are wrestling in real time with exactly how to react to this democratization of technology and information, particularly in the areas of surveillance and privacy. This is where smart, informed public policy is especially critical. It is imperative that we balance the rights of citizens with legitimate privacy and security concerns. The only way this will happen is if we set up an open, fair and transparent exchange of ideas—something we hope that this Primer will enable.”

Screen Shot 2015-07-30 at 2.32.22 PM

Perhaps what I value the most about this primer is the simple language it uses to explain what UAVs are, what they can do, and how. See in particular Chapter 1 on what UAVs can do, and Chapter 4 on how to make maps with UAVs. If you only have time to read one chapter, then definitely read Chapter 4. Chapter 2 focuses on community participation, consent and data sharing; worth reading Kate Chapman’s comments on that chapter. Chapter 3 addresses the thorny issue of regulations. The primer also features important case-studies on how UAVs are used across different sectors. For example, Chapter 5, “Mapping in Practice,” highlights multiple real-world uses of mapping UAVs, ranging from community and cadastral mapping to archaeological and conservation mapping. 

Screen Shot 2015-07-30 at 3.46.50 PM

Chapter 6 is the one I wrote, documenting recent uses of UAVs in humanitarian disasters along with key use-cases and lessons learned. In closing, I briefly introduce the Humanitarian UAV Network (UAViators), which is the only global initiative that actively promotes the safe, coordinated and effective use of UAVs in humanitarian settings. The Network champions a dedicated Code of Conduct to raise awareness about best practices and humanitarian principles. This is especially important given that an increasing number of  the  “disaster tourists” and “citizen journalists” are already experimenting with UAVs in disaster zones. UAViators is thus taking pro-active steps to educate amateur pilots rather than waiting for mistakes to be made.

Chapters 7 and 8 focus on the use of UAVs for conservation & human rights respectively. While the chapter on human rights is more hypothetical and speculative than others, it contains insightful interviews with several experts from the United Nations, Human Rights Watch and Amnesty International. One such interviewee, Daniel Gilman, is rather skeptical about the use of UAVs to deter armed groups from committing human rights abuses: “I’m not convinced so much about the deterrent effect of drones. Just because I think people are assholes.” The final chapters, 8 and 9, address uses of UAVs in archaeology and in peacekeeping operations. Like the use of UAVs for human rights, the use of UAVs in peacekeeping is an area I have also explored.

Screen Shot 2015-07-30 at 2.17.07 PM

Taken together, the real-world focus and accessible language of the 9 chapters really sets this short book apart and certainly fills a void. So if you’re new to UAVs, this primer will definitely help answer your most frequent questions and will go a long way to demystifying this new technology for you. If you’re keen to learn more about humanitarian applications, then I recommend this write-up on “Humanitarian UAV Missions: Towards Best Practices” along with this overview on streamlined workflows. You may also want to visit the resources available at the Humanitarian UAV Network (UAViators).

3D Digital Humanitarians: The Irony

In 2009 I wrote this blog post entitled “The Biggest Problem with Crisis Maps.” The gist of the post: crises are dynamic over time and space but our crisis maps are 2D and static. More than half-a-decade later, Digital Humanitarians have still not escaped from Plato’s Cave. Instead, they continue tracing 2D shadows cast by crisis data projected on their 2D crisis maps. Is there value in breaking free from our 2D data chains? Yes. And the time will soon come when Digital Humanitarians will have to make a 3D run for it.

Screen Shot 2015-07-21 at 3.31.27 PM

Aerial imagery captured by UAVs (Unmanned Aerial Vehicles) can be used to create very high-resolution 3D point clouds like the one below. It only took a 4-minute UAV flight to capture the imagery for this point cloud. Of course, the processing time to convert the 2D imagery to 3D took longer. But solutions already exist to create 3D point clouds on the fly, and these solutions will only get more sophisticated over time.

Stitching 2D aerial imagery into larger “mosaics” is already standard practice in the UAV space. But that’s so 2014. What we need is the ability to stitch together 3D point clouds. In other words, I should be able to mesh my 3D point cloud of a given area with other point clouds that overlap spatially with mine. This would enable us to generate high-resolution 3D point clouds for larger areas. Lets call these accumulated point clouds Cumulus Clouds. We could then create baseline data in the form of Cumulus Clouds. And when a disaster happens, we could create updated Cumulus Clouds for the affected area and compare them with our baseline Cumulus Cloud for changes. In other words, instead of solely generating 2D mapping data for the Missing Maps Project, we could add Cumulus Clouds.

Meanwhile, breakthroughs in Virtual Reality will enable Digital Humanitarians to swarm through these Cumulus Clouds. Innovations such as Oculus Rift, the first consumer-targeted virtual reality headsets, may become the pièce de résistance of future Digital Humanitarians. This shift to 3D doesn’t mean that our methods for analyzing 2D crisis maps are obsolete when we leave Plato’s Cave. We simply need to extend our microtasking and crowdsourcing solutions to the 3D space. As such, a 3D “tasking manager” would just assign specific areas of a Cumulus Cloud to individual Digital Jedis. This is no different to how field-based disaster assessment surveys get carried out in the “Solid World” (Real Word). Our Oculus headsets would “simply” need to allow Digital Jedis to “annotate” or “trace various” sections of the Cumulus Clouds just like they already do with 2D maps; otherwise we’ll be nothing more than disaster tourists.

wp oculus

The shift to 3D is not without challenges. This shift necessarily increases visual complexity. Indeed, 2D images are a radical (and often welcome) simplification of the Solid World. This simplification comes with a number of advantages like reducing the signal to noise ratio. But 2D imagery, like satellite imagery, “hides” information, which is one reason why imagery-interpretation and analysis is difficult, often requiring expert training. But 3D is more intuitive; 3D is the world we live in. Interpreting signs of damage in 3D may thus be easier than doing so with a lot less information in 2D. Of course, this also depends on the level of detail required for the 3D damage assessments. Regardless, appropriate tutorials will need to be developed to guide the analysis of 3D point clouds and Cumulus Clouds. Wait a minute—shouldn’t existing assessment methodologies used for field-based surveys in the Solid World do the trick? After all, the “Real World” is in 3D last time I checked.

Ah, there’s the rub. Some of the existing methodologies developed by the UN and World Bank to assess disaster damage are largely dysfunctional. Take for example the formal definition of “partial damage” used by the Bank to carry out their post-disaster damage and needs assessments: “the classification used is to say that if a building is 40% damaged, it needs to be repaired. In my view this is too vague a description and not much help. When we say 40%, is it the volume of the building we are talking about or the structural components?” The question is posed by a World Bank colleague with 15+ years of experience. Since high-resolution 3D data enables more of us to more easily see more details, our assessment methodologies will necessarily need to become more detailed both for manual and automated analysis solutions. This does add more complexity but such is the price if we actually want reliable damage assessments regardless.

Isn’t it ironic that our shift to Virtual Reality may ultimately improve the methodologies (and thus data quality) of field-based surveys carried out in the Solid World? In any event, I can already “hear” the usual critics complaining; the usual theatrics of cave-bound humanitarians who eagerly dismiss any technology that appears after the radio (and maybe SMS). Such is life. Moving along. I’m exploring practical ways to annotate 3D point clouds here but if anyone has additional ideas, do please get in touch. I’m also looking for any solutions out there (imperfect ones are fine too) that can can help us build Cumulus Clouds—i.e., stitch overlapping 3D point clouds. Lastly, I’d love to know what it would take to annotate Cumulus Clouds via Virtual Reality. Thanks!

Acknowledgements: Thanks to colleagues from OpenAerialMap, Cadasta and MapBox for helping me think through some of the ideas above.

Developing Guidelines for Humanitarian UAV Missions

New: The revised Code of Conduct and Guidelines are now publicly available as part of an open consultative process that will conclude on October 10th. We thus invite comments on the draft guidelines here (Google Doc). Please note that only feedback provided via this Google Form will be reviewed. We’ll be running an open Webinar on September 16th to discuss the guidelines in more detail.


The Humanitarian UAV Network (UAViators) recently organized a 3-day Policy Forum on Humanitarian UAVs. The mission of UAViators is to promote the safe, coordinated and effective use of UAVs in a wide range of humanitarian settings. The Forum, the first of it’s kind, was generously sponsored and hosted by the Rockefeller Foundation at their conference center in Bellagio, Italy. The aerial panoramic photograph below was captured by UAV during the Forum.

EricChengBellagio

UAViators brought together a cross-section of experts from the UN Office for the Coordination of Humanitarian Affairs (OCHA), UN Refugee Agency (UNHCR), UN Department for Peacekeeping Operations (DPKO), World Food Program (WFP), International Committee of the Red Cross (ICRC), American Red Cross, European Commission’s Humanitarian Aid Organization (ECHO), Medair, Humanitarian OpenStreetMap, ICT for Peace Foundation (ICT4Peace), DJI, BuildPeace, Peace Research Institute, Oslo (PRIO), Trilateral Research, Harvard University, Texas A&M, University of Central Lancashire, École Polytechnique Fédérale de Lausanne (EPFL), Pepperdine University School of Law and other independent experts. The purpose of the Forum, which I had the distinct pleasure of running: to draft guidelines for the safe, coordinated and effective use of UAVs in humanitarian settings.

Five key sets of guidelines were drafted, each focusing on priority areas where policy has been notably absent: 1) Code of Conduct; 2) Data Ethics; 3) Community Engagement; 4) Principled Partnerships; and 5) Conflict Sensitivity. These five policy areas were identified as priorities during the full-day Humanitarian UAV Experts Meeting co-organized at the UN Secretariat in New York by UAViators and OCHA (see summary here). After 3 very long days of deliberation in Bellagio, we converged towards an initial draft set of guidelines for each of the key areas. There was certainly no guarantee that this convergence would happen, so I’m particularly pleased and very grateful to all participants for their hard work. Indeed, I’m reminded of Alexander Aleinikoff (Deputy High Commissioner in the Office of UNHCR) who defines innovation as “dynamic problem solving among friends.” The camaraderie throughout the long hours had a lot to do with the positive outcome. Conferences typically take a group photo of participants; we chose to take an aerial video instead:

Of course, this doesn’t mean we’re done. The most immediate next step is to harmonize each of the guideline documents so that they “speak” to each other. We’ll then solicit internal institutional feedback from the organizations that were represented in Bellagio. Once this feedback has been considered and integrated where appropriate, we will organize a soft public launch of the guidelines in August 2015. The purpose of this soft launch is to actively solicit feedback from the broader humanitarian community. We plan to hold Webinars in August and September to invite this additional feedback. The draft guidelines will be further reviewed in October at the 2015 Humanitarian UAV Experts Meeting, which is being hosted at MIT and co-organized by UAViators, OCHA and the World Humanitarian Summit (WHS).

We’ll then review all the feedback received since Bellagio to produce the “final” version of the guidelines, which will be presented to donors and humanitarian organizations for public endorsement. The guidelines will be officially launched at the World Humanitarian Summit in 2016. In the meantime, these documents will serve as best practices to inform both humanitarian UAV trainings and missions. In other words, they will already serve to guide the safe, coordinated and effective use of UAVs in humanitarian settings. We will also use these draft guidelines to hold ourselves accountable. To be sure, humanitarian innovation is not simply about the technology; humanitarian innovation is also about the processes that enable the innovative use of emerging technologies.

While the first text message (SMS) was sent in 1992, it took 20 years (!) until a set of guidelines were developed to inform the use of SMS in disaster response. I’m relieved that we won’t have to wait until 2035 to produce UAV guidelines. Yes, the evidence base for the added value of UAVs in humanitarian missions is still thin, which is why it is all the more remarkable that forward-thinking guidelines are already being drafted. As several participants noted during the Forum, “The humanitarian community completely missed the boat on the mobile phone revolution. It is vital that we not make this same mistake again with newer, emerging technologies.” As such, the question for everyone at the Forum was not whether UAVs will have a significant impact, but rather what guidelines are needed now to guide the impact that this new technology will inevitably have on future humanitarian efforts.

The evidence base is necessarily thin since UAVs are only now emerging as a potential humanitarian technology. There is still a lot of learning and documenting to be done. The Humanitarian UAV Network has already taken on this task and will continue to enable learning and catalyze information sharing by convening expert meetings and documenting lessons learned in collaboration with key partners. The Network will also seek to partner with select groups on strategic projects with the aim of expanding the evidence base. In sum, I think we’re on the right track, and staying on the right track will require a joint and sustained effort with a cross-section of partners and stakeholders. To be sure, UAViators cannot accomplish the above alone. It took 22 dedicated experts and 3 long days to produce the draft guidelines. So consider this post an open invitation to join these efforts as we press on to make the use of UAVs in humanitarian crises safer, more coordinated and more effective.

In the meantime, a big thanks once again to all the experts who joined us for the Forum, and equally big thanks to the team at the Rockefeller Foundation for graciously hosting us in Bellagio.

Social Media for Disaster Response – Done Right!

To say that Indonesia’s capital is prone to flooding would be an understatement. Well over 40% of Jakarta is at or below sea level. Add to this a rapidly growing population of over 10 million and you have a recipe for recurring disasters. Increasing the resilience of the city’s residents to flooding is thus imperative. Resilience is the capacity of affected individuals to self-organize effectively, which requires timely decision-making based on accurate, actionable and real-time information. But Jakarta is also flooded with information during disasters. Indeed, the Indonesian capital is the world’s most active Twitter city.

JK1

So even if relevant, actionable information on rising flood levels could somehow be gleaned from millions of tweets in real-time, these reports could be inaccurate or completely false. Besides, only 3% of tweets on average are geo-located, which means any reliable evidence of flooding reported via Twitter is typically not actionable—that is, unless local residents and responders know where waters are rising, they can’t take tactical action in a timely manner. These major challenges explain why most discount the value of social media for disaster response.

But Digital Humanitarians in Jakarta aren’t your average Digital Humanitarians. These Digital Jedis recently launched one of the most promising humanitarian technology initiatives I’ve seen in years. Code named Peta Jakarta, the project takes social media and digital humanitarian action to the next level. Whenever someone posts a tweet with the word banjir (flood), they receive an automated tweet reply from @PetaJkt inviting them to confirm whether they see signs of flooding in their area: “Flooding? Enable geo-location, tweet @petajkt #banjir and check petajakarta.org.” The user can confirm their report by turning geo-location on and simply replying with the keyword banjir or flood. The result gets added to a live, public crisis map, like the one below.

Credit: Peta Jakarta

Over the course of the 2014/2015 monsoon season, Peta Jakarta automatically sent 89,000 tweets to citizens in Jakarta as a call to action to confirm flood conditions. These automated invitation tweets served to inform the user about the project and linked to the video below (via Twitter Cards) to provide simple instructions on how to submit a confirmed report with approximate flood levels. If a Twitter user forgets to turn on the geo-location feature of their smartphone, they receive an automated tweet reminding them to enable geo-location and resubmit their tweet. Finally, the platform “generates a thank you message confirming the receipt of the user’s report and directing them to PetaJakarta.org to see their contribution to the map.” Note that the “overall aim of sending programmatic messages is not to simply solicit a high volume of replies, but to reach active, committed citizen-users willing to participate in civic co-management by sharing nontrivial data that can benefit other users and government agencies in decision-making during disaster scenarios.”

A report is considered verified when a confirmed geo-tagged tweet includes a picture of the flooding, like in the tweet below. These confirmed and verified tweets get automatically mapped and also shared with Jakarta’s Emergency Management Agency (BPBD DKI Jakarta). The latter are directly involved in this initiative since they’re “regularly faced with the difficult challenge of anticipating & responding to floods hazards and related extreme weather events in Jakarta.” This direct partnership also serves to limit the “Data Rot Syndrome” where data is gathered but not utilized. Note that Peta Jakarta is able to carry out additional verification measures by manually assessing the validity of tweets and pictures by cross-checking other Twitter reports from the same district and also by monitoring “television and internet news sites, to follow coverage of flooded areas and cross-check reports.”

Screen Shot 2015-06-29 at 2.38.54 PM

During the latest monsoon season, Peta Jakarta “received and mapped 1,119 confirmed reports of flooding. These reports were formed by 877 users, indicating an average tweet to user ratio of 1.27 tweets per user. A further 2,091 confirmed reports were received without the required geolocation metadata to be mapped, highlighting the value of the programmatic geo-location ‘reminders’ […]. With regard to unconfirmed reports, Peta Jakarta recorded and mapped a total of 25,584 over the course of the monsoon.”

The Live Crisis Maps could be viewed via two different interfaces depending on the end user. For local residents, the maps could be accessed via smartphone with the visual display designed specifically for more tactical decision-making, showing flood reports at the neighborhood level and only for the past hour.

PJ2

For institutional partners, the data is visualized in more aggregate terms for strategic decision-making based trends-analysis and data integration. “When viewed on a desktop computer, the web-application scaled the map to show a situational overview of the city.”

Credit: Peta Jakarta

Peta Jakarta has “proven the value and utility of social media as a mega-city methodology for crowdsourcing relevant situational information to aid in decision-making and response coordination during extreme weather events.” The initiative enables “autonomous users to make independent decisions on safety and navigation in response to the flood in real-time, thereby helping increase the resilience of the city’s residents to flooding and its attendant difficulties.” In addition, by “providing decision support at the various spatial and temporal scales required by the different actors within city, Peta Jakarta offers an innovative and inexpensive method for the crowdsourcing of time-critical situational information in disaster scenarios.” The resulting confirmed and verified tweets were used by BPBD DKI Jakarta to “cross-validate formal reports of flooding from traditional data sources, supporting the creation of information for flood assessment, response, and management in real-time.”


My blog post is based several conversations I had with Peta Jakarta team and on this white paper, which was just published a week ago. The report runs close to 100 pages and should absolutely be considered required reading for all Digital Humanitarians and CrisisMappers. The paper includes several dozen insights which a short blog post simply cannot do justice to. If you can’t find the time to read the report, then please see the key excerpts below. In a future blog post, I’ll describe how the Peta Jakarta team plans to leverage UAVs to complement social media reporting.

  • Extracting knowledge from the “noise” of social media requires designed engagement and filtering processes to eliminate unwanted information, reward valuable reports, and display useful data in a manner that further enables users, governments, or other agencies to make non-trivial, actionable decisions in a time-critical manner.
  • While the utility of passively-mined social media data can offer insights for offline analytics and derivative studies for future planning scenarios, the critical issue for frontline emergency responders is the organization and coordination of actionable, real-time data related to disaster situations.
  • User anonymity in the reporting process was embedded within the Peta Jakarta project. Whilst the data produced by Twitter reports of flooding is in the public domain, the objective was not to create an archive of users who submitted potentially sensitive reports about flooding events, outside of the Twitter platform. Peta Jakarta was thus designed to anonymize reports collected by separating reports from their respective users. Furthermore, the text content of tweets is only stored when the report is confirmed, that is, when the user has opted to send a message to the @petajkt account to describe their situation. Similarly, when usernames are stored, they are encrypted using a one-way hash function.
  • In developing the Peta Jakarta brand as the public face of the project, it was important to ensure that the interface and map were presented as community-owned, rather than as a government product or academic research tool. Aiming to appeal to first adopters—the young, tech-savvy Twitter-public of Jakarta—the language used in all the outreach materials (Twitter replies, the outreach video, graphics, and print advertisements) was intentionally casual and concise. Because of the repeated recurrence of flood events during the monsoon, and the continuation of daily activities around and through these flood events, the messages were intentionally designed to be more like normal twitter chatter and less like public service announcements.
  • It was important to design the user interaction with PetaJakarta.org to create a user experience that highlighted the community resource element of the project (similar to the Waze traffic app), rather than an emergency or information service. With this aim in mind, the graphics and language are casual and light in tone. In the video, auto-replies, and print advertisements, PetaJakarta.org never used alarmist or moralizing language; instead, the graphic identity is one of casual, opt-in, community participation.
  • The most frequent question directed to @petajkt on Twitter was about how to activate the geo-location function for tweets. So far, this question has been addressed manually by sending a reply tweet with a graphic instruction describing how to activate geo-location functionality.
  • Critical to the success of the project was its official public launch with, and promotion by, the Governor. This endorsement gave the platform very high visibility and increased legitimacy among other government agencies and public users; it also produced a very successful media event, which led substantial media coverage and subsequent public attention.

  • The aggregation of the tweets (designed to match the spatio-temporal structure of flood reporting in the system of the Jakarta Disaster Management Agency) was still inadequate when looking at social media because it could result in their overlooking reports that occurred in areas of especially low Twitter activity. Instead, the Agency used the @petajkt Twitter stream to direct their use of the map and to verify and cross-check information about flood-affected areas in real-time. While this use of social media was productive overall, the findings from the Joint Pilot Study have led to the proposal for the development of a more robust Risk Evaluation Matrix (REM) that would enable Peta Jakarta to serve a wider community of users & optimize the data collection process through an open API.
  • Developing a more robust integration of social media data also means leveraging other potential data sets to increase the intelligence produced by the system through hybridity; these other sources could include, but are not limited to, government, private sector, and NGO applications (‘apps’) for on- the-ground data collection, LIDAR or UAV-sourced elevation data, and fixed ground control points with various types of sensor data. The “citizen-as- sensor” paradigm for urban data collection will advance most effectively if other types of sensors and their attendant data sources are developed in concert with social media sourced information.

Review: The First Ever Course on Humanitarian UAVs

UAViatorsLogo

The Humanitarian UAV Network (UAViators) promotes the safe, coordinated and effective use of UAVs in a wide range of humanitarian settings. To this end, the Network’s mission includes training the first generation of Humanitarian UAV experts. This explains why I teamed up with VIVES Aeronautics College last year to create and launch the first ever UAV training specifically geared towards established humanitarian organizations. The 3-day, intensive and hands-on training took place this month in Belgium and went superbly well, which is why we’ll be offering it again next year and possibly a second time this year as well.

Participants included representatives from the United Nations Office for the Coordination of Humanitarian Affairs (OCHA), World Food Program (WFP), International Organization for Migration (IOM), European Union Humanitarian Aid Organization (ECHO), Medair, Direct Relief, and Germany’s Development Organization GIZ. We powered through the most important subjects, ranging from airspace regulations to the physics of flight, the in’s and out’s of civil aviation, aeronautics, weather forecasts, programming flight routes, operational safety, standard operating procedures, best practices, etc. I gave trainings on both Humanitarian UAV Applications and Humanitarian UAV Operations, which totaled well over 4 hours of instruction and discussion. The Ops training included a detailed review of best practices—summary available here. Knowing how to operate this new technology is definitely the easy part; knowing how to use UAVs effectively and responsibly in real-world humanitarian contexts is a far bigger challenge; hence the need for this training.

The purpose of the course was to provide the kind of training that humanitarian professionals need in order to 1) Fully understand the opportunities and limitations of this new technology; 2) Partner effectively with professional UAV teams during disasters; and 3) Operate safely, legally, responsibly and ethically. The accelerated training ended with a 2-hour simulation exercise in which participants were tasked with carrying out a UAV mission in Nepal for which they had to use all the standard operating procedures and best practices they had learned over the course of the training. Each team then had to present in detail how they would carry out the required mission.

Below are pictures from the 3-day event. Each day included some 12 hours of instructions and discussions—so these pictures certainly don’t cover all of the flights, materials and seminars. For more on this unique UAV training course, check out this excellent blog post by Andrew Schroeder from Direct Relief. In the meantime, please feel free to get in touch with me if you’re interested taking this course in the future or would like a customized one for your organization.

thumb_IMG_3744_1024

The VIVES Aeronautics campus in Belgium has a dedicated group focused on UAV courses, training and research in addition to traditional aviation training.

thumb_IMG_3748_1024

Facilities at VIVES include flight simulators, computer labs and labs dedicated to building UAVs.

thumb_IMG_3750_1024

We went through hundreds of pages and at least 400 slides of dedicated training material over the course of the 3 days.

thumb_IMG_3679_1024

We took a direct, hands-on approach from day one of the training. Naturally, we go all the necessary legal permissions to operate UAVs in this area.

thumb_IMG_3688_1024

Introducing participants to fixed-wing and multi-rotor UAVs.

thumb_IMG_3678_1024

Participants learned how the basics on how to operate this fixed-wing UAV.

thumb_IMG_3693_1024

Some fixed-wing UAVs are hand-launched, this one uses a dedicated launcher. We flew this one for about 20 minutes.

thumb_IMG_3700_1024

Multi-rotor UAVs were then introduced and participants were instructed on how to operate this model themselves during the training.

thumb_IMG_3709_1024

So each participant took to the controls under the supervision of certified UAV pilots and got a feel for manual flights.

thumb_IMG_3721_1024

Other multi-rotor UAVs were also introduced along with standard operating procedures related to safety, take-off, flight and landing.

thumb_IMG_3737_1024

Multi-rotors were compared with fixed-wing UAVs and participants asked about which type of asset to use for different humanitarian UAV missions.

thumb_IMG_3732_1024

We then visited a factory dedicated towards the manufacturing of long-range fixed-wing UAVs so participants could learn about airframes and hardware.

thumb_IMG_3743_1024

After half-a-day of outdoor, hands-on training on UAVs, the real-work began.

thumb_IMG_3786_1024

Intensive, back-to-back seminars to provide humanitarian participants with everything they need to know about UAVs, humanitarian applications and also humanitarian UAV missions.

thumb_IMG_3802_1024

From the laws of the skies and reading official air-route maps to understanding airspace classes and regulations.

UAV-Training-600x335

Safety was an overriding theme throughout the 3-day training.

thumb_IMG_3804_1024

Safety training included standard operating procedures for hardware & batteries

thumb_IMG_3792_1024

Participants were also introduced to the principles of flight and aviation.

thumb_IMG_3788_1024

All seminars were highly interactive and also allowed for long question & answer sessions; some of these lasted up to an hour and continued during the breaks.

thumb_IMG_3794_1024

All aspects of UAV technology was introduced and discussed at length, such as First Person View (FPV).

thumb_IMG_3798_1024

Regulations were an important component of the 3-day training.

thumb_IMG_3752_1024

Participants learned how to program UAV flights; they were introduced to the software and provided with an overview of best practices on flight planning.

thumb_IMG_3662_1024

A hands-on introduction to imagery processing and analysis was also provided. Participants were taught how to use dedicated software to process and analyze the aerial imagery captured during the morning outdoor sessions.

thumb_IMG_3760_1024

Participants thus spent time in the dedicated computer lab working with this imagery and creating 3D point clouds, for example.

thumb_IMG_3778_1024

Humanitarian OpenStreetMap, MapBoxMicroMappers were also introduced.

thumb_IMG_3770_1024

The first UAViators & VIVES Class of 2015!

UVAVIATOR-600x400

Handbook: How to Catalyze Humanitarian Innovation in Computing Research Institutes

This research was commissioned by the World Humanitarian Summit (WHS) Innovation Team, which I joined last year. An important goal of the Summit’s Innovation Team is to identify concrete innovation pathways that can transform the humanitarian industry into a more effective, scalable and agile sector. I have found that discussions on humanitarian innovation can sometimes tend towards conceptual, abstract and academic questions. This explains why I took a different approach vis-a-vis my contribution to the WHS Innovation Track.

WHS_Logo_0

The handbook below provides practical collaboration guidelines for both humanitarian organizations & computing research institutes on how to catalyze humanitarian innovation through successful partnerships. These actionable guidelines are directly applicable now and draw on extensive interviews with leading humanitarian groups and CRI’s including the International Committee of the Red Cross (ICRC), United Nations Office for the Coordination of Humanitarian Affairs (OCHA), United Nations Children’s Fund (UNICEF), United Nations High Commissioner for Refugees (UNHCR), UN Global Pulse, Carnegie Melon University (CMU), International Business Machines (IBM), Microsoft Research, Data Science for Social Good Program at the University of Chicago and others.

This handbook, which is the first of its kind, also draws directly on years of experience and lessons learned from the Qatar Computing Research Institute’s (QCRI) active collaboration and unique partnerships with multiple international humanitarian organizations. The aim of this blog post is to actively solicit feedback on this first, complete working draft, which is available here as an open and editable Google Doc. So if you’re interested in sharing your insights, kindly insert your suggestions and questions by using the Insert/Comments feature. Please do not edit the text directly.

I need to submit the final version of this report on July 1, so very much welcome constructive feedback via the Google Doc before this deadline. Thank you!

Humanitarian UAV Missions: Towards Best Practices

UAViatorsLogo

The purpose of the handbook below is to promote the safe, coordinated and effective use of UAVs in a wide range of humanitarian settings. The handbook draws on lessons learned during recent humanitarian UAV missions in Vanuatu (March-April 2015) and Nepal (April-May 2015) as well as earlier UAV missions in both Haiti and the Philippines. The handbook takes the form of an operational checklist divided into Pre-flight, In-flight and Post-flight sections. The best practices documented in each section are meant to serve as a minimum set of guidelines only. As such, this document is not the final word on best practices, which explains why the handbook is available here as an open, editable Google Doc. We invite humanitarian, UAV and research communities to improve this handbook and to keep our collective best practices current by inserting key comments and suggestions directly to the Google Doc. Both hardcopies and digital copies of this handbook are available for free and may not in part or in whole be used for commercial purposes. Click here for more information on the Humanitarian UAV Network.

Assessing Disaster Damage from 3D Point Clouds

Humanitarian and development organizations like the United Nations and the World Bank typically carry out disaster damage and needs assessments following major disasters. The ultimate goal of these assessments is to measure the impact of disasters on the society, economy and environment of the affected country or region. This includes assessing the damage caused to building infrastructure, for example. These assessment surveys are generally carried out in person—that is, on foot and/or by driving around an affected area. This is a very time-consuming process with very variable results in terms of data quality. Can 3D (Point Clouds) derived from very high resolution aerial imagery captured by UAVs accelerate and improve the post-disaster damage assessment process? Yes, but a number of challenges related to methods, data & software need to be overcome first. Solving these challenges will require pro-active cross-disciplinary collaboration.

The following three-tiered scale is often used to classify infrastructure damage: “1) Completely destroyed buildings or those beyond repair; 2) Partially destroyed buildings with a possibility of repair; and 3) Unaffected buildings or those with only minor damage . By locating on a map all dwellings and buildings affected in accordance with the categories noted above, it is easy to visualize the areas hardest hit and thus requiring priority attention from authorities in producing more detailed studies and defining demolition and debris removal requirements” (UN Handbook). As one World Bank colleague confirmed in a recent email, “From the engineering standpoint, there are many definitions of the damage scales, but from years of working with structural engineers, I think the consensus is now to use a three-tier scale – destroyed, heavily damaged, and others (non-visible damage).”

That said, field-based surveys of disaster damage typically overlook damage caused to roofs since on-the-ground surveyors are bound by the laws of gravity. Hence the importance of satellite imagery. At the same time, however, “The primary problem is the vertical perspective of [satellite imagery, which] largely limits the building information to the roofs. This roof information is well suited for the identification of extreme damage states, that is completely destroyed structures or, to a lesser extent, undamaged buildings. However, damage is a complex 3-dimensional phenomenon,” which means that “important damage indicators expressed on building façades, such as cracks or inclined walls, are largely missed, preventing an effective assessment of intermediate damage states” (Fernandez Galaretta et al. 2014).

Screen Shot 2015-04-06 at 10.58.31 AM

This explains why “Oblique imagery [captured from UAVs] has been identified as more useful, though the multi-angle imagery also adds a new dimension of complexity” as we experienced first-hand during the World Bank’s UAV response to Cyclone Pam in Vanuatu (Ibid, 2014). Obtaining photogrammetric data for oblique images is particularly challenging. That is, identifying GPS coordinates for a given house pictured in an oblique photograph is virtually impossible to do automatically with the vast majority of UAV cameras. (Only specialist cameras using gimbal mounted systems can reportedly infer photogrammetric data in oblique aerial imagery, but even then it is unclear how accurate this inferred GPS data is). In any event, oblique data also “lead to challenges resulting from the multi-perspective nature of the data, such as how to create single damage scores when multiple façades are imaged” (Ibid, 2014).

To this end, my colleague Jorge Fernandez Galarreta and I are exploring the use of 3D (point clouds) to assess disaster damage. Multiple software solutions like Pix4D and PhotoScan can already be used to construct detailed point clouds from high-resolution 2D aerial imagery (nadir and oblique). “These exceed standard LiDAR point clouds in terms of detail, especially at façades, and provide a rich geometric environment that favors the identification of more subtle damage features, such as inclined walls, that otherwise would not be visible, and that in combination with detailed façade and roof imagery have not been studied yet” (Ibid, 2014).

Unlike oblique images, point clouds give surveyors a full 3D view of an urban area, allowing them to “fly through” and inspect each building up close and from all angles. One need no longer be physically onsite, nor limited to simply one façade or a strictly field-based view to determine whether a given building is partially damaged. But what does partially damaged even mean when this kind of high resolution 3D data becomes available? Take this recent note from a Bank colleague with 15+ years of experience in disaster damage assessments: “In the [Bank’s] official Post-Disaster Needs Assessment, the classification used is to say that if a building is 40% damaged, it needs to be repaired. In my view this is too vague a description and not much help. When we say 40%, is it the volume of the building we are talking about or the structural components?”

Screen Shot 2015-05-17 at 1.45.50 PM

In their recent study, Fernandez Galaretta et al. used point clouds to generate per-building damage scores based on a 5-tiered classification scale (D1-D5). They chose to compute these damage scores based on the following features: “cracks, holes, intersection of cracks with load-carrying elements and dislocated tiles.” They also selected non-damage related features: “façade, window, column and intact roof.” Their results suggest that the visual assessment of point clouds is very useful to identify the following disaster damage features: total collapse, collapsed roof, rubble piles, inclined façades and more subtle damage signatures that are difficult to recognize in more traditional BDA [Building Damage Assessment] approaches. The authors were thus able to compute a per building damage score, taking into account both “the overall structure of the building,” and the “aggregated information collected from each of the façades and roofs of the building to provide an individual per-building damage score.”

Fernandez Galaretta et al. also explore the possibility of automating this damage assessment process based on point clouds. Their conclusion: “More research is needed to extract automatically damage features from point clouds, combine those with spectral and pattern indicators of damage, and to couple this with engineering understanding of the significance of connected or occluded damage indictors for the overall structural integrity of a building.” That said, the authors note that this approach would “still suffer from the subjectivity that characterizes expert-based image analysis.”

Hence my interest in using crowdsourcing to analyze point clouds for disaster damage. Naturally, crowdsourcing alone will not eliminate subjectivity. In fact, having more people analyze point clouds may yield all kinds of disparate results. This is explains why a detailed and customized imagery interpretation guide is necessary; like this one, which was just released by my colleagues at the Harvard Humanitarian Initiative (HHI). This also explains why crowdsourcing platforms require quality-control mechanisms. One easy technique is triangulation: have ten different volunteers look at each point cloud and tag features in said cloud that show cracks, holes, intersection of cracks with load-carrying elements and dislocated tiles. Surely more eyes are better than two for tasks that require a good eye for detail.

Screen Shot 2015-05-17 at 1.49.59 PM

Next, identify which features have the most tags—this is the triangulation process. For example, if one area of a point cloud is tagged as a “crack” by 8 or more volunteers, chances are there really is a crack there. One can then count the total number of distinct areas tagged as cracks by 8 or more volunteers across the point cloud to calculate the total number of cracks per façade. Do the same with the other metrics (holes, dislocated titles, etc.), and you can compute a per building damage score based on overall consensus derived from hundreds of crowdsourced tags. Note that “tags’ can also be lines or polygons; meaning that individual cracks could be traced by volunteers, thus providing information on the approximate lengths/size of a crack. This variable could also be factored in the overall per-building damage score.

In sum, crowdsourcing could potentially overcome some of the data quality issues that have already marked field-based damage assessment surveys. In addition, crowdsourcing could potentially speed up the data analysis since professional imagery and GIS analysts tend to already be hugely busy in the aftermath of major disasters. Adding more data to their plate won’t help anyone. Crowdsourcing the analysis of 3D point clouds may thus be our best bet.

So why hasn’t this all been done yet? For several reasons. For one, creating very high-resolution point clouds requires more pictures and thus more UAV flights, which can be time consuming. Second, processing aerial imagery to construct point clouds can also take some time. Third, handling, sharing and hosting point clouds can be challenging given how large those files quickly get. Fourth, no software platform currently exists to crowdsource the annotation of point clouds as described above (particularly when it comes to the automated quality control mechanisms that are necessary to ensure data quality). Fifth, we need more robust imagery interpretation guides. Sixth, groups like the UN and the World Bank are still largely thinking in 2D rather than 3D. And those few who are considering 3D tend to approach this from a data visualization angle rather than using human and machine computing to analyze 3D data. Seventh, this area, point cloud analysis for 3D feature detection, is still a very new area of research. Many of the methodology questions that need answers have yet to be answered, which is why my team and I at QCRI are starting to explore this area from the perspective of computer vision and machine learning.

The holy grail? Combining crowdsourcing with machine learning for real-time feature detection of disaster damage in 3D point clouds rendered in real-time via airborne UAVs surveying a disaster site. So what is it going to take to get there? Well, first of all, UAVs are becoming more sophisticated; they’re flying faster and for longer and will increasingly be working in swarms. (In addition, many of the new micro-UAVs come with a “follow me” function, which could enable the easy and rapid collection of aerial imagery during field assessments). So the first challenge described above is temporary as are the second and third challenges since computer processing power is increasing, not decreasing, over time.

This leaves us with the software challenge and imagery guides. I’m already collaborate with HHI on the latter. As for the former, I’ve spoken with a number of colleagues to explore possible software solutions to crowdsource the tagging of point clouds. One idea is simply to extend MicroMappers. Another is to add simple annotation features to PLAS.io and PointCloudViz since these platforms are already designed to visualize and interact with point clouds. A third option is to use a 3D model platform like SketchFab, which already enables annotations. (Many thanks to colleague Matthew Schroyer for pointing me to SketchFab last week). I’ve since had a long call with SketchFab and am excited by the prospects of using this platform for simple point cloud annotation.

In fact, Matthew already used SketcFab to annotate a 3D model of Durbar Square neighborhood in downtown Kathmandu post-earthquake. He found an aerial video of the area, took multiple screenshots of this video, created a point cloud from these and then generated a 3D model which he annotated within SketchFab. This model, pictured below, would have been much higher resolution if he had the original footage or 2D images. Click pictures to enlarge.

3D Model 1 Nepal

3D Model 2 Nepal

3D Model 3 Nepal

3D Model 4 Nepal

Here’s a short video with all the annotations in the 3D model:

And here’s the link to the “live” 3D model. And to drive home the point that this 3D model could be far higher resolution if the underlying imagery had been directly accessible to Matthew, check out this other SketchFab model below, which you can also access in full here.

Screen Shot 2015-05-16 at 9.35.20 AM

Screen Shot 2015-05-16 at 9.35.41 AM

Screen Shot 2015-05-16 at 9.37.33 AM

The SketchFab team has kindly given me a SketchFab account that allows up to 50 annotations per 3D model. So I’ll be uploading a number of point clouds from Vanuatu (post Cyclone Pam) and Nepal (post earthquakes) to explore the usability of SketchFab for crowdsourced disaster damage assessments. In the meantime, one could simply tag-and-number all major features in a point cloud, create a Google Form, and ask digital volunteers to rate the level of damage near each numbered tag. Not a perfect solution, but one that works. Ultimately, we’d need users to annotate point clouds by tracing 3D polygons if we wanted a more easy way to use the resulting data for automated machine learning purposes.

In any event, if readers do have any suggestions on other software platforms, methodologies, studies worth reading, etc., feel free to get in touch via the comments section below or by email, thank you. In the meantime, many thanks to colleagues Jorge, Matthew, Ferda & Ji (QCRI), Salvador (PointCloudViz), Howard (PLAS.io) and Corentin (SketchFab) for the time they’ve kindly spent brainstorming the above issues with me.