Tag Archives: Statistics

Using Social Media to Predict Economic Activity in Cities

Economic indicators in most developing countries are often outdated. A new study suggests that social media may provide useful economic signals when traditional economic data is unavailable. In “Taking Brazil’s Pulse: Tracking Growing Urban Economies from Online Attention” (PDF), the authors accurately predict the GDPs of 45 Brazilian cities by analyzing data from a popular micro-blogging platform (Yahoo Meme). To make these predictions, the authors used the concept of glocality, which notes that “economically successful cities tend to be involved in interactions that are both local and global at the same time.” The results of the study reveals that “a city’s glocality, measured with social media data, effectively signals the city’s economic well-being.”

The authors are currently expanding their work by predicting social capital for these 45 cities based on social media data. As iRevolution readers will know, I’ve blogged extensively on using social media to measure social capital footprints at the city and sub-city level. So I’ve contacted the authors of the study and look forward to learning more about their research. As they rightly note:

“There is growing interesting in using digital data for development opportunities, since the number of people using social media is growing rapidly in developing countries as well. Local impacts of recent global shocks – food, fuel and financial – have proven not to be immediately visible and trackable, often unfolding ‘beneath the radar of traditional monitoring systems’. To tackle that problem, policymakers are looking for new ways of monitoring local impacts […].”


bio

Social Media, Disaster Response and the Streetlight Effect

A police officer sees a man searching for his coin under a streetlight. After helping for several minutes, the exasperated officer asks if the man is sure that he lost his coin there. The man says “No, I lost them in the park a few blocks down the street.” The incredulous officer asks why he’s searching under the streetlight. The man replies, “Well this is where the light is.”[1] This parable describes the “streetlight effect,” the observational bias that results from using the easiest way to collect information. The streetlight effect is an important criticisms leveled against the use of social media for emergency management. This certainly is a valid concern but one that needs to be placed into context.

muttjeff01
I had the honor of speaking on a UN panel with Hans Rosling in New York last year. During the Q&A, Hans showed Member States a map of cell phone coverage in the Democratic Republic of the Congo (DRC). The map was striking. Barely 10% of the country seemed to have coverage. This one map shut down the entire conversation about the value of mobile technology for data collection during disasters. Now, what Hans didn’t show was a map of the DRC’s population distribution, which reveals that the majority of the country’s population lives in urban areas; areas that have cell phone coverage. Hans’s map was also static and thus did not convey the fact that the number cell phone subscribers increased by roughly 50% in the year leading up to the panel and ~50% again the year after.

Of course, the number of social media users in the DRC is far, far lower than the country’s 12.4 million unique cell phone subscribers. The map below, for example, shows the location of Twitter users over a 10 day period in October 2013. Now keep in mind that only 2% of users actually geo-tag their tweets. Also, as my colleague Kalev Leetaru recently discovered, the correlation between the location of Twitter users and access to electricity is very high, which means that every place on Earth that is electrified has a high probability of having some level of Twitter activity. Furthermore, Twitter was only launched 7 years ago compared to the first cell phone, which was built 30 years ago. So these are still early days for Twitter. But that doesn’t change the fact that there is clearly very little Twitter traffic in the DRC today. And just like the man in the parable above, we only have access to answers where an “electrified tweet” exists (if we restrict ourselves to the Twitter streetlight).

DRC twitter map 2

But this begs the following question, which is almost always overlooked: too little traffic for what? This study by Harvard colleagues, for example, found that Twitter was faster (and as accurate) as official sources at detecting the start and early progress of Cholera after the 2010 earthquake. And yet, the corresponding Twitter map of Haiti does not show significantly more activity than the DRC map over the same 10-day period. Keep in mind there were far fewer Twitter users in Haiti four years ago (i.e., before the earthquake). Other researchers have recently shown that “micro-crises” can also be detected via Twitter even though said crises elicit very few tweets by definition. More on that here.

Haiti twitter map

But why limit ourselves to the Twitter streetlight? Only a handful of “puzzle pieces” in our Haiti jigsaw may be tweets, but that doesn’t mean they can’t complement other pieces taken from traditional datasets and even other social media channels. Remember that there are five times more Facebook users than Twitter users. In certain contexts, however, social media may be of zero added value. I’ve reiterated this point again in recent talks at the Council on Foreign Relation and the UN. Social media is forming a new “nervous system” for our planet, but one that is still very young, even premature in places and certainly imperfect in representation. Then again, so was 911 in the 1970’s and 1980’s as explained here. In any event, focusing on more developed parts of the system (like Indonesia’s Twitter footprint below) makes more sense for some questions, as does complementing this new nervous system with other more mature data sources such mainstream media via as GDELT as advocated here.

Indonesia twitter map2

The Twitter map of the Manila area below is also the result of 10-day traffic. While “only” ~12 million Filipinos (13% of the country) lives in Manila, it behoves us to remember that urban populations across the world are booming. In just over 2,000 days, more than half of the population in the world’s developing regions will be living in urban areas according to the UN. Meanwhile, the rural population of developing countries will decline by half-a-billion in coming decades. At the same time, these rural populations will also grow a larger social media footprint since mobile phone penetration rates already stand at 89% in developing countries according to the latest ITU study (PDF). With Google and Facebook making it their (for-profit) mission to connect those off the digital grid, it is only a matter of time until very rural communities get online and click on ads.

Manila twitter map

The radical increase in population density means that urban areas will become even more vulnerable to major disasters (hence the Rockefeller Foundation’s program on 100 Resilience Cities). To be sure, as Rousseau noted in a letter to Voltaire after the massive 1756 Portugal Earthquake, “an earthquake occurring in wilderness would not be important to society.” In other words, disaster risk is a function of population density. At the same time, however, a denser population also means more proverbial streetlights. But just as we don’t need a high density of streetlights to find our way at night, we hardly need everyone to be on social media for tweets and Instagram pictures to shed some light during disasters and facilitate self-organized disaster response at the grassroots level.

Credit: Heidi RYDER Photography

My good friend Jaroslav Valůch recounted a recent conversation he had with an old fireman in a very small town in Eastern Europe who had never heard of Twitter, Facebook or crowdsourcing. The old man said: “During crisis, for us, the firemen, it is like having a dark house where only some rooms are lit (i.e., information from mayors and other official local sources in villages and cities affected). What you do [with social media and crowdsourcing], is that you are lighting up more rooms for us. So don’t worry, it is enough.”

No doubt Hans Rosling will show another dramatic map if I happen to sit on another panel with him. But this time I’ll offer context so that instead of ending the discussion, his map will hopefully catalyze a more informed debate. In any event, I suspect (and hope that) Hans won’t be the only one objecting to my optimism in this blog post. So as always, I welcome feedback from iRevolution readers. And as my colleague Andrew Zolli is fond of reminding folks at PopTech:

“Be tough on ideas, gentle on people.”

bio

Twitter, Crises and Early Detection: Why “Small Data” Still Matters

My colleagues John Brownstein and Rumi Chunara at Harvard Univer-sity’s HealthMap project are continuing to break new ground in the field of Digital Disease Detection. Using data obtained from tweets and online news, the team was able to identify a cholera outbreak in Haiti weeks before health officials acknowledged the problem publicly. Meanwhile, my colleagues from UN Global Pulse partnered with Crimson Hexagon to forecast food prices in Indonesia by carrying out sentiment analysis of tweets. I had actually written this blog post on Crimson Hexagon four years ago to explore how the platform could be used for early warning purposes, so I’m thrilled to see this potential realized.

There is a lot that intrigues me about the work that HealthMap and Global Pulse are doing. But one point that really struck me vis-a-vis the former is just how little data was necessary to identify the outbreak. To be sure, not many Haitians are on Twitter and my impression is that most humanitarians have not really taken to Twitter either (I’m not sure about the Haitian Diaspora). This would suggest that accurate, early detection is possible even without Big Data; even with “Small Data” that is neither representative or indeed verified. (Inter-estingly, Rumi notes that the Haiti dataset is actually larger than datasets typically used for this kind of study).

In related news, a recent peer-reviewed study by the European Commi-ssion found that the spatial distribution of crowdsourced text messages (SMS) following the earthquake in Haiti were strongly correlated with building damage. Again, the dataset of text messages was relatively small. And again, this data was neither collected using random sampling (i.e., it was crowdsourced) nor was it verified for accuracy. Yet the analysis of this small dataset still yielded some particularly interesting findings that have important implications for rapid damage detection in post-emergency contexts.

While I’m no expert in econometrics, what these studies suggests to me is that detecting change-over–time is ultimately more critical than having a large-N dataset, let alone one that is obtained via random sampling or even vetted for quality control purposes. That doesn’t mean that the latter factors are not important, it simply means that the outcome of the analysis is relatively less sensitive to these specific variables. Changes in the baseline volume/location of tweets on a given topic appears to be strongly correlated with offline dynamics.

What are the implications for crowdsourced crisis maps and disaster response? Could similar statistical analyses be carried out on Crowdmap data, for example? How small can a dataset be and still yield actionable findings like those mentioned in this blog post?

Applying Earthquake Physics to Conflict Analysis

I really enjoyed speaking with Captain Wayner Porter whilst at PopTech 2011 last week. We both share a passion for applying insights from complexity science to different disciplines. I’ve long found the analogies between earthquakes and conflicts intriguing. We often talk of geopolitical fault lines, mounting tensions and social stress. “If this sounds at all like the processes at work in the Earth’s crust, where stresses build up slowly to be released in sudden earthquakes … it may be no coincidence” (Buchanan 2001).

To be sure, violent conflict is “often like an earthquake: it’s caused by the slow accumulation of deep and largely unseen pressures beneath the surface of our day-to-day affairs. At some point these pressures release their accumulated energy with catastrophic effect, creating shock waves that pulverize our habitual and often rigid ways of doing things…” (Homer-Dixon 2006).

But are fore shocks and aftershocks in social systems really as discernible as well? Like earthquakes, both inter-state and internal wars actually occur with the same statistical pattern (see my previous blog post on this). Since earthquakes and conflicts are complex systems, they also exhibit emergent features associated with critical states. In sum, “the science of earthquakes […] can help us understand sharp and sudden changes in types of complex systems that aren’t geological–including societies…” (Homer-Dixon 2006).

Back in 2006, I collaborated with Professor Didier Sornette and Dr. Ryan Woodard from the Swiss Federal Institute of Technology (ETHZ) to assess whether a mathematical technique developed for earthquake prediction might shed light on conflict dynamics. I presented this study along with our findings at the American Political Science Association (APSA) convention last year (PDF). This geophysics technique, “superposed epoch analysis,” is used to identify statistical signatures before and after earthquakes. In other words, this technique allows us to discern whether any patterns are discernible in the data during foreshocks and aftershocks. Earthquake physicists work from global spatial time series data of seismic events to develop models for earthquake prediction. We used a global time series dataset of conflict events generated from newswires over a 15-year period. The graph below explains the “superposed epoch analysis” technique as applied to conflict data.

eqphysics

The curve above represents a time series of conflict events (frequency) over a particular period of time. We select arbitrary threshold, such as “threshold A” denoted by the dotted line. Every peak that crosses this threshold is then “copied” and “pasted” into a new graph. That is, the peak, together with the data points 25 days prior to and following the peak is selected.

The peaks in the new graph are then superimposed and aligned such that the peaks overlap precisely. With “threshold A”, two events cross the threshold, five for “threshold B”. We then vary the thresholds to look for consistent behavior and examine the statistical behavior of the 25 days before and after the “extreme” conflict event. For this study, we performed the computational technique described above on the conflict data for the US, UK, Afghanistan, Columbia and Iraq.

Picture 4Picture 5Picture 6

The foreshock and aftershock behaviors in Iraq and Afghanistan appear to be similar. Is this because the conflicts in both countries were the result of external intervention, i.e., invasion by US forces (exogenous shock)?

In the case of Colombia, an internal low intensity and protracted conflict, the statistical behavior of foreshocks and aftershocks are visibly different from those of Iraq and Afghanistan. Do the different statistical behaviors point to specific signature associated with exogenous and endogenous causes of extreme events? Does one set of behavior contrast with another one in the same way that old wars and new wars differ?

Are certain extreme events endogenous or exogenous in nature? Can endogenous or exogenous signatures be identified? In other words, are extreme events just part of the fat tail of a power law due to self-organized criticality (endogeneity)? Or is catastrophism in action, extreme events require extreme causes outside the system (exogeneity)?

Another possibility still is that extreme events are the product of both endo-genous and exogenous effects. How would this dynamic unfold? To answer these questions, we need to go beyond political science. The distinction between responses to endogenous and exogenous processes is a fundamental property of physics and is quantified as the fluctuation-dissipation theorem in statistical mechanics. This theory has been successfully applied to social systems (such as books sales) as a way to help understand different classes of causes and effects.

Questions for future research: Do conflict among actors in social systems display measurable endogenous and exogenous behavior? If so, can a quantitative signature of precursory (endogenous) behavior be used to help recognize and then reduce growing conflict? The next phase of this research will be to apply the above techniques to the conflict dataset already used to examine the statistical behavior of foreshocks and aftershocks.

An Open Letter to the Good People at Benetech

Dear Good People at Benetech,

We’re not quite sure why Benetech went out of their way in an effort to discredit ongoing research by the European Commission (EC) that analyzes SMS data crowdsourced during the disaster response to Haiti. Benetech’s area of expertise is in human rights (rather than disaster response), so why go after the EC’s findings, which had nothing to do with human rights?  To our fellow readers who desire context, feel free to read this blog postof mine along with these replies by Benetech’s CEO:

Issues with Crowdsourced Data Part 1
Issues with Crowdsourced Data Part 2

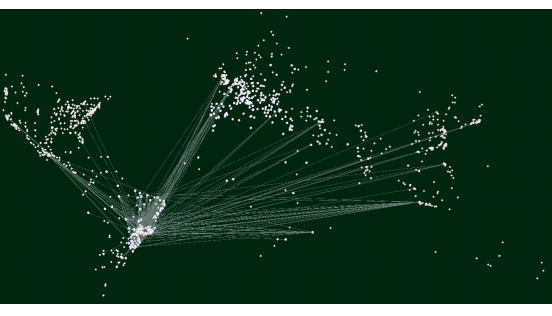
The short version of the debate is this: the EC’s exploratory study found that the spatial pattern of text messages from Mission 4636 in Haiti was positively correlated with building damage in Port-au-Prince. This would suggest that crowdsourced SMS data had statistical value in Haiti—in addition to their value in saving lives. But Benetech’s study shows a negative correlation. That’s basically it. If you’d like to read something a little more spicy though, do peruse this recent Fast Company article, fabulously entitled “How Benetech Slays Monsters with Megabytes and Math.” In any case, that’s the back-story.

So lets return to the Good People at Benetech. I thought I’d offer some of my humble guidance in case you feel threatened again in the future—I do hope you don’t mind and won’t take offense at my unsolicited and certainly imperfect advice. So by all means feel free to ignore everything that follows and focus on the more important work you do in the human rights space.

Next time Benetech wants to try and discredit the findings of a study in some other discipline, I recommend making sure that your own counter-findings are solid. In fact, I would suggest submitting your findings to a respected peer-reviewed journal—preferably one of the top tier scientific journals in your discipline. As you well know, after all, this really is the most objective and rigorous way to assess scientific work. Doing so would bring much more credibility to Benetech’s counter-findings than a couple blog posts.

My reasoning? Benetech prides itself (and rightly so) for carrying out some of the most advanced, cutting-edge quantitative research on patterns of human rights abuses. So if you want to discredit studies like the one carried out by the EC, I would have used this as an opportunity to publicly demonstrate the advanced expertise you have in quantitative analysis. But Benetech decided to use a simple non-spatial model to discredit the EC’s findings. Why use such a simplistic approach? Your response would have been more credible had you used statistical models for spatial point data instead. But granted, had you used more advanced models, you would have found evidence of a positive correlation. So you probably won’t want to read this next bit: a more elaborate “Tobit” correlation analysis actually shows the significance of SMS patterns as an explanatory variable in the spatial distribution of damaged buildings. Oh, and the correlation is (unfortunately) positive.

But that’s really beside the point. As my colleague Erik Hersman just wrote on the Ushahidi blog, one study alone is insufficient. What’s important is this: the last thing you want to do when trying to discredit a study in public is to come across as sloppy or as having ulterior motives (or both for that matter). Of course, you can’t control what other people think. If people find your response sloppy, then they may start asking whether the other methods you do use in your human rights analysis are properly peer-reviewed. They may start asking whether a strong empirical literature exists to back up your work and models. They may even want to know whether your expert statisticians have an accomplished track record and publish regularly in top-tier scientific journals. Other people may think you have ulterior motives and will believe this explains why you tried to discredit the EC’s preliminary findings. This doesn’t help your cause either. So it’s important to think through the implications of going public when trying to discredit someone’s research. Goodness knows I’ve made some poor calls myself on such matters in the past.

But lets take a step back for a moment. If you’re going to try and discredit research like the EC’s, please make sure you correctly represent the other side’s arguments. Skewing them or fabricating them is unlikely to make you very credible in the debate. For example, the EC study never concluded that Search and Rescue teams should only rely on SMS to save people’s lives. Furthermore, the EC study never claimed that using SMS is preferable over using established data on building density. It’s surely obvious—and you don’t need to demonstrate this statistically—to know that using a detailed map of building locations would provide a far better picture of potentially damaged buildings than crowdsourced SMS data. But what if this map is not available in a timely manner? As you may know, data layers of building density are not very common. Haiti was a good example of how difficult, expensive and time-consuming, the generation of such a detailed inventory is. The authors of the study simply wanted to test whether the SMS spatial pattern matched the damage analysis results, which it does. All they did was propose that SMS patterns could help in structuring the efforts needed for a detailed assessment, especially because SMS data can be received shortly after the event.

So to summarize, no one (I know) has ever claimed that crowdsourced data should replace established methods for information collection and analysis. This has never been an either or argument. And it won’t help your cause to turn it into a black-and-white debate because people familiar with these issues know full well that the world is more complex than the picture you are painting for them. They also know that people who take an either-or approach often do so when they have either run out of genuine arguments or had few to begin with. So none of this will make you look good. In sum, it’s important to (1) accurately reflect the other’s arguments, and (2) steer clear of creating an either-or, polarized debate. I know this isn’t easy to do, I’m guilty myself… on multiple counts.

I’ve got a few more suggestions—hope you don’t mind. They follow from the previous ones. The authors of the EC study never used their preliminary findings to extrapolate to other earthquakes, disasters or contexts. These findings were specific to the Haiti quake and the authors never claimed that their model was globally valid. So why did you extrapolate to human rights analysis when that was never the objective of the EC study? Regardless, this just doesn’t make you look good. I understand that Benetech’s focus is on human rights and not disaster response, but the EC study never sought to undermine your good work in the field of human rights. Indeed, the authors of the study hadn’t even heard of Benetech. So in the future, I would recommend not extrapolating findings from one study and assume they will hold in your own field of expertise or that they even threaten your area of expertise. That just doesn’t make any sense.

There are a few more tips I wanted to share with you. Everyone knows full well that crowdsourced data has important limitations—nobody denies this. But a number of us happen to think that some value can still be derived from crowdsourced data. Even Mr. Moreno-Ocampo, the head of the International Criminal Court (ICC), who I believe you know well, has pointed to the value of crowdsourced data from social media. In an interview with CNN last month, Mr. Moreno-Ocampo emphasized that Libya was the first time that the ICC was able to respond in real time to allegations of atrocities, partially due to social-networking sites such as Facebook. He added that, “this triggered a very quick reaction. The (United Nations) Security Council reacted in a few days; the U.N. General Assembly reacted in a few days. So, now because the court is up and running we can do this immediately,” he said. “I think Libya is a new world. How we manage the new challenge — that’s what we will see now.”

Point is, you can’t control the threats that will emerge or even prevent them, but you do control the way you decide to publicly respond to these threats. So I would recommend using your response as an opportunity to be constructive and demonstrate your good work rather than trying to discredit others and botching things up in the process.

But going back to the ICC and the bit in the Fast Company article about mathematics demonstrating the culpability of the Guatemalan government. Someone who has been following your work closely for years emailed me because they felt somewhat irked by all this. By the way, this is yet another unpleasant consequence of trying to publicly discredit others, new critics of your work will emerge. The critic in questions finds the claim a “little far fetched” re your mathematics demonstrating the culpability of the Guatemalan government. “There already was massive documented evidence of the culpability of the Guatemalan government in the mass killings of people. If there is a contribution from mathematics it is to estimate the number of victims who were never documented. So the idea is that documented cases are just a fraction of total cases and you can estimate the gap between the two. In order to do this estimation, you have to make a number of very strong assumptions, which means that the estimate may very well be unreliable anyway.”

Now, I personally think that’s not what you, Benetech, meant when you spoke with the journalist, cause goodness knows the number of errors that journalists have made writing about Haiti.

In any case, the critic had this to add: “In a court of law, this kind of estimation counts for little. In the latest trial at which Benetech presented their findings, this kind of evidence was specifically rejected. Benetech and others claim that in an earlier trial they nailed Milosevic. But Milosevic was never nailed in the first place—he died before judgment was passed and there was a definite feeling at the time that the trial wasn’t going well. In any case, in a court of law what matters are documented cases, not estimates, so this argument about estimates is really beside the point.”

Now I’m really no expert on any of these issues, so I have no opinion on this case or the statistics or the arguments involved. They may very well be completely wrong, for all I know. I’m not endorsing any of the above statements. I’m simply using them as an illustration of what might happen in the future if you don’t carefully plan your counter-argument before going public. People will take issue and try to discredit you in turn, which can be rather unpleasant.

In conclusion, I would like to remind the Good People at Benetech about what Ushahidi is and isn’t. The Ushahidi platform is not a methodology (as I have already written on iRevolution and the Ushahidi blog). The Ushahidi platform is a mapping tool. The methodology that people choose to use to collect information is entirely up to them. They can use random sampling, controlled surveys, crowdsourcing, or even the methodology used by Benetech. I wonder what the good people at Benetech would say if some of their data were to be visualized on an Ushahidi platform. Would they dismiss the crisis map altogether? And speaking of crisis maps, most Ushahidi maps are not crisis maps. The platform is used in a very wide variety of ways, even to map the best burgers in the US. Is Benetech also going to extrapolate the EC’s findings to burgers?

So to sum up, in case it’s not entirely clear, we know full well that there are important limitations to crowdsourced data in disaster response and have never said that the methodology of crowdsourcing should replace existing methodologies in the human rights space (or any other space for that matter). So please, lets not continue going in circles endlessly.

Now, where do we go from here? Well, I’ve never been a good pen pal, so don’t expect any more letters from me in response to the Good People at Benetech. I think everyone knows that a back and forth would be unproductive and largely a waste of time, not to mention an unnecessary distraction from the good work that we all try to do in the broader community to bring justice, voice and respect to marginalized communities.

Sincerely,

Demystifying Crowdsourcing: An Introduction to Non-Probability Sampling

The use of crowdsourcing may be relatively new to the technology, business and humanitarian sectors but when it comes to statistics, crowdsourcing is a well known and established sampling method. Crowdsourcing is just non-probability sampling. The crowdsourcing of crisis information is simply an application of non-probability sampling.

Lets first review probability sampling in which every unit in the population being sampled has a known probability (greater than zero) of being selected. This approach makes it possible to “produce unbiased estimates of population totals, by weighting sampled units according to their probability selection.”

Non-probability sampling, on the other hand, describes an approach in which some units of the population have no chance of being selected or where the probability of selection cannot be accurately determined. An example is convenience sampling. The main drawback of non-probability sampling techniques is that “information about the relationship between sample and population is limited, making it difficult to extrapolate from the sample to the population.”

There are several advantages, however. First, non-probability sampling is a quick way to collect way to collect and analyze data in range of settings with diverse populations. The approach is also a “cost-efficient means of greatly increasing the sample, thus enabling more frequent measurement.” In some cases, the non-probability sampling may actually be the only approach available—a common constrain in a lot of research, including many medical studies, not to mention Ushahidi Haiti. The method is also used in exploratory research, e.g., for hypothesis generation, especially when attempting to determine whether a problem exists or not.

The point is that non-probability sampling can save lives, many lives. Much of the data used for medical research is the product of convenience sampling. When you see your doctor, or you’re hospitalized, that is not a representative sample. Should the medical field throw away all this data based on the fact that it constitutes non-probability sampling. Of course not, that would be ludicrous.

The notion of bounded crowdsourcing, which I blogged about here, is also a known sampling technique called purposive sampling. This approach involves targeting experts or key informants. Snowball sampling is another type of non-probability sampling, which may also be applied to crowdsource of crisis information.

In snowball sampling, you begin by identifying someone who meets the criteria for inclusion in your study. You then ask them to recommend others who they may know who also meet the criteria. Although this method would hardly lead to representative samples, there are times when it may be the best method available. Snowball sampling is especially useful when you are trying to reach populations that are inaccessible or hard to find.

A project like Mission 4636 and Ushahidi-Haiti could take advantage of this approach by using two-way SMS communication to ask respondents to spread the word. Individuals who sent in text messages about persons trapped under the rubble could (later) be sent an SMS asking them to share the 4636 short code with people who may know of other trapped individuals. When the humanitarian response began to scale during the search and rescue operations, purposive sampling using UN personnel could also have been implemented.

In contrast to non-probability sampling techniques, probability sampling often requires considerable time and extensive resources. Furthermore, non-response effects can easily turn any probability design into non-probability sampling if the “characteristics of non-response are not well understood” since these modify each unit’s probability of being sampled.

This is not to suggest that one approach is better than the other since this depends entirely on the context and research question.

Patrick Philippe Meier