Tag Archives: Humanitarian

Early Results of MicroMappers Response to Typhoon Yolanda (Updated)

We have completed our digital humanitarian operation in the Philippines after five continuous days with MicroMappers. Many, many thanks to all volunteers from all around the world who donated their time by clicking on tweets and images coming from the Philippines. Our UN OCHA colleagues have confirmed that the results are being shared widely with their teams in the field and with other humanitarian organizations on the ground. More here.

ImageClicker

In terms of preliminary figures (to be confirmed):

  • Tweets collected during first 48 hours of landfall = ~230,000
  • Tweets automatically filtered for relevancy/uniqueness = ~55,000
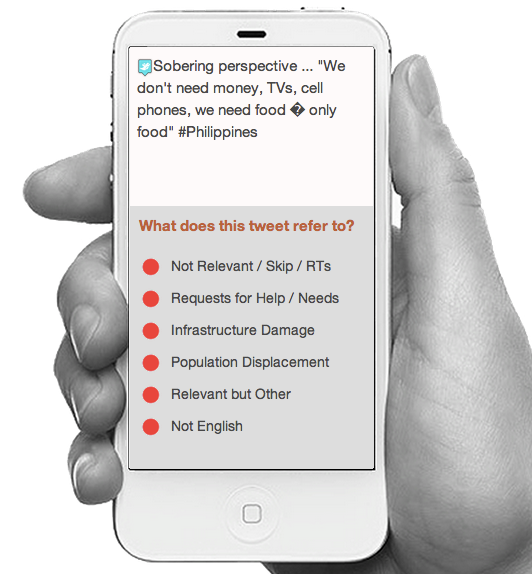
  • Tweets clicked using the TweetClicker = ~ 30,000
  • Relevant tweets triangulated using TweetClicker = ~3,800
  • Triangulated tweets published on live Crisis Map = ~600
  • Total clicks on TweetClicker = ~ 90,000
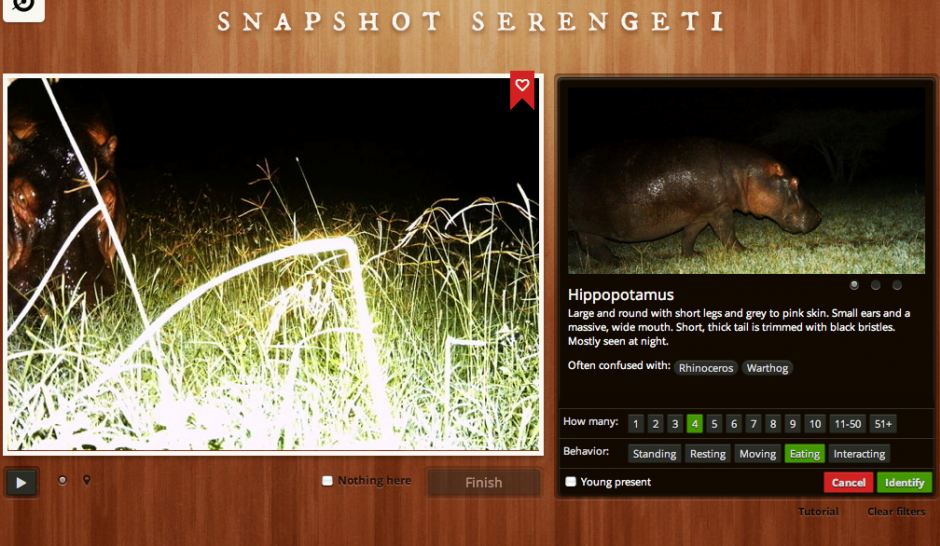
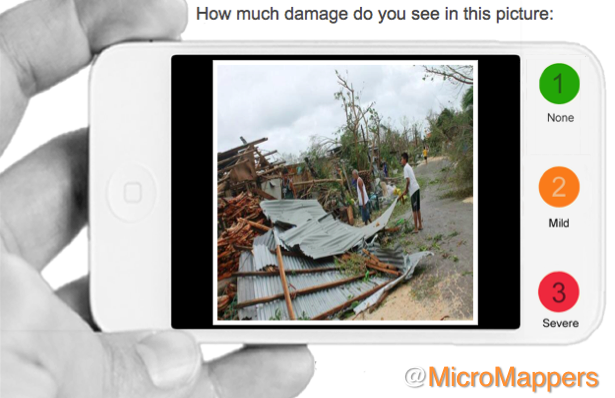
  • Images clicked using the ImageClicker = ~ 5,000
  • Relevant images triangulated using TweetClicker = ~1,200
  • Triangulated images published on live Crisis Map = ~180
  • Total clicks on ImageClicker = ~15,000
  • Total clicks on MicroMappers (Image + Tweet Clickers) = ~105,000

Since each single tweet and image uploaded to the Clickers was clicked on by (at least) three individual volunteers for quality control purposes, the number of clicks is three times the total number of tweets and images uploaded to the respective clickers. In sum, digital humanitarian volunteers have clocked a grand total of ~105,000 clicks to support humanitarian operations in the Philippines.

While the media has largely focused on the technology angle of our digital humanitarian operation, the human story is for me the more powerful message. This operation succeeded because people cared. Those ~105,000 clicks did not magically happen. Each and every single one of them was clocked by humans, not machines. At one point, we had over 300 digital volunteers from the world over clicking away at the same time on the TweetClicker and more than 200 on the ImageClicker. This kind of active engagement by total strangers—good “digital Samaritans”—explains why I find the human angle of this story to be the most inspiring outcome of MicroMappers. “Crowdsourcing” is just a new term for the old saying “it takes a village,” and sometimes it takes a digital village to support humanitarian efforts on the ground.

Until recently, when disasters struck in faraway lands, we would watch the news on television wishing we could somehow help. That private wish—that innate human emotion—would perhaps translate into a donation. Today, not only can you donate cash to support those affected by disasters, you can also donate a few minutes of your time to support the operational humanitarian response on the ground by simply clicking on MicroMappers. In other words, you can translate your private wish into direct, online public action, which in turn translates into supporting offline collective action in the disaster-affected areas.

Clicking is so simple that anyone with Internet access can help. We had high schoolers in Qatar clicking away, fire officers in Belgium, graduate students in Boston, a retired couple in Kenya and young Filipinos clicking away. They all cared and took the time to try and help others, often from thousands of miles away. That is the kind of world I want to live in. So if you share this vision, then feel free to join the MicroMapper list-serve.

Yolanda TweetClicker4

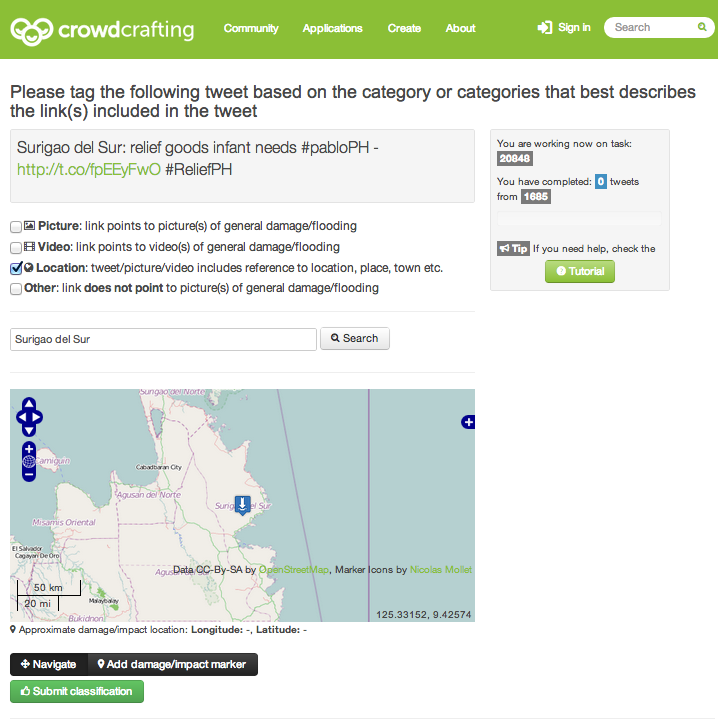
Considering that MicroMappers is still very much under development, we are all pleased with the results. There were of course many challenges; the most serious was the CrowdCrafting server which hosts our Clickers. Unfortunately, that server was not able to handle the load and traffic generated by digital volunteers. So their server crashed twice and also slowed our Clickers to a complete stop at least a dozen times during the past five days. At times, it would take 10-15 seconds for a new tweet or image to load, which was frustrating. We were also limited by the number of tweets and images we could upload at any given time, usually ~1,500 at most. Any larger load would seriously slow down the Clickers. So it is rather remarkable that digital volunteers managed to clock more than 100,000 clicks given the repeated interruptions. 

Besides the server issue, the other main bottleneck was the geo-location of the ~30,000 tweets and ~5,000 images tagged using the Clickers. We do have a Tweet and Image GeoClicker but these were not slated to launch until next week at CrisisMappers 2013, which meant they weren’t ready for prime time. We’ll be sure to launch them soon. Once they are operational, we’ll be able to automatically push triangulated tweets and images from the Tweet and Image Clickers directly to the corresponding GeoClickers so volunteers can also aid humanitarian organizations by mapping important tweets and images directly.

There’s a lot more that we’ve learned throughout the past 5 days and much room for improvement. We have a long list of excellent suggestions and feedback from volunteers and partners that we’ll be going through starting tomorrow. The most important next step is to get a more powerful server that can handle a lot more load and traffic. We’re already taking action on that. I have no doubt that our clicks would have doubled without the server constraints.

For now, though, BIG thanks to the SBTF Team and in particular Jus McKinnon, the QCRI et al team, in particular Ji Lucas, Hemant Purohit and Andrew Ilyas for putting in very, very long hours, day in and day out on top of their full-time jobs and studies. And finally, BIG thanks to the World Wide Crowd, to all you who cared enough to click and support the relief operations in the Philippines. You are the heroes of this story.

bio

Mining Mainstream Media for Emergency Management 2.0

There is so much attention (and hype) around the use of social media for emergency management (SMEM) that we often forget about mainstream media when it comes to next generation humanitarian technologies. The news media across the globe has become increasingly digital in recent years—and thus analyzable in real-time. Twitter added little value during the recent Pakistan Earthquake, for example. Instead, it was the Pakistani mainstream media that provided the immediate situational awareness necessary for a preliminary damage and needs assessment. This means that our humanitarian technologies need to ingest both social media and mainstream media feeds. 

Newspaper-covers

Now, this is hardly revolutionary. I used to work for a data mining company ten years ago that focused on analyzing Reuters Newswires in real-time using natural language processing (NLP). This was for a conflict early warning system we were developing. The added value of monitoring mainstream media for crisis mapping purposes has also been demonstrated repeatedly in recent years. In this study from 2008, I showed that a crisis map of Kenya was more complete when sources included mainstream media as well as user-generated content.

So why revisit mainstream media now? Simple: GDELT. The Global Data Event, Language and Tone dataset that my colleague Kalev Leetaru launched earlier this year. GDELT is the single largest public and global event-data catalog ever developed. Digital Humanitarians need no longer monitor mainstream media manually. We can simply develop a dedicated interface on top of GDELT to automatically extract situational awareness information for disaster response purposes. We’re already doing this with Twitter, so why not extend the approach to global digital mainstream media as well?

GDELT data is drawn from a “cross-section of all major international, national, regional, local, and hyper-local news sources, both print and broadcast, from nearly every corner of the globe, in both English and vernacular.” All identified events are automatically coded using the CAMEO coding framework (although Kalev has since added several dozen additional event-types). In short, GDELT codes all events by the actors involved, the type of event, location, time and other meta-data attributes. For example, actors include “Refugees,” “United Nations,” and “NGO”. Event-types include variables such as “Affect” which captures everything from refugees to displaced persons,  evacuations, etc. Humanitarian crises, aid, disasters, disaster relief, etc. are also included as an event-type. The “Provision of Humanitarian Aid” is another event-type, for example. GDELT data is currently updated every 24 hours, and Kalev has plans to provide hourly updates in the near future and ultimately 30-minute updates.

GDELT GKG

If this isn’t impressive enough, Kalev and colleagues have just launched the GDELT Global Knowledge Graph (GKG). “To sum up the GKG in a single sentence, it connects every person, organization, location, count, theme, news source, and event across the planet into a single massive network that captures what’s happening around the world, what its context is and who’s involved, and how the world is feeling about it, every single day.” The figure above (click to enlarge) is based on a subset of a single day of the GDELT Knowledge Graph, showing “how the cities of the world are connected to each other in a single day’s worth of news. A customized version of the GKG could perhaps prove useful for UN OCHA’s “Who Does What, Where” (3Ws) directory in the future. 

I’ve had long conversations with Kalev this month about leveraging GDELT for disaster response and he is very supportive of the idea. My hope is that we’ll be able to add a GDELT feed to MicroMappers next year. I’m also wondering whether we could eventually create a version of the AIDR platform that ingests GDELT data instead (or in addition to) Twitter. There is real potential here, which is why I’m excited that my colleagues at OCHA are exploring GDELT for humanitarian response. I’ll be meeting with them this week and next to explore ways to collaborate on making the most of GDELT for humanitarian response.

bio

Note: Mainstream media obviously includes television and radio as well. Some colleagues of mine in Austria are looking at triangulating television broadcasts with text-based media and social media for a European project.

New! Humanitarian Computing Library

The field of “Humanitarian Computing” applies Human Computing and Machine Computing to address major information-based challengers in the humanitarian space. Human Computing refers to crowdsourcing and microtasking, which is also referred to as crowd computing. In contrast, Machine Computing draws on natural language processing and machine learning, amongst other disciplines. The Next Generation Humanitarian Technologies we are prototyping at QCRI are powered by Humanitarian Computing research and development (R&D).

Screen Shot 2013-09-04 at 3.00.05 AM

My QCRI colleagues and I  just launched the first ever Humanitarian Computing Library which is publicly available here. The purpose of this library, or wiki, is to consolidate existing and future research that relate to Humanitarian Computing in order to support the development of next generation humanitarian tech. The repository currently holds over 500 publications that span topics such as Crisis Management, Trust and Security, Software and Tools, Geographical Analysis and Crowdsourcing. These publications are largely drawn from (but not limited to) peer-reviewed papers submitted at leading conferences around the world. We invite you to add your own research on humanitarian computing to this growing collection of resources.

Many thanks to my colleague ChaTo (project lead) and QCRI interns Rahma and Nada from Qatar University for spearheading this important project. And a special mention to student Rachid who also helped.

bio

Zooniverse: The Answer to Big (Crisis) Data?

Both humanitarian and development organizations are completely unprepared to deal with the rise of “Big Crisis Data” & “Big Development Data.” But many still hope that Big Data is but an illusion. Not so, as I’ve already blogged here, here and here. This explains why I’m on a quest to tame the Big Data Beast. Enter Zooniverse. I’ve been a huge fan of Zooniverse for as long as I can remember, and certainly long before I first mentioned them in this post from two years ago. Zooniverse is a citizen science platform that evolved from GalaxyZoo in 2007. Today, Zooniverse “hosts more than a dozen projects which allow volunteers to participate in scientific research” (1). So, why do I have a major “techie crush” on Zooniverse?

Oh let me count the ways. Zooniverse interfaces are absolutely gorgeous, making them a real pleasure to spend time with; they really understand user-centered design and motivations. The fact that Zooniverse is conversent in multiple disciplines is incredibly attractive. Indeed, the platform has been used to produce rich scientific data across multiple fields such as astronomy, ecology and climate science. Furthermore, this citizen science beauty has a user-base of some 800,000 registered volunteers—with an average of 500 to 1,000 new volunteers joining every day! To place this into context, the Standby Volunteer Task Force (SBTF), a digital humanitarian group has about 1,000 volunteers in total. The open source Zooniverse platform also scales like there’s no tomorrow, enabling hundreds of thousands to participate on a single deployment at any given time. In short, the software supporting these pioneering citizen science projects is well tested and rapidly customizable.

At the heart of the Zooniverse magic is microtasking. If you’re new to microtasking, which I often refer to as “smart crowdsourcing,” this blog post provides a quick introduction. In brief, Microtasking takes a large task and breaks it down into smaller microtasks. Say you were a major (like really major) astro-nomy buff and wanted to tag a million galaxies based on whether they are spiral or elliptical galaxies. The good news? The kind folks at the Sloan Digital Sky Survey have already sent you a hard disk packed full of telescope images. The not-so-good news? A quick back-of-the-envelope calculation reveals it would take 3-5 years, working 24 hours/day and 7 days/week to tag a million galaxies. Ugh!

Screen Shot 2013-03-25 at 4.11.14 PM

But you’re a smart cookie and decide to give this microtasking thing a go. So you upload the pictures to a microtasking website. You then get on Facebook, Twitter, etc., and invite (nay beg) your friends (and as many strangers as you can find on the suddenly-deserted digital streets), to help you tag a million galaxies. Naturally, you provide your friends, and the surprisingly large number good digital Samaritans who’ve just show up, with a quick 2-minute video intro on what spiral and elliptical galaxies look like. You explain that each participant will be asked to tag one galaxy image at a time by simply by clicking the “Spiral” or “Elliptical” button as needed. Inevitably, someone raises their hands to ask the obvious: “Why?! Why in the world would anyone want to tag a zillion galaxies?!”

Well, only cause analyzing the resulting data could yield significant insights that may force a major rethink of cosmology and our place in the Universe. “Good enough for us,” they say. You breathe a sigh of relief and see them off, cruising towards deep space to bolding go where no one has gone before. But before you know it, they’re back on planet Earth. To your utter astonishment, you learn that they’re done with all the tagging! So you run over and check the data to see if they’re pulling your leg; but no, not only are 1 million galaxies tagged, but the tags are highly accurate as well. If you liked this little story, you’ll be glad to know that it happened in real life. GalaxyZoo, as the project was called, was the flash of brilliance that ultimately launched the entire Zooniverse series.

Screen Shot 2013-03-25 at 3.23.53 PM

No, the second Zooniverse project was not an attempt to pull an Oceans 11 in Las Vegas. One of the most attractive features of many microtasking platforms such as Zooniverse is quality control. Think of slot machines. The only way to win big is by having three matching figures such as the three yellow bells in the picture above (righthand side). Hit the jackpot and the coins will flow. Get two out three matching figures (lefthand side), and some slot machines may toss you a few coins for your efforts. Microtasking uses the same approach. Only if three participants tag the same picture of a galaxy as being a spiral galaxy does that data point count. (Of course, you could decide to change the requirement from 3 volunteers to 5 or even 20 volunteers). This important feature allows micro-tasking initiatives to ensure a high standard of data quality, which may explain why many Zooniverse projects have resulted in major scientific break-throughs over the years.

The Zooniverse team is currently running 15 projects, with several more in the works. One of the most recent Zooniverse deployments, Planet Four, received some 15,000 visitors within the first 60 seconds of being announced on BBC TV. Guess how many weeks it took for volunteers to tag over 2,000,0000 satellite images of Mars? A total of 0.286 weeks, i.e., forty-eight hours! Since then, close to 70,000 volunteers have tagged and traced well over 6 million Martian “dunes.” For their Andromeda Project, digital volunteers classified over 7,500 star clusters per hour, even though there was no media or press announce-ment—just one newsletter sent to volunteers. Zooniverse de-ployments also involve tagging earth-based pictures (in contrast to telescope imagery). Take this Serengeti Snapshot deployment, which invited volunteers to classify animals using photographs taken by 225 motion-sensor cameras in Tanzania’s Serengeti National Park. Volunteers swarmed this project to the point that there are no longer any pictures left to tag! So Zooniverse is eagerly waiting for new images to be taken in Serengeti and sent over.

Screen Shot 2013-03-23 at 7.49.56 PM

One of my favorite Zooniverse features is Talk, an online discussion tool used for all projects to provide a real-time interface for volunteers and coordinators, which also facilitates the rapid discovery of important features. This also allows for socializing, which I’ve found to be particularly important with digital humanitarian deployments (such as these). One other major advantage of citizen science platforms like Zooniverse is that they are very easy to use and therefore do not require extensive prior-training (think slot machines). Plus, participants get to learn about new fields of science in the process. So all in all, Zooniverse makes for a great date, which is why I recently reached out to the team behind this citizen science wizardry. Would they be interested in going out (on a limb) to explore some humanitarian (and development) use cases? “Why yes!” they said.

Microtasking platforms have already been used in disaster response, such as MapMill during Hurricane SandyTomnod during the Somali Crisis and CrowdCrafting during Typhoon Pablo. So teaming up with Zooniverse makes a whole lot of sense. Their microtasking software is the most scalable one I’ve come across yet, it is open source and their 800,000 volunteer user-base is simply unparalleled. If Zooniverse volunteers can classify 2 million satellite images of Mars in 48 hours, then surely they can do the same for satellite images of disaster-affected areas on Earth. Volunteers responding to Sandy created some 80,000 assessments of infrastructure damage during the first 48 hours alone. It would have taken Zooniverse just over an hour. Of course, the fact that the hurricane affected New York City and the East Coast meant that many US-based volunteers rallied to the cause, which may explain why it only took 20 minutes to tag the first batch of 400 pictures. What if the hurricane had hit a Caribbean instead? Would the surge of volunteers may have been as high? Might Zooniverse’s 800,000+ standby volunteers also be an asset in this respect?

Screen Shot 2013-03-23 at 7.42.22 PM

Clearly, there is huge potential here, and not only vis-a-vis humanitarian use-cases but development one as well. This is precisely why I’ve already organized and coordinated a number of calls with Zooniverse and various humanitarian and development organizations. As I’ve been telling my colleagues at the United Nations, World Bank and Humanitarian OpenStreetMap, Zooniverse is the Ferrari of Microtasking, so it would be such a big shame if we didn’t take it out for a spin… you know, just a quick test-drive through the rugged terrains of humanitarian response, disaster preparedness and international development. 

bio

Postscript: As some iRevolution readers may know, I am also collaborating with the outstanding team at  CrowdCrafting, who have also developed a free & open-source microtasking platform for citizen science projects (also for disaster response here). I see Zooniverse and CrowCrafting as highly syner-gistic and complementary. Because CrowdCrafting is still in early stages, they fill a very important gap found at the long tail. In contrast, Zooniverse has been already been around for half-a-decade and can caters to very high volume and high profile citizen science projects. This explains why we’ll all be getting on a call in the very near future. 

A Research Framework for Next Generation Humanitarian Technology and Innovation

Humanitarian donors and organizations are increasingly championing innovation and the use of new technologies for humanitarian response. DfID, for example, is committed to using “innovative techniques and technologies more routinely in humanitarian response” (2011). In a more recent strategy paper, DfID confirmed that it would “continue to invest in new technologies” (2012). ALNAP’s important report on “The State of the Humanitarian System” documents the shift towards greater innovation, “with new funds and mechanisms designed to study and support innovation in humanitarian programming” (2012). A forthcoming land-mark study by OCHA makes the strongest case yet for the use and early adoption of new technologies for humanitarian response (2013).

picme8

These strategic policy documents are game-changers and pivotal to ushering in the next wave of humanitarian technology and innovation. That said, the reports are limited by the very fact that the authors are humanitarian professionals and thus not necessarily familiar with the field of advanced computing. The purpose of this post is therefore to set out a more detailed research framework for next generation humanitarian technology and innovation—one with a strong focus on information systems for crisis response and management.

In 2010, I wrote this piece on “The Humanitarian-Technology Divide and What To Do About It.” This divide became increasingly clear to me when I co-founded and co-directed the Harvard Humanitarian Initiative’s (HHI) Program on Crisis Mapping & Early Warning (2007-2009). So I co-founded the annual Inter-national CrisisMappers Conference series in 2009 and have continued to co-organize this unique, cross-disciplinary forum on humanitarian technology. The CrisisMappers Network also plays an important role in bridging the humanitarian and technology divide. My decision to join Ushahidi as Director of Crisis Mapping (2009-2012) was a strategic move to continue bridging the divide—and to do so from the technology side this time.

The same is true of my move to the Qatar Computing Research Institute (QCRI) at the Qatar Foundation. My experience at Ushahidi made me realize that serious expertise in Data Science is required to tackle the major challenges appearing on the horizon of humanitarian technology. Indeed, the key words missing from the DfID, ALNAP and OCHA innovation reports include: Data Science, Big Data Analytics, Artificial Intelligence, Machine Learning, Machine Translation and Human Computing. This current divide between the humanitarian and data science space needs to be bridged, which is precisely why I joined the Qatar Com-puting Research Institute as Director of Innovation; to develop and prototype the next generation of humanitarian technologies by working directly with experts in Data Science and Advanced Computing.

bridgetech

My efforts to bridge these communities also explains why I am co-organizing this year’s Workshop on “Social Web for Disaster Management” at the 2013 World Wide Web conference (WWW13). The WWW event series is one of the most prestigious conferences in the field of Advanced Computing. I have found that experts in this field are very interested and highly motivated to work on humanitarian technology challenges and crisis computing problems. As one of them recently told me: “We simply don’t know what projects or questions to prioritize or work on. We want questions, preferably hard questions, please!”

Yet the humanitarian innovation and technology reports cited above overlook the field of advanced computing. Their policy recommendations vis-a-vis future information systems for crisis response and management are vague at best. Yet one of the major challenges that the humanitarian sector faces is the rise of Big (Crisis) Data. I have already discussed this here, here and here, for example. The humanitarian community is woefully unprepared to deal with this tidal wave of user-generated crisis information. There are already more mobile phone sub-scriptions than people in 100+ countries. And fully 50% of the world’s population in developing countries will be using the Internet within the next 20 months—the current figure is 24%. Meanwhile, close to 250 million people were affected by disasters in 2010 alone. Since then, the number of new mobile phone subscrip-tions has increased by well over one billion, which means that disaster-affected communities today are increasingly likely to be digital communities as well.

In the Philippines, a country highly prone to “natural” disasters, 92% of Filipinos who access the web use Facebook. In early 2012, Filipinos sent an average of 2 billion text messages every day. When disaster strikes, some of these messages will contain information critical for situational awareness & rapid needs assess-ment. The innovation reports by DfID, ALNAP and OCHA emphasize time and time again that listening to local communities is a humanitarian imperative. As DfID notes, “there is a strong need to systematically involve beneficiaries in the collection and use of data to inform decision making. Currently the people directly affected by crises do not routinely have a voice, which makes it difficult for their needs be effectively addressed” (2012). But how exactly should we listen to millions of voices at once, let alone manage, verify and respond to these voices with potentially life-saving information? Over 20 million tweets were posted during Hurricane Sandy. In Japan, over half-a-million new users joined Twitter the day after the 2011 Earthquake. More than 177 million tweets about the disaster were posted that same day, i.e., 2,000 tweets per second on average.

Screen Shot 2013-03-20 at 1.42.25 PM

Of course, the volume and velocity of crisis information will vary from country to country and disaster to disaster. But the majority of humanitarian organizations do not have the technologies in place to handle smaller tidal waves either. Take the case of the recent Typhoon in the Philippines, for example. OCHA activated the Digital Humanitarian Network (DHN) to ask them to carry out a rapid damage assessment by analyzing the 20,000 tweets posted during the first 48 hours of Typhoon Pablo. In fact, one of the main reasons digital volunteer networks like the DHN and the Standby Volunteer Task Force (SBTF) exist is to provide humanitarian organizations with this kind of skilled surge capacity. But analyzing 20,000 tweets in 12 hours (mostly manually) is one thing, analyzing 20 million requires more than a few hundred dedicated volunteers. What’s more, we do not have the luxury of having months to carry out this analysis. Access to information is as important as access to food; and like food, information has a sell-by date.

We clearly need a research agenda to guide the development of next generation humanitarian technology. One such framework is proposed her. The Big (Crisis) Data challenge is composed of (at least) two major problems: (1) finding the needle in the haystack; (2) assessing the accuracy of that needle. In other words, identifying the signal in the noise and determining whether that signal is accurate. Both of these challenges are exacerbated by serious time con-straints. There are (at least) two ways too manage the Big Data challenge in real or near real-time: Human Computing and Artificial Intelligence. We know about these solutions because they have already been developed and used by other sectors and disciplines for several years now. In other words, our information problems are hardly as unique as we might think. Hence the importance of bridging the humanitarian and data science communities.

In sum, the Big Crisis Data challenge can be addressed using Human Computing (HC) and/or Artificial Intelligence (AI). Human Computing includes crowd-sourcing and microtasking. AI includes natural language processing and machine learning. A framework for next generation humanitarian technology and inno-vation must thus promote Research and Development (R&D) that apply these methodologies for humanitarian response. For example, Verily is a project that leverages HC for the verification of crowdsourced social media content generated during crises. In contrast, this here is an example of an AI approach to verification. The Standby Volunteer Task Force (SBTF) has used HC (micro-tasking) to analyze satellite imagery (Big Data) for humanitarian response. An-other novel HC approach to managing Big Data is the use of gaming, something called Playsourcing. AI for Disaster Response (AIDR) is an example of AI applied to humanitarian response. In many ways, though, AIDR combines AI with Human Computing, as does MatchApp. Such hybrid solutions should also be promoted   as part of the R&D framework on next generation humanitarian technology. 

There is of course more to humanitarian technology than information manage-ment alone. Related is the topic of Data Visualization, for example. There are also exciting innovations and developments in the use of drones or Unmanned Aerial Vehicles (UAVs), meshed mobile communication networks, hyper low-cost satellites, etc.. I am particularly interested in each of these areas will continue to blog about them. In the meantime, I very much welcome feedback on this post’s proposed research framework for humanitarian technology and innovation.

 bio

Update: Twitter Dashboard for Disaster Response

Project name: Artificial Intelligence for Disaster Response (AIDR). For a more recent update, please click here.

My Crisis Computing Team and I at QCRI have been working hard on the Twitter Dashboard for Disaster Response. We first announced the project on iRevolution last year. The experimental research we’ve carried out since has been particularly insightful vis-a-vis the opportunities and challenges of building such a Dashboard. We’re now using the findings from our empirical research to inform the next phase of the project—namely building the prototype for our humanitarian colleagues to experiment with so we can iterate and improve the platform as we move forward.

KnightDash

Manually processing disaster tweets is becoming increasingly difficult and unrealistic. Over 20 million tweets were posted during Hurricane Sandy, for example. This is the main problem that our Twitter Dashboard aims to solve. There are two ways to manage this challenge of Big (Crisis) Data: Advanced Computing and Human Computation. The former entails the use of machine learning algorithms to automatically tag tweets while the latter involves the use of microtasking, which I often refer to as Smart Crowdsourcing. Our Twitter Dashboard seeks to combine the best of both methodologies.

On the Advanced Computing side, we’ve developed a number of classifiers that automatically identify tweets that:

  • Contain informative content (in contrast to personal messages or information unhelpful for disaster response);
  • Are posted by eye-witnesses (as opposed to 2nd-hand reporting);
  • Include pictures, video footage, mentions from TV/radio
  • Report casualties and infrastructure damage;
  • Relate to people missing, seen and/or found;
  • Communicate caution and advice;
  • Call for help and important needs;
  • Offer help and support.

These classifiers are developed using state-of-the-art machine learning tech-niques. This simply means that we take a Twitter dataset of a disaster, say Hurricane Sandy, and develop clear definitions for “Informative Content,” “Eye-witness accounts,” etc. We use this classification system to tag a random sample of tweets from the dataset (usually 100+ tweets). We then “teach” algorithms to find these different topics in the rest of the dataset. We tweak said algorithms to make them as accurate as possible; much like training a dog new tricks like go-fetch (wink).

fetchball

We’ve found from this research that the classifiers are quite accurate but sensitive to the type of disaster being analyzed and also the country in which said disaster occurs. For example, a set of classifiers developed from tweets posted during Hurricane Sandy tend to be less accurate when applied to tweets posted for New Zealand’s earthquake. Each classifier is developed based on tweets posted during a specific disaster. In other words, while the classifiers can be highly accurate (i.e., tweets are correctly tagged as being damage-related, for example), they only tend to be accurate for the type of disaster they’ve been trained for, e.g., weather-related disasters (tornadoes), earth-related (earth-quakes) and water-related (floods).

So we’ve been busy trying to collect as many Twitter datasets of different disasters as possible, which has been particularly challenging and seriously time-consuming given Twitter’s highly restrictive Terms of Service, which prevents the direct sharing of Twitter datasets—even for humanitarian purposes. This means we’ve had to spend a considerable amount of time re-creating Twitter datasets for past disasters; datasets that other research groups and academics have already crawled and collected. Thank you, Twitter. Clearly, we can’t collect every single tweet for every disaster that has occurred over the past five years or we’ll never get to actually developing the Dashboard.

That said, some of the most interesting Twitter disaster datasets are of recent (and indeed future) disasters. Truth be told, tweets were still largely US-centric before 2010. But the international coverage has since increased, along with the number of new Twitter users, which almost doubled in 2012 alone (more neat stats here). This in part explains why more and more Twitter users actively tweet during disasters. There is also a demonstration effect. That is, the international media coverage of social media use during Hurricane Sandy, for example, is likely to prompt citizens in other countries to replicate this kind of pro-active social media use when disaster knocks on their doors.

So where does this leave us vis-a-vis the Twitter Dashboard for Disaster Response? Simply that a hybrid approach is necessary (see TEDx talk above). That is, the Dashboard we’re developing will have a number of pre-developed classifiers based on as many datasets as we can get our hands on (categorized by disaster type). In addition to that, the dashboard will also allow users to create their own classifiers on the fly by leveraging human computation. They’ll also be able to microtask the creation of new classifiers.

In other words, what they’ll do is this:

  • Enter a search query on the dashboard, e.g., #Sandy.
  • Click on “Create Classifier” for #Sandy.
  • Create a label for the new classifier, e.g., “Animal Rescue”.
  • Tag 50+ #Sandy tweets that convey content about animal rescue.
  • Click “Run Animal Rescue Classifier” on new incoming tweets.

The new classifier will then automatically tag incoming tweets. Of course, the classifier won’t get it completely right. But the beauty here is that the user can “teach” the classifier not to make the same mistakes, which means the classifier continues to learn and improve over time. On the geo-location side of things, it is indeed true that only ~3% of all tweets are geotagged by users. But this figure can be boosted to 30% using full-text geo-coding (as was done the TwitterBeat project). Some believe this figure can be doubled (towards 75%) by applying Google Translate to the full-text geo-coding. The remaining users can be queried via Twitter for their location and that of the events they are reporting.

So that’s where we’re at with the project. Ultimately, we envision these classifiers to be like individual apps that can be used/created, dragged and dropped on an intuitive widget-like dashboard with various data visualization options. As noted in my previous post, everything we’re building will be freely accessible and open source. And of course we hope to include classifiers for other languages beyond English, such as Arabic, Spanish and French. Again, however, this is purely experimental research for the time being; we want to be crystal clear about this in order to manage expectations. There is still much work to be done.

In the meantime, please feel free to get in touch if you have disaster datasets you can contribute to these efforts (we promise not to tell Twitter). If you’ve developed classifiers that you think could be used for disaster response and you’re willing to share them, please also get in touch. If you’d like to join this project and have the required skill sets, then get in touch, we may be able to hire you! Finally, if you’re an interested end-user or want to share some thoughts and suggestions as we embark on this next phase of the project, please do also get in touch. Thank you!

bio

Digital Humanitarian Response: Moving from Crowdsourcing to Microtasking

A central component of digital humanitarian response is the real-time monitor-ing, tagging and geo-location of relevant reports published on mainstream and social media. This has typically been a highly manual and time-consuming process, which explains why dozens if not hundreds of digital volunteers are often needed to power digital humanitarian response efforts. To coordinate these efforts, volunteers typically work off Google Spreadsheets which, needless to say, is hardly the most efficient, scalable or enjoyable interface to work on for digital humanitarian response.

complicated128

The challenge here is one of design. Google Spreadsheets was simply not de-signed to facilitate real-time monitoring, tagging and geo-location tasks by hundreds of digital volunteers collaborating synchronously and asynchronously across multiple time zones. The use of Google Spreadsheets not only requires up-front training of volunteers but also oversight and management. Perhaps the most problematic feature of Google Spreadsheets is the interface. Who wants to spend hours staring at cells, rows and columns? It is high time we take a more volunteer-centered design approach to digital humanitarian response. It is our responsibility to reduce the “friction” and make it as easy, pleasant and re-warding as possible for digital volunteers to share their time for the better good. While some deride the rise of “single-click activism,” we have to make it as easy as a double-click-of-the-mouse to support digital humanitarian efforts.

This explains why I have been actively collaborating with my colleagues behind the free & open-source micro-tasking platform, PyBossa. I often describe micro-tasking as “smart crowdsourcing”. Micro-tasking is simply the process of taking a large task and breaking it down into a series of smaller tasks. Take the tagging and geo-location of disaster tweets, for example. Instead of using Google Spread-sheets, tweets with designated hashtags can be imported directly into PyBossa where digital volunteers can tag and geo-locate said tweets as needed. As soon as they are processed, these tweets can be pushed to a live map or database right away for further analysis.

Screen Shot 2012-12-18 at 5.00.39 PM

The Standby Volunteer Task Force (SBTF) used PyBossa in the digital disaster response to Typhoon Pablo in the Philippines. In the above example, a volunteer goes to the PyBossa website and is presented with the next tweet. In this case: “Surigao del Sur: relief good infant needs #pabloPH [Link] #ReliefPH.” If a tweet includes location information, e.g., “Surigao del Sur,” a digital volunteer can simply copy & paste that information into the search box or  pinpoint the location in question directly on the map to generate the GPS coordinates. Click on the screenshot above to zoom in.

The PyBossa platform presents a number of important advantages when it comes to digital humanitarian response. One advantage is the user-friendly tutorial feature that introduces new volunteers to the task at hand. Furthermore, no prior experience or additional training is required and the interface itself can be made available in multiple languages. Another advantage is the built-in quality control mechanism. For example, one can very easily customize the platform such that every tweet is processed by 2 or 3 different volunteers. Why would we want to do this? To ensure consensus on what the right answers are when processing a tweet. For example, if three individual volunteers each tag a tweet as having a link that points to a picture of the damage caused by Typhoon Pablo, then we may find this to be more reliable than if only one volunteer tags a tweet as such. One additional advantage of PyBossa is that having 100 or 10,000 volunteers use the platform doesn’t require additional management and oversight—unlike the use of Google Spreadsheets.

There are many more advantages of using PyBossa, which is why my SBTF colleagues and I are collaborating with the PyBossa team with the ultimate aim of customizing a standby platform specifically for digital humanitarian response purposes. As a first step, however, we are working together to customize a PyBossa instance for the upcoming elections in Kenya since the SBTF was activated by Ushahidi to support the election monitoring efforts. The plan is to microtask the processing of reports submitted to Ushahidi in order to significantly accelerate and scale the live mapping process. Stay tuned to iRevolution for updates on this very novel initiative.

crowdflower-crowdsourcing-site

The SBTF also made use of CrowdFlower during the response to Typhoon Pablo. Like PyBossa, CrowdFlower is a micro-tasking platform but one developed by a for-profit company and hence primarily geared towards paying workers to complete tasks. While my focus vis-a-vis digital humanitarian response has chiefly been on (integrating) automated and volunteer-driven micro-tasking solutions, I believe that paid micro-tasking platforms also have a critical role to play in our evolving digital humanitarian ecosystem. Why? CrowdFlower has an unrivaled global workforce of more than 2 million contributors along with rigor-ous quality control mechanisms.

While this solution may not scale significanlty given the costs, I’m hoping that CrowdFlower will offer the Digital Humanitarian Network (DHN) generous discounts moving forward. Either way, identifying what kinds of tasks are best completed by paid workers versus motivated volunteers is a questions we must answer to improve our digital humanitarian workflows. This explains why I plan to collaborate with CrowdFlower directly to set up a standby platform for use by members of the Digital Humanitarian Network.

There’s one major catch with all microtasking platforms, however. Without well-designed gamification features, these tools are likely to have a short shelf-life. This is true of any citizen-science project and certainly relevant to digital human-itarian response as well, which explains why I’m a big, big fan of Zooniverse. If there’s a model to follow, a holy grail to seek out, then this is it. Until we master or better yet partner with the talented folks at Zooniverse, we’ll be playing catch-up for years to come. I will do my very best to make sure that doesn’t happen.

Help Tag Tweets from Typhoon Pablo to Support UN Disaster Response!

Update: Summary of digital humanitarian response efforts available here.

The United Nations Office for the Coordination of Humanitarian Affairs (OCHA) has just activated the Digital Humanitarian Network (DHN) to request support in response to Typhoo Pablo. They also need your help! Read on!

pablopic

The UN has asked for pictures and videos of the damage to be collected from tweets posted over the past 48 hours. These pictures/videos need to be geo-tagged if at all possible, and time-stamped. The Standby Volunteer Task Force (SBTF) and Humanity Road (HR), both members of Digital Humanitarians, are thus collaborating to provide the UN with the requested data, which needs to be submitted by today 10pm 11pm New York time, 5am Geneva time tomorrow. Given this very short turn around time, we only have 10 hours (!), the Digital Humani-tarian Network needs your help!

Pybossa Philippines

The SBTF has partnered with colleagues at PyBossa to launch this very useful microtasking platform for you to assist the UN in these efforts. No prior experience necessary. Click here or on the display above to see just how easy it is to support the disaster relief operations on the ground.

A very big thanks to Daniel Lombraña González from PyBossa for turning this around at such short notice! If you have any questions about this project or with respect to volunteering, please feel free to add a comment to this blog post below. Even if you only have time tag one tweet, it counts! Please help!

Some background information on this project is available here.

What Percentage of Tweets Generated During a Crisis Are Relevant for Humanitarian Response?

More than half-a-million tweets were generated during the first three days of Hurricane Sandy and well over 400,000 pictures were shared via Instagram. Last year, over one million tweets were generated every five minutes on the day that Japan was struck by a devastating earthquake and tsunami. Humanitarian organi-zations are ill-equipped to manage this volume and velocity of information. In fact, the lack of analysis of this “Big Data” has spawned all kinds of suppositions about the perceived value—or lack thereof—that social media holds for emer-gency response operations. So just what percentage of tweets are relevant for humanitarian response?

One of the very few rigorous and data-driven studies that addresses this question is Dr. Sarah Vieweg‘s 2012 doctoral dissertation on “Situational Awareness in Mass Emergency: Behavioral and Linguistic Analysis of Disaster Tweets.” After manually analyzing four distinct disaster datasets, Vieweg finds that only 8% to 20% of tweets generated during a crisis provide situational awareness. This implies that the vast majority of tweets generated during a crisis have zero added value vis-à-vis humanitarian response. So critics have good reason to be skeptical about the value of social media for disaster response.

At the same time, however, even if we take Vieweg’s lower bound estimate, 8%, this means that over 40,000 tweets generated during the first 72 hours of Hurricane Sandy may very well have provided increased situational awareness. In the case of Japan, more than 100,000 tweets generated every 5 minutes may have provided additional situational awareness. This volume of relevant infor-mation is much higher and more real-time than the information available to humanitarian responders via traditional channels.

Furthermore, preliminary research by QCRI’s Crisis Computing Team show that 55.8% of 206,764 tweets generated during a major disaster last year were “Informative,” versus 22% that were “Personal” in nature. In addition, 19% of all tweets represented “Eye-Witness” accounts, 17.4% related to information about “Casualty/Damage,” 37.3% related to “Caution/Advice,” while 16.6% related to “Donations/Other Offers.” Incidentally, the tweets were automatically classified using algorithms developed by QCRI. The accuracy rate of these ranged from 75%-81% for the “Informative Classifier,” for example. A hybrid platform could then push those tweets that are inaccurately classified to a micro-tasking platform for manual classification, if need be.

This research at QCRI constitutes the first phase of our work to develop a Twitter Dashboard for the Humanitarian Cluster System, which you can read more about in this blog post. We are in the process of analyzing several other twitter datasets in order to refine our automatic classifiers. I’ll be sure to share our preliminary observations and final analysis via this blog.

Innovation and the State of the Humanitarian System

Published by ALNAP, the 2012 State of the Humanitarian System report is an important evaluation of the humanitarian community’s efforts over the past two years. “I commend this report to all those responsible for planning and delivering life saving aid around the world,” writes UN Under-Secretary General Valerie Amos in the Preface. “If we are going to improve international humanitarian response we all need to pay attention to the areas of action highlighted in the report.” Below are some of the highlighted areas from the 100+ page evaluation that are ripe for innovative interventions.

Accessing Those in Need

Operational access to populations in need has not improved. Access problems continue and are primarily political or security-related rather than logistical. Indeed, “UN security restrictions often place sever limits on the range of UN-led assessments,” which means that “coverage often can be compromised.” This means that “access constraints in some contexts continue to inhibit an accurate assessment of need. Up to 60% of South Sudan is inaccessible for parts of the year. As a result, critical data, including mortality and morbidity, remain unavailable. Data on nutrition, for example, exist in only 25 of 79 countries where humanitarian partners have conducted surveys.”

Could satellite and/or areal imagery be used to measure indirect proxies? This would certainly be rather imperfect but perhaps better than nothing? Could crowdseeding be used?

Information and Communication Technologies

“The use of mobile devices and networks is becoming increasingly important, both to deliver cash and for communication with aid recipients.” Some humanitarian organizations are also “experimenting with different types of communication tools, for different uses and in different contexts. Examples include: offering emergency information, collecting information for needs assessments or for monitoring and evaluation, surveying individuals, or obtaining information on remote populations from an appointed individual at the community level.”

“Across a variety of interventions, mobile phone technology is seen as having great potential to increase efficiency. For example, […] the governments of Japan and Thailand used SMS and Twitter to spread messages about the disaster response.” Naturally, in some contexts, “traditional means like radios and call centers are most appropriate.”

In any case, “thanks to new technologies and initiatives to advance commu-nications with affected populations, the voices of aid recipients began, in a small way, to be heard.” Obviously, heard and understood are not the same thing–not to mention heard, understood and responded to. Moreover, as disaster affected communities become increasingly “digital” thanks to the spread of mobile phones, the number of voices will increase significantly. The humanitarian system is largely (if not completely) unprepared to handle this increase in volume (Big Data).

Consulting Local Recipients

Humanitarian organizations have “failed to consult with recipients […] or to use their input in programming.” Indeed, disaster-affected communities are “rarely given opportunities to assess the impact of interventions and to comment on performance.” In fact, “they are rarely treated as end-users of the service.” Aid recipients also report that “the aid they received did not address their ‘most important needs at the time.'” While some field-level accountability mechanisms do exist, they were typically duplicative and very project oriented. To this end, “it might be more efficient and effective to have more coordination between agencies regarding accountability approaches.”

While the ALNAP report suggests that these shortcomings could “be addressed in the near future by technical advances in methods of needs assessment,” the challenge here is not simply a technical one. Still, there are important efforts underway to address these issues.

Improving Needs Assessments

The Inter-Agency Standing Committee’s (IASC) Needs Assessment Task Force (NAFT) and the International NGO-led Assessment Capacities Project (ACAPS) are two such exempts of progress. OCHA serves as the secretariat for the NAFT through its Assessment and Classification of Emergencies (ACE) Team. ACAPS, which is a consortium of three international NGOs (X, Y and Z) and a member of NATF, aims to “strengthen the capacity of the humanitarian sector in multi-sectoral needs assessment.” ACAPS is considered to have “brought sound technical processes and practical guidelines to common needs assessment.” Note that both ACAPS and ACE have recently reached out to the Digital Humanitarian Network (DHNetwork) to partner on needs-assessment projects in South Sudan and the DRC.

Another promising project is the Humanitarian Emergency Settings Perceived Needs Scale (HESPER). This join initiative between WHO and King’s College London is designed to rapidly assess the “perceived needs of affected populations and allow their views to be taken into consideration. The project specifically aims to fill the gap between population-based ‘objective’ indicators […] and/or qualitative data based on convenience samples such as focus groups or key informant interviews.” On this note, some NGOs argue that “overall assessment methodologies should focus far more at the community (not individual) level, including an assessment of local capacities […],” since “far too often international aid actors assume there is no local capacity.”

Early Warning and Response

An evaluation of the response in the Horn of Africa found “significant disconnects between early warning systems and response, and between technical assessments and decision-makers.” According to ALNAP, “most commentators agree that the early warning worked, but there was a failure to act on it.” This disconnect is a concern I voiced back in 2009 when UN Global Pulse was first launched. To be sure, real-time information does not turn an organization into a real-time organization. Not surprisingly, most of the aid recipients surveyed for the ALNAP report felt that “the foremost way in which humanitarian organizations could improve would be to: ‘be faster to start delivering aid.'” Interestingly, “this stands in contrast to the survey responses of international aid practitioners who gave fairly high marks to themselves for timeliness […].”

Rapid and Skilled Humanitarians

While the humanitarian system’s surge capacity for the deployment of humanitarian personnel has improved, “findings also suggest that the adequate scale-up of appropriately skilled […] staff is still perceived as problematic for both operations and coordination.” Other evaluations “consistently show that staff in NGOs, UN agencies and clusters were perceived to be ill prepared in terms of basic language and context training in a significant number of contexts.” In addition, failures in knowledge and understanding of humanitarian principles were also raised. Furthermore, evaluations of mega-disasters “predictably note influxes or relatively new staff with limited experience.” Several evaluations noted that the lack of “contextual knowledge caused a net decrease in impact.” This lend one senior manager noted:

“If you don’t understand the political, ethnic, tribal contexts it is difficult to be effective… If I had my way I’d first recruit 20 anthropologists and political scientists to help us work out what’s going on in these settings.”

Monitoring and Evaluation

ALNAP found that monitoring and evaluation continues to be a significant shortcoming in the humanitarian system. “Evaluations have made mixed progress, but affected states are still notably absent from evaluating their own response or participating in joint evaluations with counterparts.” Moreover, while there have been important efforts by CDAC and others to “improve accountability to, and communication with, aid recipients,” there is “less evidence to suggest that this new resource of ground-level information is being used strategically to improve humanitarian interventions.” To this end, “relatively few evaluations focus on the views of aid recipients […].” In one case, “although a system was in place with results-based indicators, there was neither the time nor resources to analyze or use the data.”

The most common reasons cited for failing to meet community expectations include the “inability to meet the full spectrum of need, weak understanding of local context, inability to understand the changing nature of need, inadequate information-gathering techniques or an inflexible response approach.” In addition, preconceived notions of vulnerability have “led to inappropriate interventions.” A major study carried out by Tufts University and cited in the ALNAP report concludes that “humanitarian assistance remains driven by ‘anecdote rather than evidence’ […].” One important exception to this is the Danish Refugee Council’s work in Somalia.

Leadership, Risk and Principles

ALNAP identifies an “alarming evidence of a growing tendency towards risk aversion” and a “stifling culture of compliance.” In addition, adherence to humanitarian principles were found to have weakened as “many humanitarian organizations have willingly compromised a principled approach in their own conduct through close alignment with political and military activities and actors.” Moreover, “responses in highly politicized contexts are viewed as particularly problematic for the retention of humanitarian principles.” Humanitarian professionals who were interviewed by ALNAP for this report “highlighted multiple occasions when agencies failed to maintain an impartial response when under pressure from strong states, such as Pakistan and Sri Lanka.”