Category Archives: Big Data

Artificial Intelligence Powered by Crowdsourcing: The Future of Big Data and Humanitarian Action

There’s no point spewing stunning statistics like this recent one from The Economist, which states that 80% of adults will have access to smartphones before 2020. The volume, velocity and variety of digital data will continue to skyrocket. To paraphrase Douglas Adams, “Big Data is big. You just won’t believe how vastly, hugely, mind-bogglingly big it is.”

WP1

And so, traditional humanitarian organizations have a choice when it comes to battling Big Data. They can either continue business as usual (and lose) or get with the program and adopt Big Data solutions like everyone else. The same goes for Digital Humanitarians. As noted in my new book of the same title, those Digital Humanitarians who cling to crowdsourcing alone as their pièce de résistance will inevitably become the ivy-laden battlefield monuments of 2020.

bookcover

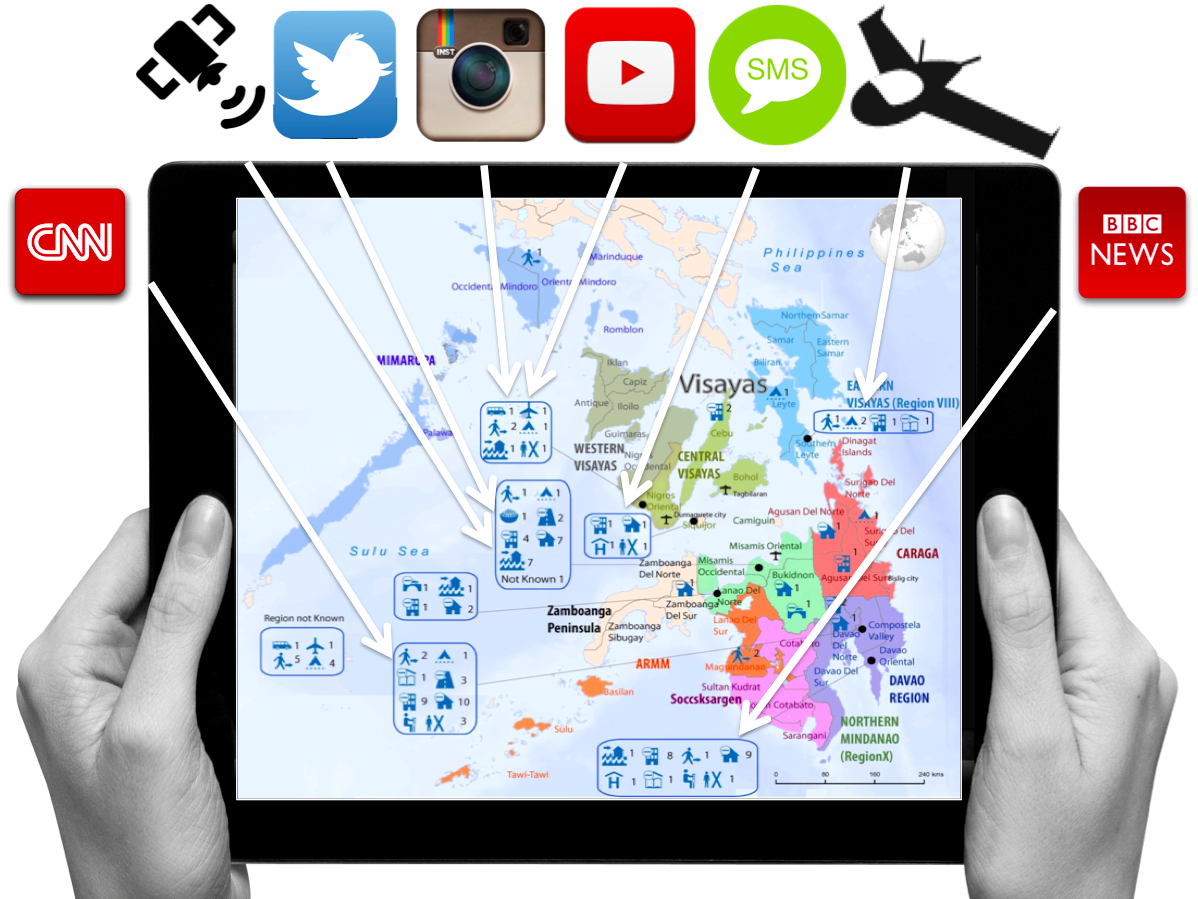
Big Data comprises a variety of data types such as text, imagery and video. Examples of text-based data includes mainstream news articles, tweets and WhatsApp messages. Imagery includes Instagram, professional photographs that accompany news articles, satellite imagery and increasingly aerial imagery as well (captured by UAVs). Television channels, Meerkat and YouTube broadcast videos. Finding relevant, credible and actionable pieces of text, imagery and video in the Big Data generated during major disasters is like looking for a needle in a meadow (haystacks are ridiculously small datasets by comparison).

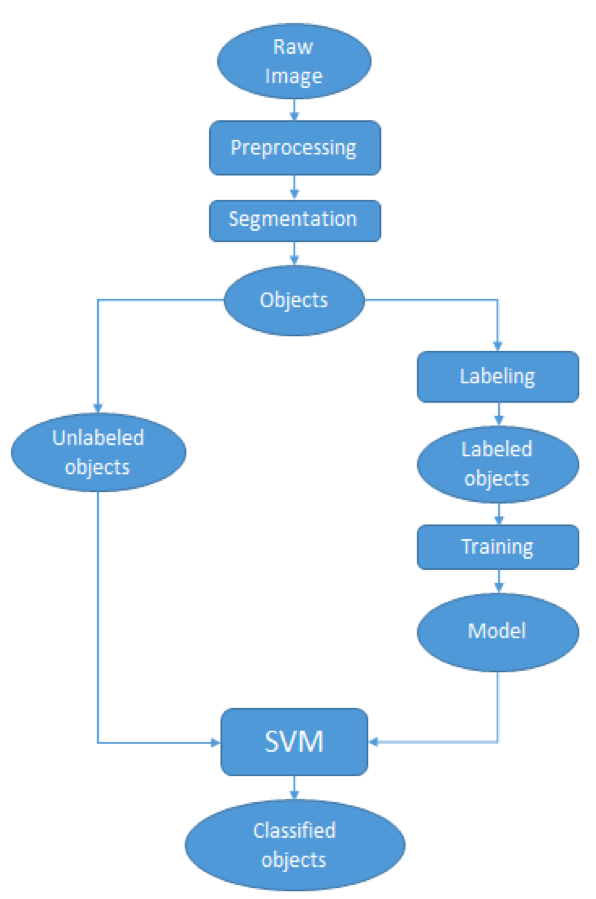
Humanitarian organizations, like many others in different sectors, often find comfort in the notion that their problems are unique. Thankfully, this is rarely true. Not only is the Big Data challenge not unique to the humanitarian space, real solutions to the data deluge have already been developed by groups that humanitarian professionals at worst don’t know exist and at best rarely speak with. These groups are already using Artificial Intelligence (AI) and some form of human input to make sense of Big Data.

Data digital flow

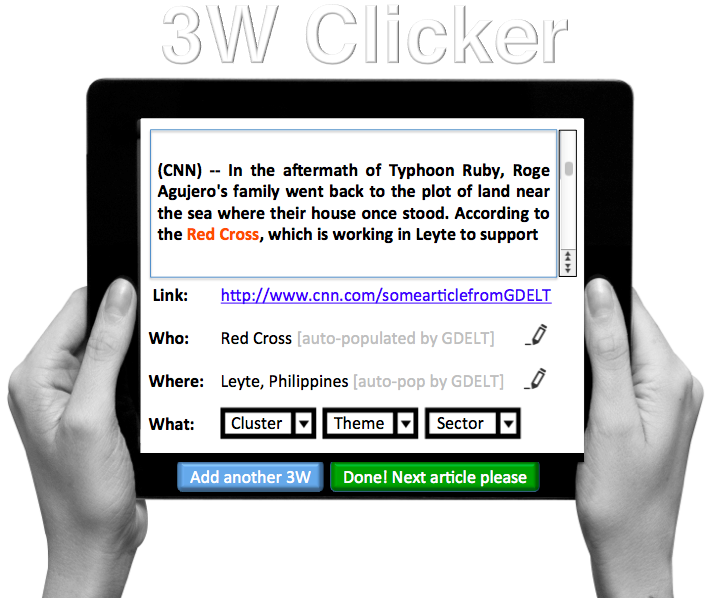
How does it work? And why do you still need some human input if AI is already in play? The human input, which can be via crowdsourcing or a few individuals is needed to train the AI engine, which uses a technique from AI called machine learning to learn from the human(s). Take AIDR, for example. This experimental solution, which stands for Artificial Intelligence for Disaster Response, uses AI powered by crowdsourcing to automatically identify relevant tweets and text messages in an exploding meadow of digital data. The crowd tags tweets and messages they find relevant and the AI engine learns to recognize the relevance patterns in real-time, allowing AIDR to automatically identify future tweets and messages.

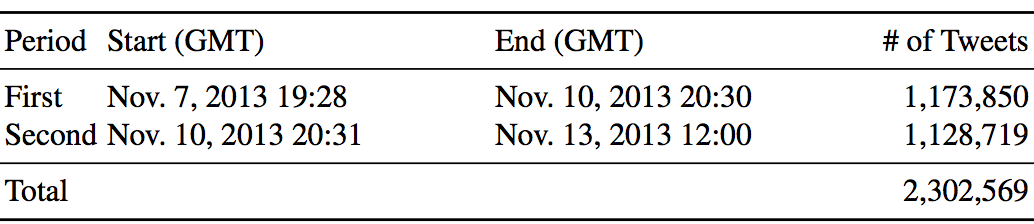
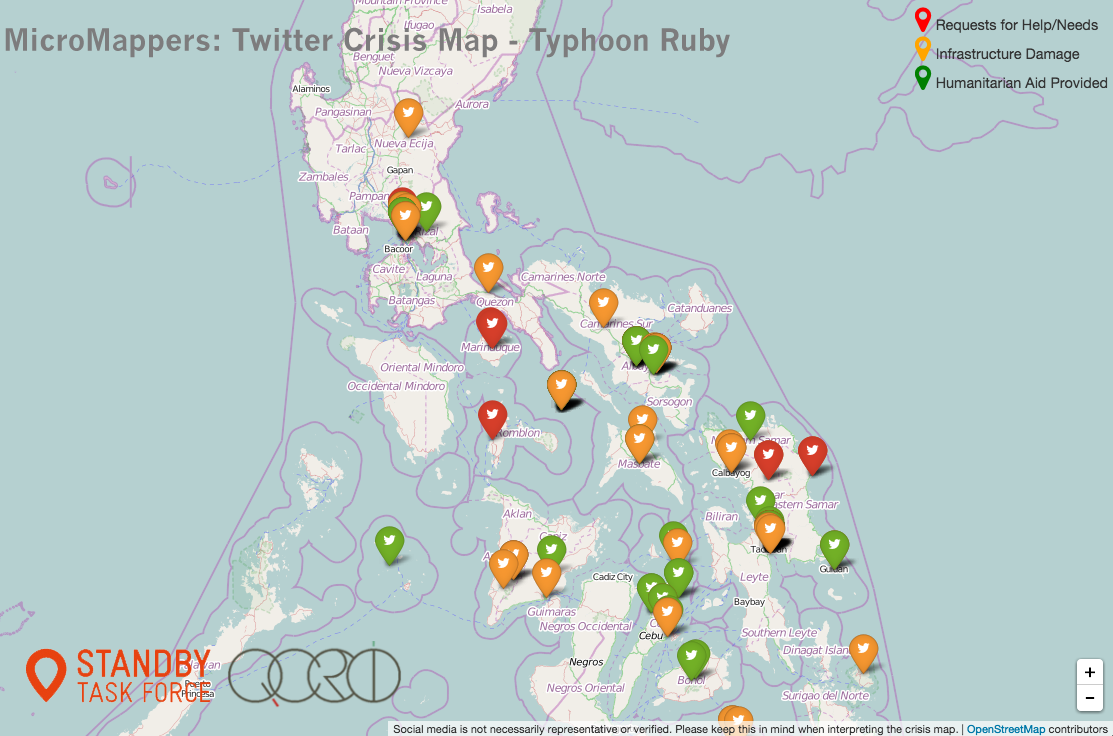
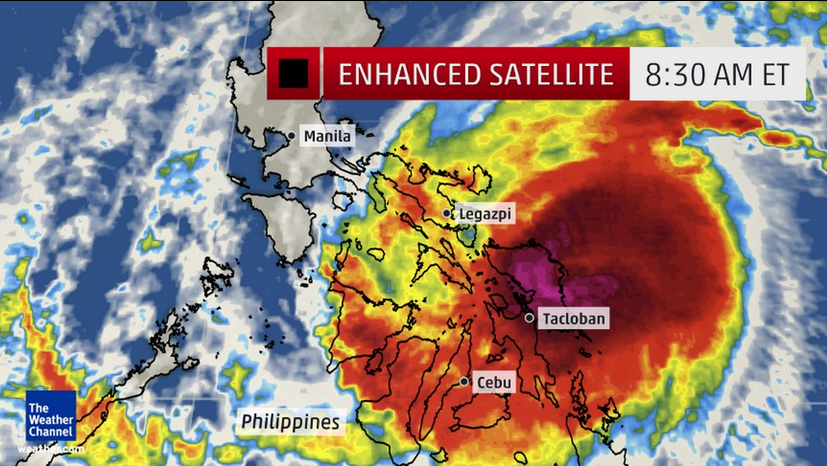
As far as we know, AIDR is the only Big Data solution out there that combines crowdsourcing with real-time machine learning for disaster response. Why do we use crowdsourcing to train the AI engine? Because speed is of the essence in disasters. You need a crowd of Digital Humanitarians to quickly tag as many tweets/messages as possible so that AIDR can learn as fast as possible. Incidentally, once you’ve created an algorithm that accurately detects tweets relaying urgent needs after a Typhoon in the Philippines, you can use that same algorithm again when the next Typhoon hits (no crowd needed).

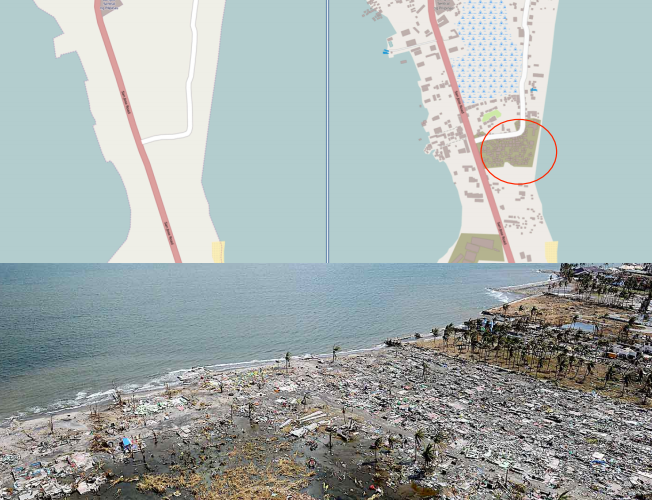
What about pictures? After all, pictures are worth a thousand words. Is it possible to combine artificial intelligence with human input to automatically identify pictures that show infrastructure damage? Thanks to recent break-throughs in computer vision, this is indeed possible. Take Metamind, for example, a new startup I just met with in Silicon Valley. Metamind is barely 6 months old but the team has already demonstrated that one can indeed automatically identify a whole host of features in pictures by using artificial intelligence and some initial human input. The key is human input since this is what trains the algorithms. The more human-generated training data you have, the better your algorithms.

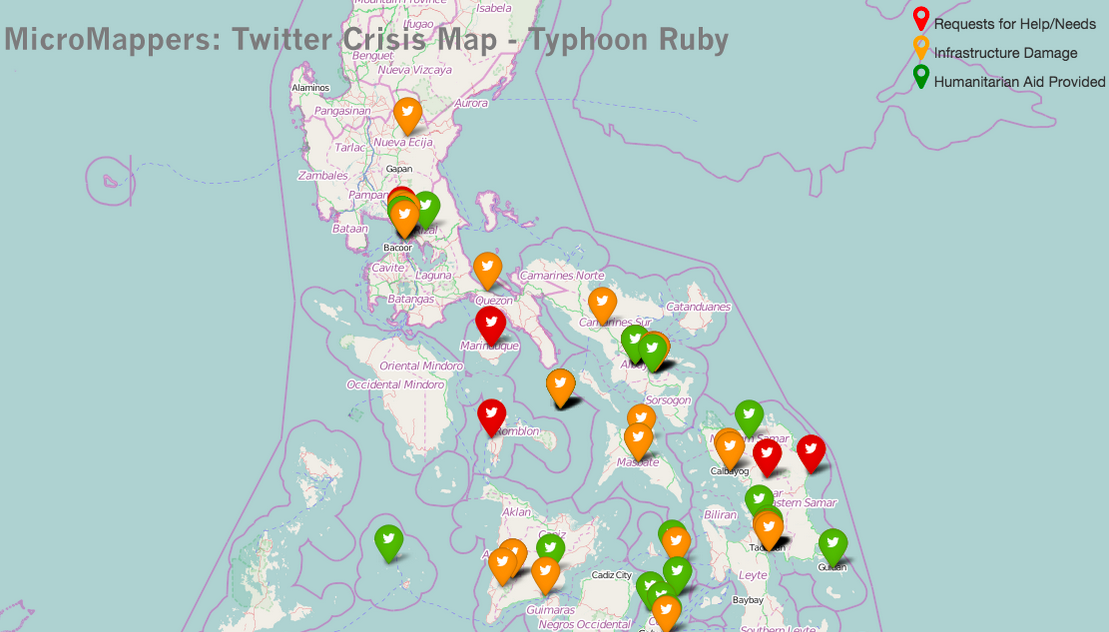
My team and I at QCRI are collaborating with Metamind to create algorithms that can automatically detect infrastructure damage in pictures. The Silicon Valley start-up is convinced that we’ll be able to create a highly accurate algorithms if we have enough training data. This is where MicroMappers comes in. We’re already using MicroMappers to create training data for tweets and text messages (which is what AIDR uses to create algorithms). In addition, we’re already using MicroMappers to tag and map pictures of disaster damage. The missing link—in order to turn this tagged data into algorithms—is Metamind. I’m excited about the prospects, so stay tuned for updates as we plan to start teaching Metamind’s AI engine this month.

Screen Shot 2015-03-16 at 11.45.31 AM

How about videos as a source of Big Data during disasters? I was just in Austin for SXSW 2015 and met up with the CEO of WireWax, a British company that uses—you guessed it—artificial intelligence and human input to automatically detect countless features in videos. Their platform has already been used to automatically find guns and Justin Bieber across millions of videos. Several other groups are also working on feature detection in videos. Colleagues at Carnegie Melon University (CMU), for example, are working on developing algorithms that can detect evidence of gross human rights violations in YouTube videos coming from Syria. They’re currently applying their algorithms on videos of disaster footage, which we recently shared with them, to determine whether infrastructure damage can be automatically detected.

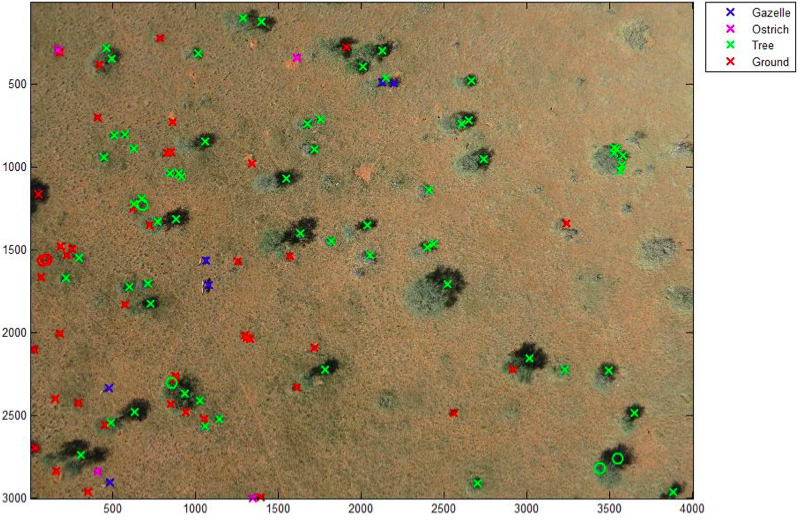
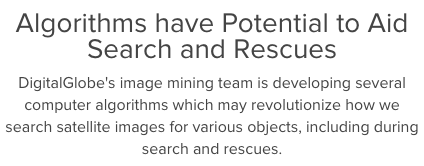
What about satellite & aerial imagery? Well the team driving DigitalGlobe’s Tomnod platform have already been using AI powered by crowdsourcing to automatically identify features of interest in satellite (and now aerial) imagery. My team and I are working on similar solutions with MicroMappers, with the hope of creating real-time machine learning solutions for both satellite and aerial imagery. Unlike Tomnod, the MicroMappers platform is free and open source (and also filters social media, photographs, videos & mainstream news).

Screen Shot 2015-03-16 at 11.43.23 AM

Screen Shot 2015-03-16 at 11.41.21 AM

So there you have it. The future of humanitarian information systems will not be an App Store but an “Alg Store”, i.e, an Algorithm Store providing a growing menu of algorithms that have already been trained to automatically detect certain features in texts, imagery and videos that gets generated during disasters. These algorithms will also “talk to each other” and integrate other feeds (from real-time sensors, Internet of Things) thanks to data-fusion solutions that already exist and others that are in the works.

Now, the astute reader may have noted that I omitted audio/speech in my post. I’ll be writing about this in a future post since this one is already long enough.

This is How Social Media Can Inform UN Needs Assessments During Disasters

My team at QCRI just published their latest findings on our ongoing crisis computing and humanitarian technology research. They focused on UN/OCHA, the international aid agency responsible for coordinating humanitarian efforts across the UN system. “When disasters occur, OCHA must quickly make decisions based on the most complete picture of the situation they can obtain,” but “given that complete knowledge of any disaster event is not possible, they gather information from myriad available sources, including social media.” QCRI’s latest research, which also drew on multiple interviews, shows how “state-of-the-art social media processing methods can be used to produce information in a format that takes into account what large international humanitarian organizations require to meet their constantly evolving needs.”

ClusterPic

QCRI’s new study (PDF) focuses specifically on the relief efforts in response to Typhoon Yolanda (known locally as Haiyan). “When Typhoon Yolanda struck the Philippines, the combination of widespread network access, high Twitter use, and English proficiency led to many located in the Philippines to tweet about the typhoon in English. In addition, outsiders located elsewhere tweeted about the situation, leading to millions of English-language tweets that were broadcast about the typhoon and its aftermath.”

When disasters like Yolanda occur, the UN uses the Multi Cluster/Sector Initial Rapid Assessment (MIRA) survey to assess the needs of affected populations. “The first step in the MIRA process is to produce a ‘Situation Analysis’ report,” which is produced within the first 48 hours of a disaster. Since the Situation Analysis needs to be carried out very quickly, “OCHA is open to using new sources—including social media communications—to augment the information that they and partner organizations so desperately need in the first days of the immediate post-impact period. As these organizations work to assess needs and distribute aid, social media data can potentially provide evidence in greater numbers than what individuals and small teams are able to collect on their own.”

My QCRI colleagues therefore analyzed the 2 million+ Yolanda-related tweets published between November 7-13, 2013 to assess whether any of these could have augmented OCHA’s situational awareness at the time. (OCHA interviewees stated that this “six-day period would be of most interest to them”). QCRI subsequently divided the tweets into two periods:

Screen Shot 2015-02-14 at 8.31.58 AM

Next, colleagues geo-located the tweets by administrative region and compared the frequency of tweets in each region with the number of people who were later found to have been affected in the respective region. The result of this analysis is displayed below (click to enlarge).

Screen Shot 2015-02-14 at 8.33.21 AM

While the “activity on Twitter was in general more significant in regions heavily affected by the typhoon, the correlation is not perfect.” This should not come as a surprise. This analysis is nevertheless a “worthwhile exercise, as it can prove useful in some circumstances.” In addition, knowing exactly what kinds of biases exist on Twitter, and which are “likely to continue is critical for OCHA to take into account as they work to incorporate social media data into future response efforts.”

QCRI researchers also analyzed the 2 million+ tweets to determine which  contained useful information. An informative tweet is defined as containing “information that helps you understand the situation.” They found that 42%-48% of the 2 million tweets fit this category, which is particularly high. Next, they classified those one million informative tweets using the Humanitarian Cluster System. The Up/Down arrows below indicate a 50%+ increase/decrease of tweets in that category during period 2.

Screen Shot 2015-02-14 at 8.35.53 AM

“In the first time period (roughly the first 48 hours), we observe concerns focused on early recovery and education and child welfare. In the second time period, these concerns extend to topics related to shelter, food, nutrition, and water, sanitation and hygiene (WASH). At the same time, there are proportionally fewer tweets regarding telecommunications, and safety and security issues.” The table above shows a “significant increase of useful messages for many clusters between period 1 and period 2. It is also clear that the number of potentially useful tweets in each cluster is likely on the order of a few thousand, which are swimming in the midst of millions of tweets. This point is illustrated by the majority of tweets falling into the ‘None of the above’ category, which is expected and has been shown in previous research.”

My colleagues also examined how “information relevant to each cluster can be further categorized into useful themes.” They used topic modeling to “quickly group thousands of tweets [and] understand the information they contain. In the future, this method can help OCHA staff gain a high- level picture of what type of information to expect from Twitter, and to decide which clusters or topics merit further examination and/or inclusion in the Situation Analysis.” The results of this topic modeling is displayed in the table below (click to enlarge).

Screen Shot 2015-02-14 at 8.34.37 AM

When UN/OCHA interviewees were presented with these results, their “feedback was positive and favorable.” One OCHA interviewee noted that this information “could potentially give us an indicator as to what people are talking most about— and, by proxy, apply that to the most urgent needs.” Another interviewee stated that “There are two places in the early hours that I would want this: 1) To add to our internal “one-pager” that will be released in 24-36 hours of an emergency, and 2) the Situation Analysis: [it] would be used as a proxy for need.” Another UN staffer remarked that “Generally yes this [information] is very useful, particularly for building situational awareness in the first 48 hours.” While some of the analysis may at times be too general, an OCHA interviewee “went on to say the table [above] gives a general picture of severity, which is an advantage during those first hours of response.”

As my QCRI team rightly notes, “This validation from UN staff supports our continued work on collecting, labeling, organizing, and presenting Twitter data to aid humanitarian agencies with a focus on their specific needs as they perform quick response procedures.” We are thus on the right track with both our AIDR and MicroMappers platforms. Our task moving forward is to use these platforms to produce the analysis discussed above, and to do so in near real-time. We also need to (radically) diversify our data sources and thus include information from text messages (SMS), mainstream media, Facebook, satellite imagery and aerial imagery (as noted here).

But as I’ve noted before, we also need enlightened policy making to make the most of these next generation humanitarian technologies. This OCHA proposal  on establishing specific social media standards for disaster response, and the official social media strategy implemented by the government of the Philippines during disasters serve as excellent examples in this respect.

bookcover

Lots more on humanitarian technology, innovation, computing as well as policy making in my new book Digital Humanitarians: How Big Data is Changing the Face of Humanitarian Action.

Could This Be The Most Comprehensive Study of Crisis Tweets Yet?

I’ve been looking forward to blogging about my team’s latest research on crisis computing for months; the delay being due to the laborious process of academic publishing, but I digress. I’m now able to make their  findings public. The goal of their latest research was to “understand what affected populations, response agencies and other stakeholders can expect—and not expect—from [crisis tweets] in various types of disaster situations.”

Screen Shot 2015-02-15 at 12.08.54 PM

As my colleagues rightly note, “Anecdotal evidence suggests that different types of crises elicit different reactions from Twitter users, but we have yet to see whether this is in fact the case.” So they meticulously studied 26 crisis-related events between 2012-2013 that generated significant activity on twitter. The lead researcher on this project, my colleague & friend Alexandra Olteanu from EPFL, also appears in my new book.

Alexandra and team first classified crisis related tweets based on the following categories (each selected based on previous research & peer-reviewed studies):

Screen Shot 2015-02-15 at 11.01.48 AM

Written in long form: Caution & Advice; Affected Individuals; Infrastructure & Utilities; Donations & Volunteering; Sympathy & Emotional Support, and Other Useful Information. Below are the results of this analysis sorted by descending proportion of Caution & Advice related tweets (click to enlarge).

Screen Shot 2015-02-15 at 10.59.55 AM

The category with the largest number of tweets is “Other Useful Info.” On average 32% of tweets fall into this category (minimum 7%, maximum 59%). Interestingly, it appears that most crisis events that are spread over a relatively large geographical area (i.e., they are diffuse), tend to be associated with the lowest number of “Other” tweets. As my QCRI rightly colleagues note, “it is potentially useful to know that this type of tweet is not prevalent in the diffused events we studied.”

Tweets relating to Sympathy and Emotional Support are present in each of the 26 crises. On average, these account for 20% of all tweets. “The 4 crises in which the messages in this category were more prevalent (above 40%) were all instantaneous disasters.” This finding may imply that “people are more likely to offer sympathy when events […] take people by surprise.”

On average, 20% of tweets in the 26 crises relate to Affected Individuals. “The 5 crises with the largest proportion of this type of information (28%–57%) were human-induced, focalized, and instantaneous. These 5 events can also be viewed as particularly emotionally shocking.”

Tweets related to Donations & Volunteering accounted for 10% of tweets on average. “The number of tweets describing needs or offers of goods and services in each event varies greatly; some events have no mention of them, while for others, this is one of the largest information categories. “

Caution and Advice tweets constituted on average 10% of all tweets in a given crisis. The results show a “clear separation between human-induced hazards and natural: all human induced events have less caution and advice tweets (0%–3%) than all the events due to natural hazards (4%–31%).”

Finally, tweets related to Infrastructure and Utilities represented on average 7% of all tweets posted in a given crisis. The disasters with the highest number of such tweets tended to be flood situations.

In addition to the above analysis, Alexandra et al. also categorized tweets by their source:

Screen Shot 2015-02-15 at 11.23.19 AM

The results depicted below (click to enlarge) are sorted by descending order of eyewitness tweets.

Screen Shot 2015-02-15 at 11.27.57 AM

On average, about 9% of tweets generated during a given crises were written by Eyewitnesses; a figure that increased to 54% for the haze crisis in Singapore. “In general, we find a larger proportion of eyewitness accounts during diffused disasters caused by natural hazards.”

Traditional and/or Internet Media were responsible for 42% of tweets on average. ” The 6 crises with the highest fraction of tweets coming from a media source (54%–76%) are instantaneous, which make “breaking news” in the media.

On average, Outsiders posted 38% of the tweets in a given crisis while NGOs were responsible for about 4% of tweets and Governments 5%. My colleagues surmise that these low figures are due to the fact that both NGOs and governments seek to verify information before they release it. The highest levels of NGO and government tweets occur in response to natural disasters.

Finally, Businesses account for 2% of tweets on average. The Alberta floods of 2013 saw the highest proportion (9%) of tweets posted by businesses.

All the above findings are combined and displayed below (click to enlarge). The figure depicts the “average distribution of tweets across crises into combinations of information types (rows) and sources (columns). Rows and columns are sorted by total frequency, starting on the bottom-left corner. The cells in this figure add up to 100%.”

Screen Shot 2015-02-15 at 11.42.39 AM

The above analysis suggests that “when the geographical spread [of a crisis] is diffused, the proportion of Caution and Advice tweets is above the median, and when it is focalized, the proportion of Caution and Advice tweets is below the median. For sources, […] human-induced accidental events tend to have a number of eyewitness tweets below the median, in comparison with intentional and natural hazards.” Additional analysis carried out by my colleagues indicate that “human-induced crises are more similar to each other in terms of the types of information disseminated through Twitter than to natural hazards.” In addition, crisis events that develop instantaneously also look the same when studied through the lens of tweets.

In conclusion, the analysis above demonstrates that “in some cases the most common tweet in one crisis (e.g. eyewitness accounts in the Singapore haze crisis in 2013) was absent in another (e.g. eyewitness accounts in the Savar building collapse in 2013). Furthermore, even two events of the same type in the same country (e.g. Typhoon Yolanda in 2013 and Typhoon Pablo in 2012, both in the Philippines), may look quite different vis-à-vis the information on which people tend to focus.” This suggests the uniqueness of each event.

“Yet, when we look at the Twitter data at a meta-level, our analysis reveals commonalities among the types of information people tend to be concerned with, given the particular dimensions of the situations such as hazard category (e.g. natural, human-induced, geophysical, accidental), hazard type (e.g. earth-quake, explosion), whether it is instantaneous or progressive, and whether it is focalized or diffused. For instance, caution and advice tweets from government sources are more common in progressive disasters than in instantaneous ones. The similarities do not end there. When grouping crises automatically based on similarities in the distributions of different classes of tweets, we also realize that despite the variability, human-induced crises tend to be more similar to each other than to natural hazards.”

Needless to say, these are exactly the kind of findings that can improve the way we use MicroMappers & other humanitarian technologies for disaster response. So if want to learn more, the full study is available here (PDF). In addition, all the Twitter datasets used for the analysis are available at CrisisLex. If you have questions on the research, simply post them in the comments section below and I’ll ask my colleagues to reply there.

bookcover

In the meantime, there is a lot more on humanitarian technology and computing in my new book Digital Humanitarians. As I note in said book, we also need enlightened policy making to tap the full potential of social media for disaster response. Technology alone can only take us so far. If we don’t actually create demand for relevant tweets in the first place, then why should social media users supply a high volume of relevant and actionable tweets to support relief efforts? This OCHA proposal on establishing specific social media standards for disaster response, and this official social media strategy developed and implemented by the Filipino government are examples of what enlightened leadership looks like.

Aerial Imagery Analysis: Combining Crowdsourcing and Artificial Intelligence

MicroMappers combines crowdsourcing and artificial intelligence to make sense of “Big Data” for Social Good. Why artificial intelligence (AI)? Because regular crowdsourcing alone is no match for Big Data. The MicroMappers platform can already be used to crowdsource the search for relevant tweets as well as pictures, videos, text messages, aerial imagery and soon satellite imagery. The next step is therefore to add artificial intelligence to this crowdsourced filtering platform. We have already done this with tweets and SMS. So we’re now turning our attention to aerial and satellite imagery.

Our very first deployment of MicroMappers for aerial imagery analysis was in Africa for this wildlife protection project. We crowdsourced the search for wild animals in partnership with rangers from the Kuzikus Wildlife Reserve based in Namibia. We were very pleased with the results, and so were the rangers. As one of them noted: “I am impressed with the results. There are at times when the crowd found animals that I had missed!” We were also pleased that our efforts caught the attention of CNN. As noted in that CNN report, our plan for this pilot was to use crowdsourcing to find the wildlife and to then combine the results with artificial intelligence to develop a set of algorithms that can automatically find wild animals in the future.

To do this, we partnered with a wonderful team of graduate students at EPFL, the well known polytechnique in Lausanne, Switzerland. While these students were pressed for time due to a number of deadlines, they were nevertheless able to deliver some interesting results. Their applied, computer vision research is particularly useful given our ultimate aim: to create an algorithm that can learn to detect features of interest in aerial and satellite imagery in near real-time (as we’re interested in applying this to disaster response and other time-sensitive events). For now, however, we need to walk before we can run. This means carrying out the tasks of crowdsourcing and artificial intelligence in two (not-yet-integrated) steps.

MM Oryx

As the EPFL students rightly note in their preliminary study, the use of thermal imaging (heat detection) to automatically identify wildlife in the bush is some-what problematic since “the temperature difference between animals and ground is much lower in savannah […].” This explains why the research team used the results of our crowdsourcing efforts instead. More specifically, they focused on automatically detecting the shadows of gazelles and ostriches by using an object based support vector machine (SVM). The whole process is summarized below.

Screen Shot 2015-02-09 at 12.46.38 AM

The above method produces results like the one below (click to enlarge). The circles represents the objects used to train the machine learning classifier. The discerning reader will note that the algorithm has correctly identified all the gazelles save for one instance in which two gazelles were standing close together were identified as one gazelle. But no other objects were mislabeled as a gazelle. In other words, EPFL’s gazelle algorithm is very accurate. “Hence the classifier could be used to reduce the number of objects to assess manually and make the search for gazelles faster.” Ostriches, on the other hand, proved more difficult to automatically detect. But the students are convinced that this could be improved if they had more time.

Screen Shot 2015-02-09 at 12.56.17 AM

In conclusion, more work certainly needs to be done, but I am pleased by these preliminary and encouraging results. In addition, the students at EPFL kindly shared some concrete features that we can implement on the MicroMappers side to improve the crowdsourced results for the purposes of developing automated algorithms in the future. So a big thank you to Briant, Millet and Rey for taking the time to carry out the above research. My team and I at QCRI very much look forward to continuing our collaboration with them and colleagues at EPFL.

In the meantime, more on all this in my new bookDigital Humanitarians: How Big Data is Changing the Face of Humanitarian Response, which has already been endorsed by faculty at Harvard, MIT, Stanford, Oxford, etc; and by experts at the UN, World Bank, Red Cross, Twitter, etc.

Video: Digital Humanitarians & Next Generation Humanitarian Technology

How do international humanitarian organizations make sense of the “Big Data” generated during major disasters? They turn to Digital Humanitarians who craft and leverage ingenious crowdsourcing solutions with trail-blazing insights from artificial intelligence to make sense of vast volumes of social media, satellite imagery and even UAV/aerial imagery. They also use these “Big Data” solutions to verify user-generated content and counter rumors during disasters. The talk below explains how Digital Humanitarians do this and how their next generation humanitarian technologies work.

Many thanks to TTI/Vanguard for having invited me to speak. Lots more on Digital Humanitarians in my new book of the same title.

bookcover

Videos of my TEDx talks and the talks I’ve given at the White House, PopTech, Where 2.0, National Geographic, etc., are all available here.

Reflections on Digital Humanitarians – The Book

In January 2014, I wrote this blog post announcing my intention to write a book on Digital Humanitarians. Well, it’s done! And launches this week. The book has already been endorsed by scholars at Harvard, MIT, Stanford, Oxford, etc; by practitioners at the United Nations, World Bank, Red Cross, USAID, DfID, etc; and by others including Twitter and National Geographic. These and many more endorsements are available here. Brief summaries of each book chapter are available here; and the short video below provides an excellent overview of the topics covered in the book. Together, these overviews make it clear that this book is directly relevant to many other fields including journalism, human rights, development, activism, business management, computing, ethics, social science, data science, etc. In short, the lessons that digital humanitarians have learned (often the hard way) over the years and the important insights they have gained are directly applicable to fields well beyond the humanitarian space. To this end, Digital Humanitarians is written in a “narrative and conversational style” rather than with dense, technical language.

The story of digital humanitarians is a multifaceted one. Theirs is not just a story about using new technologies to make sense of “Big Data”. For the most part, digital humanitarians are volunteers; volunteers from all walks of life and who occupy every time zone. Many are very tech-savvy and pull all-nighters, but most simply want to make a difference using the few minutes they have with the digital technologies already at their fingertips. Digital humanitarians also include pro-democracy activists who live in countries ruled by tyrants. This story is thus also about hope and humanity; about how technology can extend our humanity during crises. To be sure, if no one cared, if no one felt compelled to help others in need, or to change the status quo, then no one even would bother to use these new, next generation humanitarian technologies in the first place.

I believe this explains why Professor Leysia Palen included the following in her very kind review of my book: “I dare you to read this book and not have both your heart and mind opened.” As I reflected to my editor while in the midst of book writing, an alternative tag line for the title could very well be “How Big Data and Big Hearts are Changing the Face of Humanitarian Response.” It is personally and deeply important to me that the media, would-be volunteers  and others also understand that the digital humanitarians story is not a romanticized story about a few “lone heroes” who accomplish the impossible thanks to their super human technical powers. There are thousands upon thousands of largely anonymous digital volunteers from all around the world who make this story possible. And while we may not know all their names, we certainly do know about their tireless collective action efforts—they mobilize online from all corners of our Blue Planet to support humanitarian efforts. My book explains how these digital volunteers do this, and yes, how you can too.

Digital humanitarians also include a small (but growing) number of forward-thinking professionals from large and well-known humanitarian organizations. After the tragic, nightmarish earthquake that struck Haiti in January 2010, these seasoned and open-minded humanitarians quickly realized that making sense of “Big Data” during future disasters would require new thinking, new risk-taking, new partnerships, and next generation humanitarian technologies. This story thus includes the invaluable contributions of those change-agents and explains how these few individuals are enabling innovation within the large bureaucracies they work in. The story would thus be incomplete without these individuals; without their appetite for risk-taking, their strategic understanding of how to change (and at times circumvent) established systems from the inside to make their organizations still relevant in a hyper-connected world. This may explain why Tarun Sarwal of the International Committee of the Red Cross (ICRC) in Geneva included these words (of warning) in his kind review: “For anyone in the Humanitarian sector — ignore this book at your peril.”

bookcover

Today, this growing, cross-disciplinary community of digital humanitarians are crafting and leveraging ingenious crowdsourcing solutions with trail-blazing insights from advanced computing and artificial intelligence in order to make sense of “Big Data” generated during disasters. In virtually real-time, these new solutions (many still in early prototype stages) enable digital volunteers to make sense of vast volumes of social media, SMS and imagery captured from satellites & UAVs to support relief efforts worldwide.

All of this obviously comes with a great many challenges. I certainly don’t shy away from these in the book (despite my being an eternal optimist : ). As Ethan Zuckerman from MIT very kindly wrote in his review of the book,

“[Patrick] is also a careful scholar who thinks deeply about the limits and potential dangers of data-centric approaches. His book offers both inspiration for those around the world who want to improve our disaster response and a set of fertile challenges to ensure we use data wisely and ethically.”

Digital humanitarians are not perfect, they’re human, they make mistakes, they fail; innovation, after all, takes experimenting, risk-taking and failing. But most importantly, these digital pioneers learn, innovate and over time make fewer mistakes. In sum, this book charts the sudden and spectacular rise of these digital humanitarians and their next generation technologies by sharing their remarkable, real-life stories and the many lessons they have learned and hurdles both cleared & still standing. In essence, this book highlights how their humanity coupled with innovative solutions to “Big Data” is changing humanitarian response forever. Digital Humanitarians will make you think differently about what it means to be humanitarian and will invite you to join the journey online. And that is what it’s ultimately all about—action, responsible & effective action.

Why did I write this book? The main reason may perhaps come as a surprise—one word: hope. In a world seemingly overrun by heart-wrenching headlines and daily reminders from the news and social media about all the ugly and cruel ways that technologies are being used to spy on entire populations, to harass, oppress, target and kill each other, I felt the pressing need to share a different narrative; a narrative about how selfless volunteers from all walks of life, from all ages, nationalities, creeds use digital technologies to help complete strangers on the other side of the planet. I’ve had the privilege of witnessing this digital good-will first hand and repeatedly over the years. This goodwill is what continues to restore my faith in humanity and what gives me hope, even when things are tough and not going well. And so, I wrote Digital Humanitarians first and fore-most to share this hope more widely. We each have agency and we can change the world for the better. I’ve seen this and witnessed the impact first hand. So if readers come away with a renewed sense of hope and agency after reading the book, I will have achieved my main objective.

For updates on events, talks, trainings, webinars, etc, please click here. I’ll be organizing a Google Hangout on March 5th for readers who wish to discuss the book in more depth and/or follow up with any questions or ideas. If you’d like additional information on this and future Hangouts, please click on the previous link. If you wish to join ongoing conversations online, feel free to do so with the FB & Twitter hashtag #DigitalJedis. If you’d like to set up a book talk and/or co-organize a training at your organization, university, school, etc., then do get in touch. If you wish to give a talk on the book yourself, then let me know and I’d be happy to share my slides. And if you come across interesting examples of digital humanitarians in action, then please consider sharing these with other readers and myself by using the #DigitalJedis hashtag and/or by sending me an email so I can include your observation in my monthly newsletter and future blog posts. I also welcome guest blog posts on iRevolutions.

Naturally, this book would never have existed were it for digital humanitarians volunteering their time—day and night—during major disasters across the world. This book would also not have seen the light of day without the thoughtful guidance and support I received from these mentors, colleagues, friends and my family. I am thus deeply and profoundly grateful for their spirit, inspiration and friendship. Onwards!

MicroMappers: Towards Next Generation Humanitarian Technology

The MicroMappers platform has come a long way and still has a ways to go. Our vision for MicroMappers is simple: combine human computing (smart crowd-sourcing) with machine computing (artificial intelligence) to filter, fuse and map a variety of different data types such as text, photo, video and satellite/aerial imagery. To do this, we have created a collection of “Clickers” for MicroMappers. Clickers are simply web-based crowdsourcing apps used to make sense of “Big Data”. The “Text Cicker” is used to filter tweets & SMS’s; “Photo Clicker” to filter photos; “Video Clicker” to filter videos and yes the Satellite & Aerial Clickers to filter both satellite and aerial imagery. These are the Data Clickers. We also have a collection of Geo Clickers that digital volunteers use to geo-tag tweets, photos and videos filtered by the Data Clickers. Note that these Geo Clickers auto-matically display the results of the crowdsourced geo-tagging on our MicroMaps like the one below.

MM Ruby Tweet Map

Thanks to our Artificial Intelligence (AI) engine AIDR, the MicroMappers “Text Clicker” already combines human and machine computing. This means that tweets and text messages can be automatically filtered (classified) after some initial crowdsourced filtering. The filtered tweets are then pushed to the Geo Clickers for geo-tagging purposes. We want to do the same (semi-automation) for photos posted to social media as well as videos; although this is still a very active area of research and development in the field of computer vision.

So we are prioritizing our next hybrid human-machine computing efforts on aerial imagery instead. Just like the “Text Clicker” above, we want to semi-automate feature detection in aerial imagery by adding an AI engine to the “Aerial Clicker”. We’ve just starting to explore this with computer vision experts in Switzerland and Canada. Another development we’re eyeing vis-a-vis UAVs is live video streaming. To be sure, UAVs will increasingly be transmitting live video feeds directly to the web. This means we may eventually need to develop a “Streaming Clicker”, which would in some respects resemble our existing “Video Clicker” except that the video would be broadcasting live rather than play back from YouTube, for example. The “Streaming Clicker” is for later, however, or at least until a prospective partner organization approaches us with an immediate and compelling social innovation use-case.

In the meantime, my team & I at QCRI will continue to improve our maps (data visualizations) along with the human computing component of the Clickers. The MicroMappers smartphone apps, for example, need more work. We also need to find partners to help us develop apps for tablets like the iPad. In addition, we’re hoping to create a “Translate Clicker” with Translators Without Borders (TWB). The purpose of this Clicker would be to rapidly crowdsource the translation of tweets, text messages, etc. This could open up rather interesting possibilities for machine translation, which is certainly an exciting prospect.

MM All Map

Ultimately, we want to have one and only one map to display the data filtered via the Data and Geo Clickers. This map, using (Humanitarian) OpenStreetMap as a base layer, would display filtered tweets, SMS’s, photos, videos and relevant features from satellite and UAV imagery. Each data type would simply be a different layer on this fused “Meta-Data Crisis Map”; and end-users would simply turn individual layers on and off as needed. Note also the mainstream news feeds (CNN and BBC) depicted in the above image. We’re working with our partners at UN/OCHA, GDELT & SBTF to create a “3W Clicker” to complement our MicroMap. As noted in my forthcoming book, GDELT is the ultimate source of data for the world’s digitized news media. The 3Ws refers to Who, What, Where; an important spreadsheet that OCHA puts together and maintains in the aftermath of major disasters to support coordination efforts.

In response to Typhoon Ruby in the Philippines, Andrej Verity (OCHA) and I collaborated with Kalev Leetaru from GDELT to explore how the MicroMappers “3W Clicker” might work. The result is the Google Spreadsheet below (click to enlarge) that is automatically updated every 15 minutes with the latest news reports that refer to one or more humanitarian organizations in the Philippines. GDELT includes the original URL of the news article as well as the list of humanitarian organizations referenced in the article. In addition, GDELT automatically identifies the locations referred to in the articles, key words (tags) and the date of the news article. The spreadsheet below is already live and working. So all we need now is the “3W Clicker” to crowdsource the “What”.

MM GDELT output

The first version of the mock-up we’ve created for the “3W Clicker” is displayed below. Digital volunteers are presented with an interface that includes an news article with the names of humanitarian organizations highlighted in red for easy reference. GDELT auto-populates the URL, the organization name (or names if there are more than one) and the location. Note that both the “Who” & “Where” information can be edited directly by the volunteer incase GDELT’s automated algorithm gets those wrong. The main role of digital volunteers, however, would simply be to identify the “What” by quickly skimming the article.

MM 3W Clicker v2

The output of the “3W Clicker” would simply be another MicroMap layer. As per Andrej’s suggestion, the resulting data could also be automatically pushed to another Google Spreadsheet in HXL format. We’re excited about the possibilities and plan to move forward on this sooner rather than later. In addition to GDELT, pulling in feeds from CrisisNET may be worth exploring. I’m also really keen on exploring ways to link up with the Global Disaster Alert & Coordination System (GDACS) as well as GeoFeedia.

In the meantime, we’re hoping to pilot our “Satellite Clicker” thanks to recent conversations with Planet Labs and SkyBox Imaging. Overlaying user-generated content such as tweets and images on top of both satellite and aerial imagery can go a long way to helping verify (“ground truth”) social media during disasters and other events. This is evidenced by recent empirical studies such as this one in Germany and this one in the US. On this note, as my QCRI colleague Heather Leson recently pointed out, the above vision for MicroMappers is still missing one important data feed; namely sensors—the Internet of Things. She is absolutely spot on, so we’ll be sure to look for potential pilot projects that would allow us to explore this new data source within MicroMappers.

The above vision is a tad ambitious (understatement). We really can’t do this alone. To this end, please do get in touch if you’re interested in joining the team and getting MicroMappers to the next level. Note that MicroMappers is free and open source and in no way limited to disaster response applications. Indeed, we recently used the Aerial Clicker for this wildlife protection project in Namibia. This explains why our friends over at National Geographic have also expressed an interest in potentially piloting the MicroMappers platform for some of their projects. And of course, one need not use all the Clickers for a project, simply the one(s) that make sense. Another advantage of MicroMappers is that the Clickers (and maps) can be deployed very rapidly (since the platform was initially developed for rapid disaster response purposes). In any event, if you’d like to pilot the platform, then do get in touch.

bio

See also: Digital Humanitarians – The Book

Calling All Digital Jedis: Support UN Response to Super Typhoon Ruby!

The United Nations has officially activated the Digital Humanitarian Network (DHN) in response to Typhoon Ruby. The DHN serves as the official interface between formal humanitarian organizations and digital volunteer groups from all around the world. These digital volunteers—also known as Digital Jedis— provide humanitarian organizations like the UN and the Red Cross with the “surge” capacity they need to make sense of the “Big Data” that gets generated during disasters. This “Big Data” includes large volumes of social media reports and satellite imagery, for example. And there is a lot of this data being generated right now as a result of Super Typhoon Ruby.

Typhoon Ruby

To make sense of this flash flood of information, Digital Jedis use crowdsourcing platforms like MicroMappers, which was developed in partnership with the UN Office for the Coordination of Humanitarian Affairs (OCHA). In their activation of the Digital Humanitarian Network, the UN has requested that Digital Jedis look for Ruby-related tweets that refer to needs, damage & response efforts. They have also asked digital volunteers to identify pictures of damage caused by the Typhoon. These tweets and pictures will then to be added to a live crisis map to augment the UN’s own disaster damage and needs assessment efforts.

You too can be a Digital Jedi. Trust me, MicroMappers is far easier to use than a lightsaber. All it takes is a single Click of the mouse. Yes, it really is that simple. So, if a Digital Jedi you want to be, let your first Click be this one! Following that click will set you on the path to help the United Nation’s important relief efforts in the Philippines. So if you’ve got a bit of time on your hands—even 2 minutes goes a long way—then help us make a meaningful difference in the world, join the Force! And may the Crowd be with Us!

bio

See also: Digital Humanitarians – The Path of the Digtal Jedis

Digital Jedis: There Has Been An Awakening…

Crowdsourcing and Humanitarian Action: Analysis of the Literature

Raphael Hörler from Zurich’s ETH University has just completed his thesis on the role of crowdsourcing in humanitarian action. His valuable research offers one of the most up-to-date and comprehensive reviews of the principal players and humanitarian technologies in action today. In short, I highly recommend this important resource. Raphael’s full thesis is available here (PDF).

Crowdsourcing Yolanda Response

bio