Tag Archives: MicroMappers

Using AIDR to Collect and Analyze Tweets from Chile Earthquake

Wish you had a better way to make sense of Twitter during disasters than this?

Type in a keyword like #ChileEarthquake in Twitter’s search box above and you’ll see more tweets than you can possibly read in a day let alone keep up with for more than a few minutes. Wish there way were an easy, free and open source solution? Well you’ve come to the right place. My team and I at QCRI are developing the Artificial Intelligence for Disaster Response (AIDR) platform to do just this. Here’s how it works:

First you login to the AIDR platform using your own Twitter handle (click images below to enlarge):

AIDR login

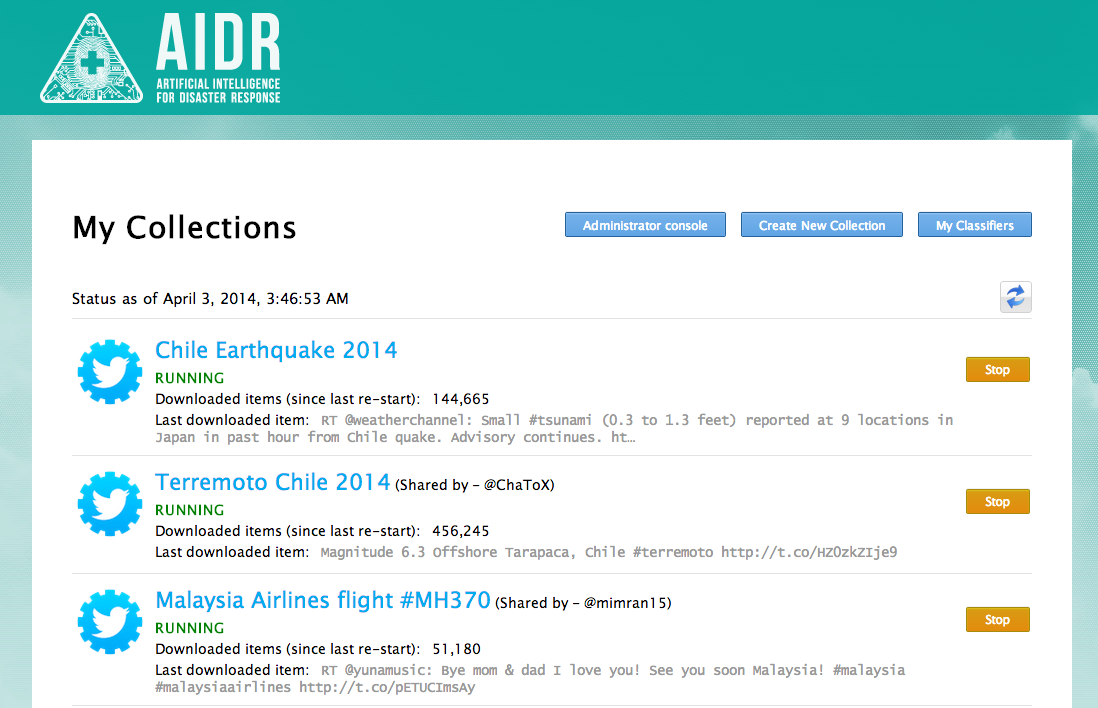
You’ll then see your collection of tweets (if you already have any). In my case, you’ll see I have three. The first is a collection of English language tweets related to the Chile Earthquake. The second is a collection of Spanish tweets. The third is a collection of more than 3,000,000 tweets related to the missing Malaysia Airlines plane. A preliminary analysis of these tweets is available here.

AIDR collections

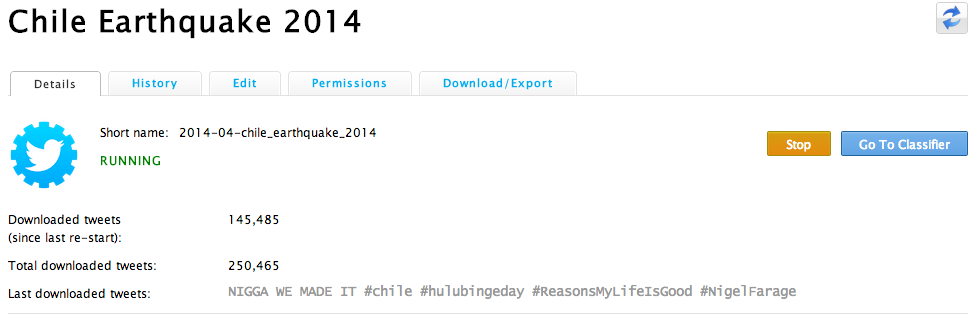
Lets look more closely at my Chile Earthquake 2014 collection (see below, click to enlarge). I’ve collected about a quarter of a million tweets in the past 30 hours or so. The label “Downloaded tweets (since last re-start)” simply refers to the number of tweets I’ve collected since adding a new keyword or hashtag to my collection. I started the collection yesterday at 5:39am my time (yes, I’m an early bird). Under “Keywords” you’ll see all the hashtags and keywords I’ve used to search for tweets related to the earthquake in Chile. I’ve also specified the geographic region I want to collect tweets from. Don’t worry, you don’t actually have to enter geographic coordinates when you set up your own collection, you simply highlight (on map) the area you’re interested in and AIDR does the rest.

AIDR - Chile Earthquake 2014

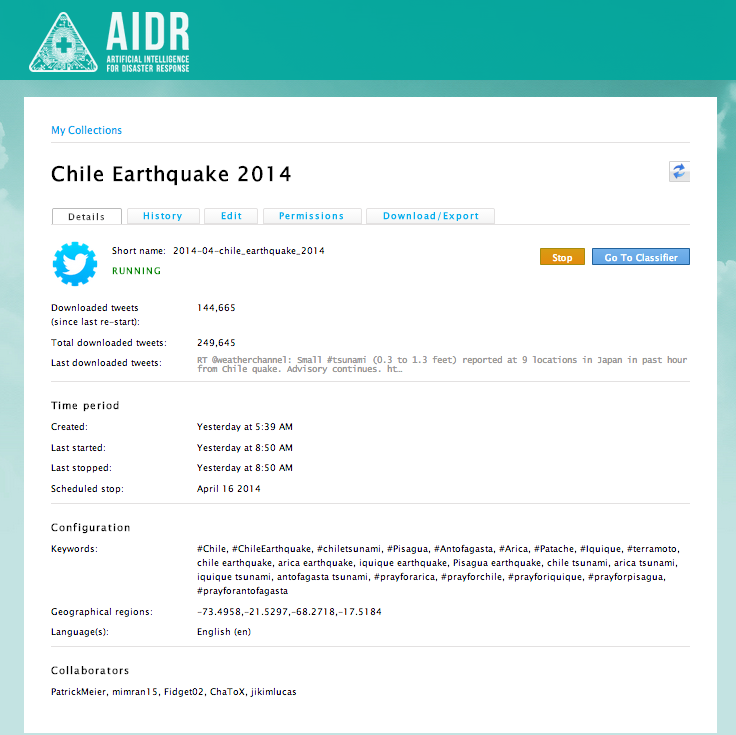
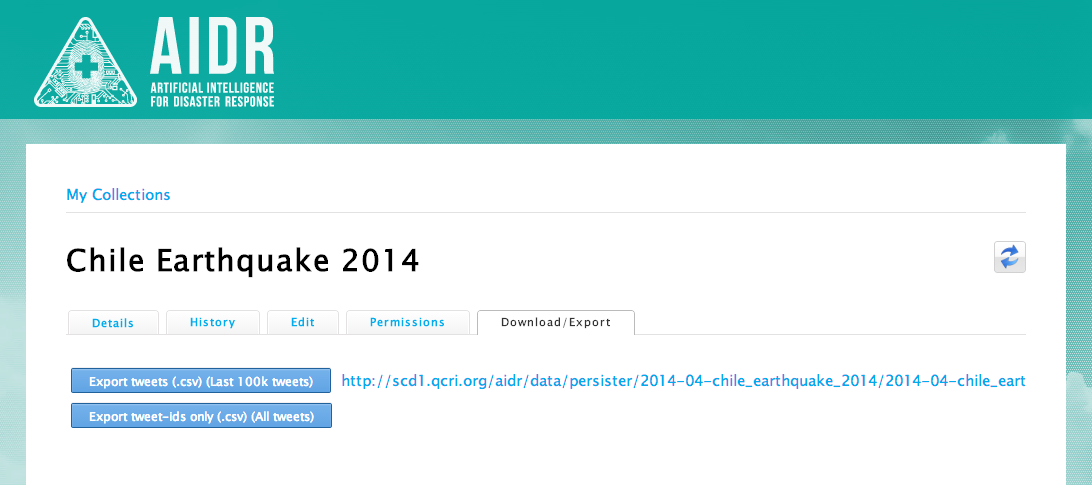
You’ll also note in the above screenshot that I’ve selected to only collect tweets in English, but you can collect all language tweets if you’d like or just a select few. Finally, the Collaborators section simply lists the colleagues I’ve added to my collection. This gives them the ability to add new keywords/hashtags and to download the tweets collected as shown below (click to enlarge). More specifically, collaborators can download the most recent 100,000 tweets (and also share the link with others). The 100K tweet limit is based on Twitter’s Terms of Service (ToS). If collaborators want all the tweets, Twitter’s ToS allows for sharing the TweetIDs for an unlimited number of tweets.

AIDR download CSV

So that’s the AIDR Collector. We also have the AIDR Classifier, which helps you make sense of the tweets you’re collecting (in real-time). That is, your collection of tweets doesn’t stop, it continues growing, and as it does, you can make sense of new tweets as they come in. With the Classifier, you simply teach AIDR to classify tweets into whatever topics you’re interested in, like “Infrastructure Damage”, for example. To get started with the AIDR Classifier, simply return to the “Details” tab of our Chile collection. You’ll note the “Go To Classifier” button on the far right:

AIDR go to Classifier

Clicking on that button allows you to create a Classifier, say on the topic of disaster damage in general. So you simply create a name for your Classifier, in this case “Disaster Damage” and then create Tags to capture more details with respect to damage-related tweets. For example, one Tag might be, say, “Damage to Transportation Infrastructure.” Another could be “Building Damage.” In any event, once you’ve created your Classifier and corresponding tags, you click Submit and find your way to this page (click to enlarge):

AIDR Classifier Link

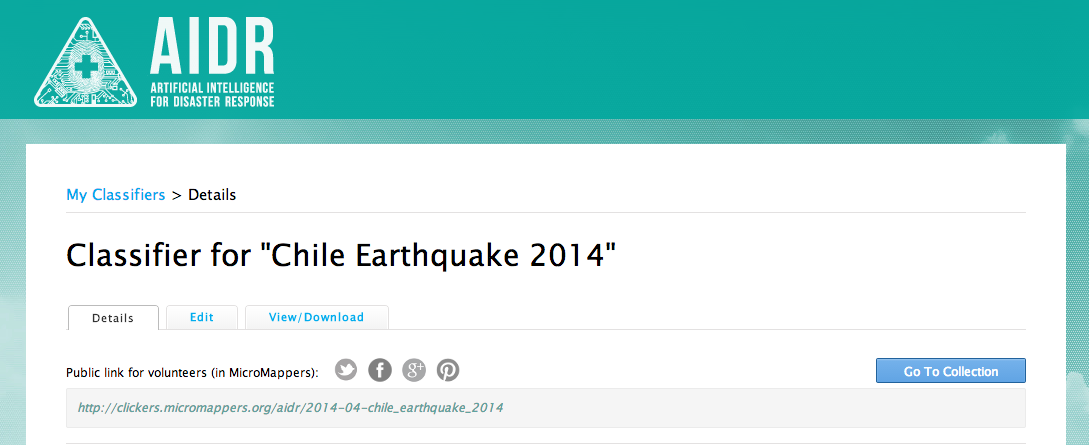
You’ll notice the public link for volunteers. That’s basically the interface you’ll use to teach AIDR. If you want to teach AIDR by yourself, you can certainly do so. You also have the option of “crowdsourcing the teaching” of AIDR. Clicking on the link will take you to the page below.

AIDR to MicroMappers

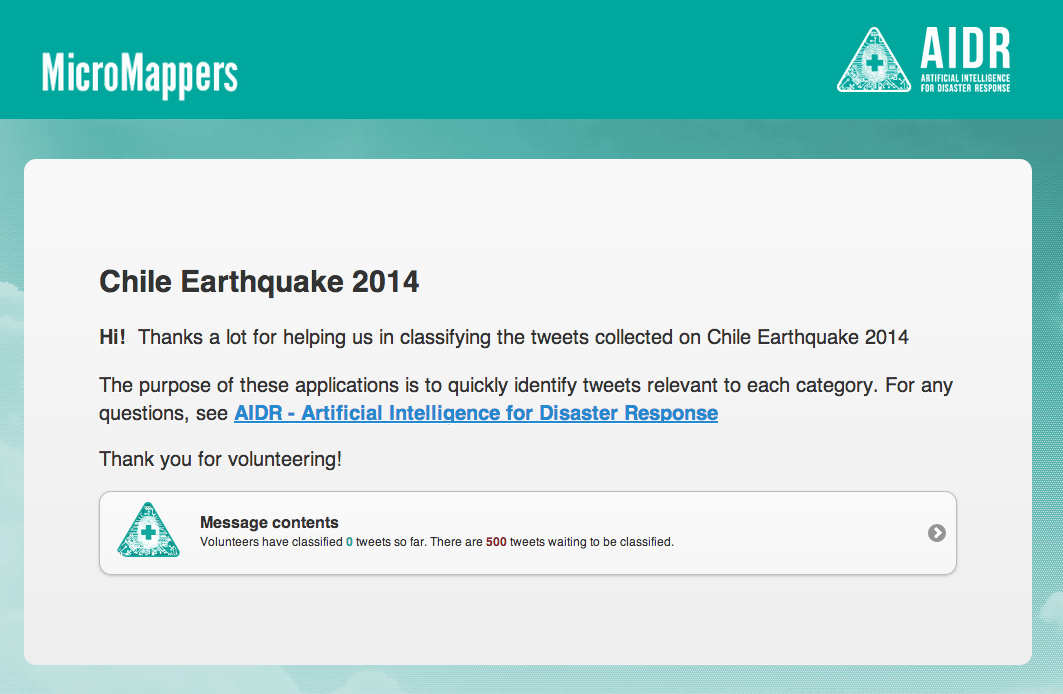
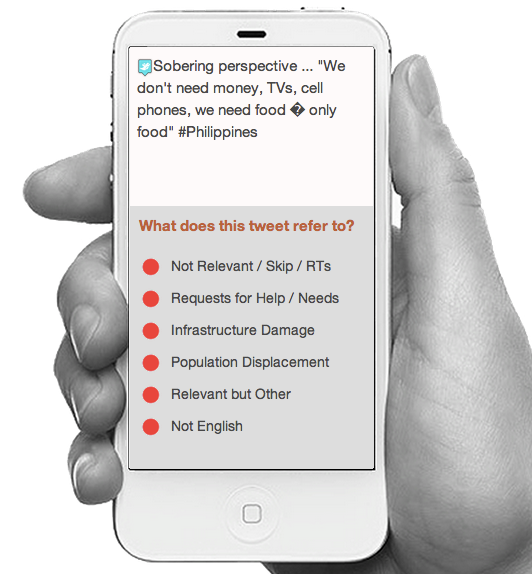
So, I called my Classifier “Message Contents” which is not particularly insightful; I should have labeled it something like “Humanitarian Information Needs” or something, but bear with me and lets click on that Classifier. This will take you to the following Clicker on MicroMappers:

MicroMappers Clicker

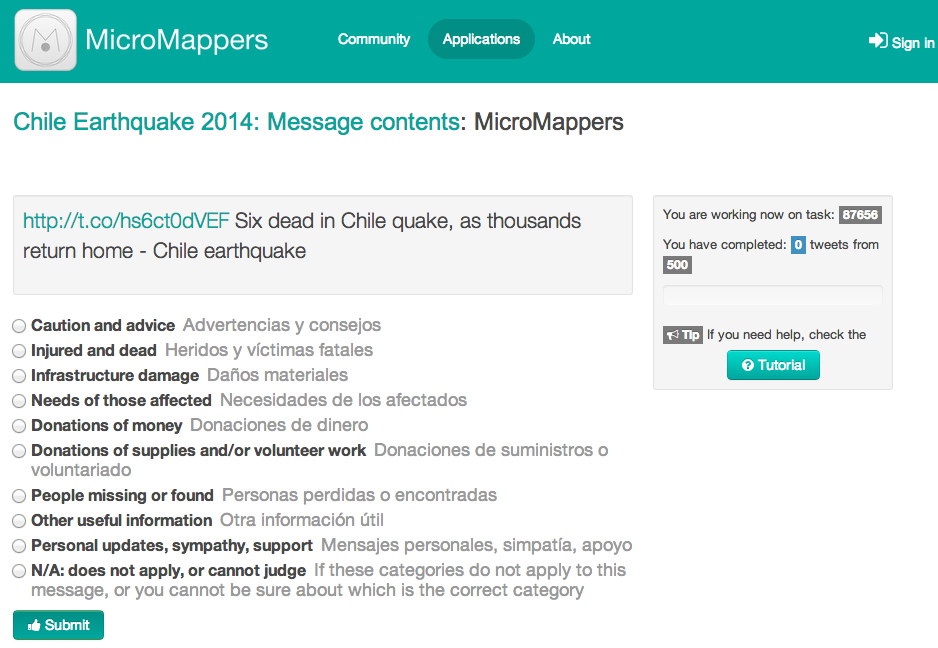
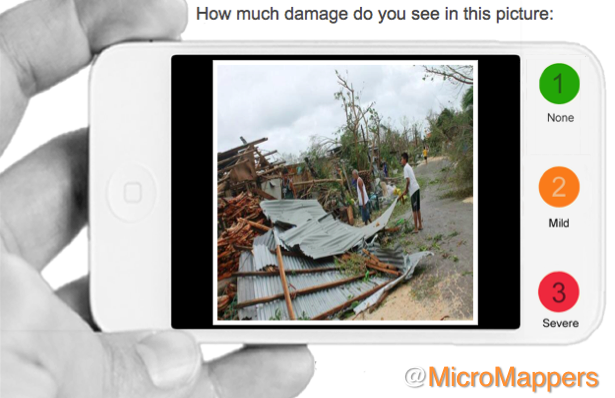
Now this is not the most awe-inspiring interface you’ve ever seen (at least I hope not); reason being that this is simply our very first version. We’ll be providing different “skins” like the official MicroMappers skin (below) as well as a skin that allows you to upload your own logo, for example. In the meantime, note that AIDR shows every tweet to at least three different volunteers. And only if each of these 3 volunteers agree on how to classify a given tweet does AIDR take that into consideration when learning. In other words, AIDR wants to ensure that humans are really sure about how to classify a tweet before it decides to learn from that lesson. Incidentally, The MicroMappers smartphone app for the iPhone and Android will be available in the next few weeks. But I digress.

Yolanda TweetClicker4

As you and/or your volunteers classify tweets based on the Tags you created, AIDR starts to learn—hence the AI (Artificial Intelligence) in AIDR. AIDR begins to recognize that all the tweets you classified as “Infrastructure Damage” are indeed similar. Once you’ve tagged enough tweets, AIDR will decide that it’s time to leave the nest and fly on it’s own. In other words, it will start to auto-classify incoming tweets in real-time. (At present, AIDR can auto-classify some 30,000 tweets per minute; compare this to the peak rate of 16,000 tweets per minute observed during Hurricane Sandy).

Of course, AIDR’s first solo “flights” won’t always go smoothly. But not to worry, AIDR will let you know when it needs a little help. Every tweet that AIDR auto-tags comes with a Confidence level. That is, AIDR will let you know: “I am 80% sure that I correctly classified this tweet”. If AIDR has trouble with a tweet, i.e., if it’s confidence level is 65% or below, the it will send the tweet to you (and/or your volunteers) so it can learn from how you classify that particular tweet. In other words, the more tweets you classify, the more AIDR learns, and the higher AIDR’s confidence levels get. Fun, huh?

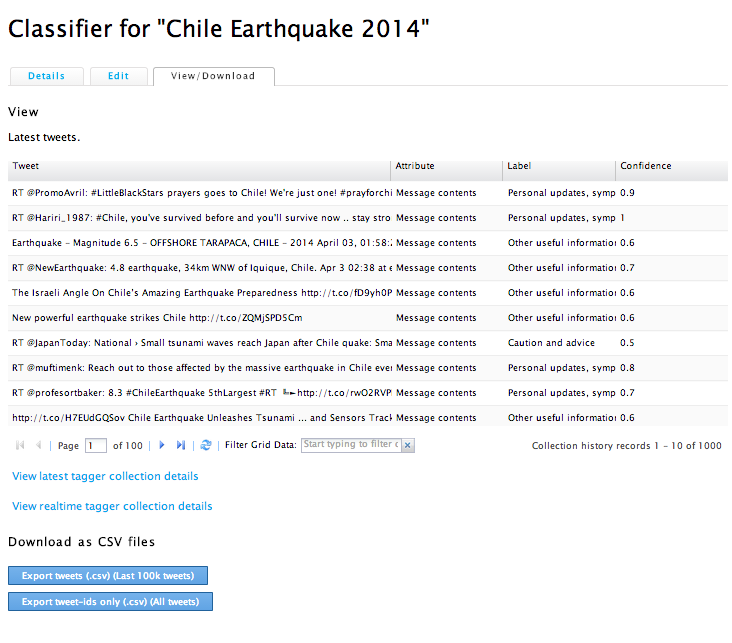
To view the results of the machine tagging, simply click on the View/Download tab, as shown below (click to enlarge). The page shows you the latest tweets that have been auto-tagged along with the Tag label and the confidence score. (Yes, this too is the first version of that interface, we’ll make it more user-friendly in the future, not to worry). In any event, you can download the auto-tagged tweets in a CSV file and also share the download link with your colleagues for analysis and so on. At some point in the future, we hope to provide a simple data visualization output page so that you can easily see interesting data trends.

AIDR Results

So that’s basically all there is to it. If you want to learn more about how it all works, you might fancy reading this research paper (PDF). In the meantime, I’ll simply add that you can re-use your Classifiers. If (when?) another earthquake strikes Chile, you won’t have to start from scratch. You can auto-tag incoming tweets immediately with the Classifier you already have. Plus, you’ll be able to share your classifiers with your colleagues and partner organizations if you like. In other words, we’re envisaging an “App Store” of Classifiers based on different hazards and different countries. The more we re-use our Classifiers, the more accurate they will become. Everybody wins.

And voila, that is AIDR (at least our first version). If you’d like to test the platform and/or want the tweets from the Chile Earthquake, simply get in touch!

bio

Note:

  • We’re adapting AIDR so that it can also classify text messages (SMS).
  • AIDR Classifiers are language specific. So if you speak Spanish, you can create a classifier to tag all Spanish language tweets/SMS that refer to disaster damage, for example. In other words, AIDR does not only speak English : )

Launching a Search and Rescue Challenge for Drone / UAV Pilots

My colleague Timothy Reuter (of AidDroids fame) kindly invited me to co-organize the Drone/UAV Search and Rescue Challenge for the DC Drone User Group. The challenge will take place on May 17th near Marshall in Virginia. The rules for the competition are based on the highly successful Search/Rescue challenge organized by my new colleague Chad with the North Texas Drone User Group. We’ll pretend that a person has gone missing by scattering (over a wide area) various clues such as pieces of clothing & personal affects. Competitors will use their UAVs to collect imagery of the area and will have 45 minutes after flying to analyze the imagery for clues. The full set of rules for our challenge are listed here but may change slightly as we get closer to the event.

searchrescuedrones

I want to try something new with this challenge. While previous competitions have focused exclusively on the use of drones/UAVs for the “Search” component of the challenge, I want to introduce the option of also engaging in the “Rescue” part. How? If UAVs identify a missing person, then why not provide that person with immediate assistance while waiting for the Search and Rescue team to arrive on site? The UAV could drop a small and light-weight first aid kit, or small water bottle, or even a small walkie talkie. Enter my new colleague Euan Ramsay who has been working on a UAV payloader solution for Search and Rescue; see the video demo below. Euan, who is based in Switzerland, has very kindly offered to share several payloader units for our UAV challenge. So I’ll be meeting up with him next month to take the units back to DC for the competition.

Another area I’d like to explore for this challenge is the use of crowdsourcing to analyze the aerial imagery & video footage. As noted here, the University of Central Lancashire used crowdsourcing in their UAV Search and Rescue pilot project last summer. This innovative “crowdsearching” approach is also being used to look for Malaysia Flight 370 that went missing several weeks ago. I’d really like to have this crowdsourcing element be an option for the DC Search & Rescue challenge.

UAV MicroMappers

My team and I at QCRI have developed a platform called MicroMappers, which can easily be used to crowdsource the analysis of UAV pictures and videos. The United Nations (OCHA) used MicroMappers in response to Typhoon Yolanda last year to crowdsource the tagging pictures posted on Twitter. Since then we’ve added video tagging capability. So one scenario for the UAV challenge would be for competitors to upload their imagery/videos to MicroMappers and have digital volunteers look through this content for clues of our fake missing person.

In any event, I’m excited to be collaborating with Timothy on this challenge and will be share updates on iRevolution on how all this pans out.

bio

See also:

  • Using UAVs for Search & Rescue [link]
  • Crowdsourcing Analysis of UAV Imagery for Search and Rescue [link]
  • How UAVs are Making a Difference in Disaster Response [link]
  • Grassroots UAVs for Disaster Response [link]

Using Crowd Computing to Analyze UAV Imagery for Search & Rescue Operations

My brother recently pointed me to this BBC News article on the use of drones for Search & Rescue missions in England’s Lake District, one of my favorite areas of the UK. The picture below is one I took during my most recent visit. In my earlier blog post on the use of UAVs for Search & Rescue operations, I noted that UAV imagery & video footage could be quickly analyzed using a microtasking platform (like MicroMappers, which we used following Typhoon Yolanda). As it turns out, an enterprising team at the University of Central Lancashire has been using microtasking as part of their UAV Search & Rescue exercises in the Lake District.

Lake District

Every year, the Patterdale Mountain Rescue Team assists hundreds of injured and missing persons in the North of the Lake District. “The average search takes several hours and can require a large team of volunteers to set out in often poor weather conditions.” So the University of Central Lancashire teamed up with the Mountain Rescue Team to demonstrate that UAV technology coupled with crowdsourcing can reduce the time it takes to locate and rescue individuals.

The project, called AeroSee Experiment, worked as follows. The Mountain Rescue service receives a simulated distress call. As they plan their Search & Rescue operation, the University team dispatches their UAV to begin the search. Using live video-streaming, the UAV automatically transmits pictures back to the team’s website where members of the public can tag pictures that members of the Mountain Rescue service should investigate further. These tagged pictures are then forwarded to “the Mountain Rescue Control Center for a final opinion and dispatch of search teams.” Click to enlarge the diagram below.

AeroSee

Members of the crowd would simply log on to the AeroSee website and begin tagging. Although the experiment is over, you can still do a Practice Run here. Below is a screenshot of the microtasking interface (click to enlarge). One picture at a time is displayed. If the picture displays potentially important clues, then the digital volunteer points to said area of the picture and types in why they believe the clue they’re pointing at might be important.

AeroSee MT2

The results were impressive. A total of 335 digital volunteers looked through 11,834 pictures and the “injured” walker (UAV image below) was found within 69 seconds of the picture being uploaded to microtasking website. The project team subsequently posted this public leaderboard to acknowledge all volunteers who participated, listing their scores and levels of accuracy for feedback purposes.

Aero MT3

Upon further review of the data and results, the project team concluded that the experiment was a success and that digital Search & Rescue volunteers were able to “home in on the location of our missing person before the drones had even landed!” The texts added to the tagged images were also very descriptive, which helped the team “locate the casualty very quickly from the more tentative tags on other images.”

If the area being surveyed during a Search & Rescue operation is fairly limited, then using the crowd to process UAV images is a quick and straightforward, especially if the crowd is relatively large. We have over 400 digital humanitarian volunteers signed up for MicroMappers (launched in November 2013) and hope to grow this to 1,000+ in 2014. But for much larger areas, like Kruger National Park, one would need far more volunteers. Kruger covers 7,523 square miles compared to the Lake District’s 885 square miles.

kruger-gate-sign

One answer to this need for more volunteers could be the good work that my colleagues over at Zooniverse are doing. Launched in February 2009, Zooniverse has a unique volunteer base of one million volunteers. Another solution is to use machine computing to prioritize the flights paths of UAVs in the first place, i.e., use advanced algorithms to considerably reduce the search area by ruling out areas that missing people or other objects of interest (like rhinos in Kruger) are highly unlikely to be based on weather, terrain, season and other data.

This is the area that my colleague Tom Snitch works in. As he noted in this recent interview (PDF), “We want to plan a flight path for the drone so that the number of unprotected animals is as small as possible.” To do this, he and his team use “exquisite mathematics and complex algorithms” to learn how “animals, rangers and poachers move through space and time.” In the case Search & Rescue, ruling out areas that are too steep and impossible for humans to climb or walk through could go a long way to reducing the search area not to mention the search time.

bio

See also:

  • Using UAVs for Search & Rescue [link]
  • MicroMappers: Microtasking for Disaster Response [link]
  • Results of MicroMappers Response to Typhoon Yolanda [link]
  • How UAVs are Making a Difference in Disaster Response [link]
  • Crowdsourcing Evaluation of Sandy Building Damage [link]

Early Results of MicroMappers Response to Typhoon Yolanda (Updated)

We have completed our digital humanitarian operation in the Philippines after five continuous days with MicroMappers. Many, many thanks to all volunteers from all around the world who donated their time by clicking on tweets and images coming from the Philippines. Our UN OCHA colleagues have confirmed that the results are being shared widely with their teams in the field and with other humanitarian organizations on the ground. More here.

ImageClicker

In terms of preliminary figures (to be confirmed):

  • Tweets collected during first 48 hours of landfall = ~230,000
  • Tweets automatically filtered for relevancy/uniqueness = ~55,000
  • Tweets clicked using the TweetClicker = ~ 30,000
  • Relevant tweets triangulated using TweetClicker = ~3,800
  • Triangulated tweets published on live Crisis Map = ~600
  • Total clicks on TweetClicker = ~ 90,000
  • Images clicked using the ImageClicker = ~ 5,000
  • Relevant images triangulated using TweetClicker = ~1,200
  • Triangulated images published on live Crisis Map = ~180
  • Total clicks on ImageClicker = ~15,000
  • Total clicks on MicroMappers (Image + Tweet Clickers) = ~105,000

Since each single tweet and image uploaded to the Clickers was clicked on by (at least) three individual volunteers for quality control purposes, the number of clicks is three times the total number of tweets and images uploaded to the respective clickers. In sum, digital humanitarian volunteers have clocked a grand total of ~105,000 clicks to support humanitarian operations in the Philippines.

While the media has largely focused on the technology angle of our digital humanitarian operation, the human story is for me the more powerful message. This operation succeeded because people cared. Those ~105,000 clicks did not magically happen. Each and every single one of them was clocked by humans, not machines. At one point, we had over 300 digital volunteers from the world over clicking away at the same time on the TweetClicker and more than 200 on the ImageClicker. This kind of active engagement by total strangers—good “digital Samaritans”—explains why I find the human angle of this story to be the most inspiring outcome of MicroMappers. “Crowdsourcing” is just a new term for the old saying “it takes a village,” and sometimes it takes a digital village to support humanitarian efforts on the ground.

Until recently, when disasters struck in faraway lands, we would watch the news on television wishing we could somehow help. That private wish—that innate human emotion—would perhaps translate into a donation. Today, not only can you donate cash to support those affected by disasters, you can also donate a few minutes of your time to support the operational humanitarian response on the ground by simply clicking on MicroMappers. In other words, you can translate your private wish into direct, online public action, which in turn translates into supporting offline collective action in the disaster-affected areas.

Clicking is so simple that anyone with Internet access can help. We had high schoolers in Qatar clicking away, fire officers in Belgium, graduate students in Boston, a retired couple in Kenya and young Filipinos clicking away. They all cared and took the time to try and help others, often from thousands of miles away. That is the kind of world I want to live in. So if you share this vision, then feel free to join the MicroMapper list-serve.

Yolanda TweetClicker4

Considering that MicroMappers is still very much under development, we are all pleased with the results. There were of course many challenges; the most serious was the CrowdCrafting server which hosts our Clickers. Unfortunately, that server was not able to handle the load and traffic generated by digital volunteers. So their server crashed twice and also slowed our Clickers to a complete stop at least a dozen times during the past five days. At times, it would take 10-15 seconds for a new tweet or image to load, which was frustrating. We were also limited by the number of tweets and images we could upload at any given time, usually ~1,500 at most. Any larger load would seriously slow down the Clickers. So it is rather remarkable that digital volunteers managed to clock more than 100,000 clicks given the repeated interruptions. 

Besides the server issue, the other main bottleneck was the geo-location of the ~30,000 tweets and ~5,000 images tagged using the Clickers. We do have a Tweet and Image GeoClicker but these were not slated to launch until next week at CrisisMappers 2013, which meant they weren’t ready for prime time. We’ll be sure to launch them soon. Once they are operational, we’ll be able to automatically push triangulated tweets and images from the Tweet and Image Clickers directly to the corresponding GeoClickers so volunteers can also aid humanitarian organizations by mapping important tweets and images directly.

There’s a lot more that we’ve learned throughout the past 5 days and much room for improvement. We have a long list of excellent suggestions and feedback from volunteers and partners that we’ll be going through starting tomorrow. The most important next step is to get a more powerful server that can handle a lot more load and traffic. We’re already taking action on that. I have no doubt that our clicks would have doubled without the server constraints.

For now, though, BIG thanks to the SBTF Team and in particular Jus McKinnon, the QCRI et al team, in particular Ji Lucas, Hemant Purohit and Andrew Ilyas for putting in very, very long hours, day in and day out on top of their full-time jobs and studies. And finally, BIG thanks to the World Wide Crowd, to all you who cared enough to click and support the relief operations in the Philippines. You are the heroes of this story.

bio

Live Crisis Map of Disaster Damage Reported on Social Media

Update: See early results of MicroMappers deployment here

Digital humanitarian volunteers have been busing tagging images posted to social media in the aftermath of Typhoon Yolanda. More specifically, they’ve been using the new MicroMappers ImageClicker to rate the level of damage they see in each image. Thus far, they have clicked over 7,000 images. Those that are tagged as “Mild” and “Severe” damage are then geolocated by members of the Standby Volunteer Task Force (SBTF) who have partnered with GISCorps and ESRI to create this live Crisis Map of the disaster damage tagged using the ImageClicker. The map takes a few second to load, so please be patient.

YolandaPH Crisis Map 1

The more pictures are clicked using the ImageClicker, the more populated this crisis map will become. So please help out if you have a few seconds to spare—that’s really all it takes to click an image. If there are no picture left to click or the system is temporarily offline, then please come back a while later as we’re uploading images around the clock. And feel free to join our list-serve in the meantime if you wish to be notified when humanitarian organizations need your help in the future. No prior experience or training necessary. Anyone who knows how to use a computer mouse can become a digital humanitarian.

The SBTF, GISCorps and ESRI are members of the Digital Humanitarian Network (DHN), which my colleague Andrej Verity and I co-founded last year. The DHN serves as the official interface for direct collaboration between traditional “brick-and-mortar” humanitarian organizations and highly skilled digital volunteer networks. The SBTF Yolanda Team, spearheaded by my colleague Justine Mackinnon, for example, has also produced this map based on the triangulated results of the TweetClicker:

YolandaPH Crisis Map 2
There’s a lot of hype around the use of new technologies and social media for disaster response. So I want to be clear that our digital humanitarian operations in the Philippines have not been perfect. This means  that we’re learning (a lot) by doing (a lot). Such is the nature of innovation. We don’t have the luxury of locking ourselves up in a lab for a year to build the ultimate humanitarian technology platform. This means we have to work extra, extra hard when deploying new platforms during major disasters—because not only do we do our very best to carry out Plan A, but we often have to carry out  Plans B and C in parallel just in case Plan A doesn’t pan out. Perhaps Samuel Beckett summed it up best: “Ever tried. Ever failed. No matter. Try Again. Fail again. Fail better.”

bio

Digital Humanitarians: From Haiti Earthquake to Typhoon Yolanda

We’ve been able to process and make sense of a quarter of a million tweets in the aftermath of Typhoon Yolanda. Using both AIDR (still under development) and Twitris, we were able to collect these tweets in real-time and use automated algorithms to filter for both relevancy and uniqueness. The resulting ~55,000 tweets were then uploaded to MicroMappers (still under development). Digital volunteers from the world over used this humanitarian technology platform to tag tweets and now images from the disaster (click image below to enlarge). At one point, volunteers tagged some 1,500 tweets in just 10 minutes. In parallel, we used machine learning classifiers to automatically identify tweets referring to both urgent needs and offers of help. In sum, the response to Typhoon Yolanda is the first to make full use of advanced computing, i.e., both human computing and machine computing to make sense of Big (Crisis) Data.

ImageClicker YolandaPH

We’ve come a long way since the tragic Haiti Earthquake. There was no way we would’ve been able to pull off the above with the Ushahidi platform. We weren’t able to keep up with even a few thousand tweets a day back then, not to mention images. (Incidentally, MicroMappers can also be used to tag SMS). Furthermore, we had no trained volunteers on standby back when the quake struck. Today, not only do we have a highly experienced network of volunteers from the Standby Volunteer Task Force (SBTF) who serve as first (digital) responders, we also have an ecosystem of volunteers from the Digital Humanitarian Network (DHN). In the case of Typhoon Yolanda, we also had a formal partner, the UN Office for the Coordination of Humanitarian Affairs (OCHA), that officially requested digital humanitarian support. In other words, our efforts are directly in response to clearly articulated information needs. In contrast, the response to Haiti was “supply based” in that we simply pushed out all information that we figured might be of use to humanitarian responders. We did not have a formal partner from the humanitarian sector going into the Haiti operation.

Yolanda Prezi

What this new digital humanitarian operation makes clear is that preparedness, partnerships & appropriate humanitarian technology go a long way to ensuring that our efforts as digital humanitarians add value to the field-based operations in disaster zones. The above Prezi by SBTF co-founder Anahi (click on the image to launch the presentation) gives an excellent overview of how these digital humanitarian efforts are being coordinated in response to Yolanda. SBTF Core Team member Justine Mackinnon is spearheading the bulk of these efforts.

While there are many differences between the digital response to Haiti and Yolanda, several key similarities have also emerged. First, neither was perfect, meaning that we learned a lot in both deployments; taking a few steps forward, then a few steps back. Such is the path of innovation, learning by doing. Second, like our use of Skype in Haiti, there’s no way we could do this digital response work without Skype. Third, our operations were affected by telecommunications going offline in the hardest hit areas. We saw an 18.7% drop in relevant tweets on Saturday compared to the day before, for example. Fourth, while the (very) new technologies we are deploying are promising, they are still under development and have a long way to go. Fifth, the biggest heroes in response to Haiti were the volunteers—both from the Haitian Diaspora and beyond. The same is true of Yolanda, with hundreds of volunteers from the world over (including the Philippines and the Diaspora) mobilizing online to offer assistance.

A Filipino humanitarian worker in Quezon City, Philippines, for example, is volunteering her time on MicroMappers. As is customer care advisor from Eurostar in the UK and a fire officer from Belgium who recruited his uniformed colleagues to join the clicking. We have other volunteer Clickers from Makati (Philippines), Cape Town (South Africa), Canberra & Gold Coast (Australia), Berkeley, Brooklyn, Citrus Heights & Hinesburg (US), Kamloops (Canada), Paris & Marcoussis (France), Geneva (Switzerland), Sevilla (Spain), Den Haag (Holland), Munich (Germany) and Stokkermarke (Denmark) to name just a few! So this is as much a human story is it is one about technology. This is why online communities like MicroMappers are important. So please join our list-serve if you want to be notified when humanitarian organizations need your help.

Bio

Typhoon Yolanda: UN Needs Your Help Tagging Crisis Tweets for Disaster Response (Updated)

Final Update 14 [Nov 13th @ 4pm London]: Thank you for clicking to support the UN’s relief operations in the Philippines! We have now completed our mission as digital humanitarian volunteers. The early results of our collective online efforts are described here. Thank you for caring and clicking. Feel free to join our list-serve if you want to be notified when humanitarian organizations need your help again during the next disaster—which we really hope won’t be for a long, long time. In the meantime, our hearts and prayers go out to those affected by this devastating Typhoon.

The United Nations Office for the Coordination of Humanitarian Affairs (OCHA) just activated the Digital Humanitarian Network (DHN) in response to Typhoon Yolanda, which has already been described as possibly one of the strongest Category 5 storms in history. The Standby Volunteer Task Force (SBTF) was thus activated by the DHN to carry out a rapid needs & damage assessment by tagging reports posted to social media. So Ji Lucas and I at QCRI (+ Hemant & Andrew) and Justine Mackinnon from SBTF have launched MicroMappers to microtask the tagging of tweets & images. We need all the help we can get given the volume we’ve collected (and are continuing to collect). This is where you come in!

TweetClicker_PH2

You don’t need any prior experience or training, nor do you need to create an account or even login to use the MicroMappers TweetClicker. If you can read and use a computer mouse, then you’re all set to be a Digital Humanitarian! Just click here to get started. Every tweet will get tagged by 3 different volunteers (to ensure quality control) and those tweets that get identical tags will be shared with our UN colleagues in the Philippines. All this and more is explained in the link above, which will give you a quick intro so you can get started right away. Our UN colleagues need these tags to better understand who needs help and what areas have been affected.

ImageClicker YolandaPH

It only takes 3 seconds to tag a tweet or image, so if that’s all the time you have then that’s plenty! And better yet, if you also share this link with family, friends, colleagues etc., and invite them to tag along. We’ll soon be launching We have also launched the ImageClicker to tag images by level of damage. So please stay tuned. What we need is the World Wide Crowd to mobilize in support of those affected by this devastating disaster. So please spread the word. And keep in mind that this is only the second time we’re using MicroMappers, so we know it is not (yet) perfect : ) Thank you!

bio

p.s. If you wish to receive an alert next time MicroMappers is activated for disaster response, then please join the MicroMappers list-serve here. Thanks!

Previous updates:

Update 1: If you notice that all the tweets (tasks) have been completed, then please check back in 1/2 hour as we’re uploading more tweets on the fly. Thanks!

Update 2: Thanks for all your help! We are getting lots of traffic, so the Clicker is responding very slowly right now. We’re working on improving speed, thanks for your patience!

Update 3: We collected 182,000+ tweets on Friday from 5am-7pm (local time) and have automatically filtered this down to 35,175 tweets based on relevancy and uniqueness. These 35K tweets are being uploaded to the TweetClicker a few thousand tweets at a time. We’ll be repeating all this for just one more day tomorrow (Saturday). Thanks for your continued support!

Update 4: We/you have clicked through all of Friday’s 35K tweets and currently clicking through today’s 28,202 tweets, which we are about 75% of the way through. Many thanks for tagging along with us, please keep up the top class clicking, we’re almost there! (Sunday, 1pm NY time)

Update 5: Thanks for all your help! We’ll be uploading more tweets tomorrow (Monday, November 11th). To be notified, simply join this list-serve. Thanks again! [updated post on Sunday, November 10th at 5.30pm New York]

Update 6: We’ve uploaded more tweets! This is the final stretch, thanks for helping us on this last sprint of clicks!  Feel free to join our list-serve if you want to be notified when new tweets are available, many thanks! If the system says all tweets have been completed, please check again in 1/2hr as we are uploading new tweets around the clock. [updated Monday, November 11th at 9am London]

Update 7 [Nov 11th @ 1pm London]We’ve just launched the ImageClicker to support the UN’s relief efforts. So please join us in tagging images to provide rapid damage assessments to our humanitarian partners. Our TweetClicker is still in need of your clicks too. If the Clickers are slow, then kindly be patient. If all the tasks are done, please come back in 1/2hr as we’re uploading content to both clickers around the clock. Thanks for caring and helping the relief efforts. An update on the overall digital humanitarian effort is available here.

Update 8 [Nov 11th @ 6.30pm NY]We’ll be uploading more tweets and images to the TweetClicker & ImageClicker by 7am London on Nov 12th. Thank you very much for supporting these digital humanitarian efforts, the results of which are displayed here. Feel free to join our list-serve if you want to be notified when the Clickers have been fed!

Update 9 [Nov 12th @ 6.30am London]: We’ve fed both our TweetClicker and ImageClicker with new tweets and images. So please join us in clicking away to provide our UN partners with the situational awareness they need to coordinate their important relief efforts on the ground. The results of all our clicks are displayed here. Thank you for helping and for caring. If the Clickers or empty or offline temporarily, please check back again soon for more clicks.

Update 10 [Nov 12th @ 10am New York]: Were continuing to feed both our TweetClicker and ImageClicker with new tweets and images. So please join us in clicking away to provide our UN partners with the situational awareness they need to coordinate their important relief efforts on the ground. The results of all our clicks are displayed here. Thank you for helping and for caring. If the Clickers or empty or offline temporarily, please check back again soon for more clicks. Try different browsers if the tweets/images are not showing up.

Update 11 [Nov 12th @ 5pm New York]: Only one more day to go! We’ll be feeding our TweetClicker and ImageClicker with new tweets and images by 7am London on the 13th. We will phase out operations by 2pm London, so this is the final sprint. The results of all our clicks are displayed here. Thank you for helping and for caring. If the Clickers are empty or offline temporarily, please check back again soon for more clicks. Try different browsers if the tweets/images are not showing up.

Update 12 [Nov 13th @ 9am London]: This is the last stretch, Clickers! We’ve fed our TweetClicker and ImageClicker with new tweets and images. We’ll be refilling them until 2pm London (10pm Manila) and phasing out shortly thereafter. Given that MicroMappers is still under development, we are pleased that this deployment went so well considering. The results of all our clicks are displayed here. Thank you for helping and for caring. If the Clickers are empty or offline temporarily, please check back again soon for more clicks. Try different browsers if the tweets/images are not showing up.

Update 13 [Nov 13th @ 11am London]: Just 3 hours left! Our UN OCHA colleagues have just asked us to prioritize the ImageClicker, so please focus on that Clicker. We’ll be refilling the ImageClicker until 2pm London (10pm Manila) and phasing out shortly thereafter. Given that MicroMappers is still under development, we are pleased that this deployment went so well considering. The results of all our clicks are displayed here. Thank you for helping and for caring. If the ImageClicker is empty or offline temporarily, please check back again soon for more clicks. Try different browsers if images are not showing up.

Humanitarian Crisis Computing 101

Disaster-affected communities are increasingly becoming “digital” communities. That is, they increasingly use mobile technology & social media to communicate during crises. I often refer to this user-generated content as Big (Crisis) Data. Humanitarian crisis computing seeks to rapidly identify informative, actionable and credible content in this growing stack of real-time information. The challenge is akin to finding the proverbial needle in the haystack since the vast majority of reports posted on social media is often not relevant for humanitarian response. This is largely a result of the demand versus supply problem described here.

bd0

In any event, the few “needles” of information that are relevant, can relay information that is vital and indeed-life saving for relief efforts—both traditional top-down efforts and more bottom-up grassroots efforts. When disaster strikes, we increasingly see social media traffic explode. We know there are important “pins” of relevant information hidden in this growing stack of information but how do we find them in real-time?

bd2

Humanitarian organizations are ill-equipped to managing the deluge of Big Crisis Data. They tend to sift through the stack of information manually, which means they aren’t able to process more than a small volume of information. This is represented by the dotted green line in the picture below. Big Data is often described as filter failure. Our manual filters cannot manage the large volume, velocity and variety of information posted on social media during disasters. So all the information above the dotted line, Big Data, is completely ignored.

bd3

This is where Advanced Computing comes in. Advanced Computing uses Human and Machine Computing to manage Big Data and reduce filter failure, thus allowing humanitarian organizations to process a larger volume, velocity and variety of crisis information in less time. In other words, Advanced Computing helps us push the dotted green line up the information stack.

bd4

In the early days of digital humanitarian response, we used crowdsourcing to search through the haystack of user-generated content posted during disasters. Note that said content can also include text messages (SMS), like in Haiti. Crowd-sourcing crisis information is not as much fun as the picture below would suggest, however. In fact, crowdsourcing crisis information was (and can still be) quite a mess and a big pain in the haystack. Needless to say, crowdsourcing is not the best filter to make sense of Big Crisis Data.

bd5

Recently, digital humanitarians have turned to microtasking crisis information as described here and here. The UK Guardian and Wired have also written about this novel shift from crowdsourcing to microtasking.

bd6

Microtasking basically turns a haystack into little blocks of stacks. Each micro-stack is then processed by one ore more digital humanitarian volunteers. Unlike crowdsourcing, a microtasking approach to filtering crisis information is highly scalable, which is why we recently launched MicroMappers.

bd7

The smaller the micro-stack, the easier the tasks and the faster that they can be carried out by a greater number of volunteers. For example, instead of having 10 people classify 10,000 tweets based on the Cluster System, microtasking makes it very easy for 1,000 people to classify 10 tweets each. The former would take hours while the latter mere minutes. In response to the recent earthquake in Pakistan, some 100 volunteers used MicroMappers to classify 30,000+ tweets in about 30 hours, for example.

bd8

Machine Computing, in contrast, uses natural language processing (NLP) and machine learning (ML) to “quantify” the haystack of user-generated content posted on social media during disasters. This enable us to automatically identify relevant “needles” of information.

bd9

An example of a Machine Learning approach to crisis computing is the Artificial Intelligence for Disaster Response (AIDR) platform. Using AIDR, users can teach the platform to automatically identify relevant information from Twitter during disasters. For example, AIDR can be used to automatically identify individual tweets that relay urgent needs from a haystack of millions of tweets.

bd11
The pictures above are taken from the slide deck I put together for a keynote address I recently gave at the Canadian Ministry of Foreign Affairs.

bio

Developing MicroFilters for Digital Humanitarian Response

Filtering—or the lack thereof—presented the single biggest challenge when we tested MicroMappers last week in response to the Pakistan Earthquake. As my colleague Clay Shirky notes, the challenge with “Big Data” is not information overload but rather filter failure. We need to make damned sure that we don’t experience filter failure again in future deployments. To ensure this, I’ve decided to launch a stand-alone and fully interoperable platform called MicroFilters. My colleague Andrew Ilyas will lead the technical development of the platform with support from Ji Lucas. Our plan is to launch the first version of MicroFilters before the CrisisMappers conference (ICCM 2013) in November.

MicroFilters

A web-based solution, MicroFilters will allow users to upload their own Twitter data for automatic filtering purposes. Users will have the option of uploading this data using three different formats: text, CSV and JSON. Once uploaded, users can elect to perform one or more automatic filtering tasks from this menu of options:

[   ]  Filter out retweets
[   ]  Filter for unique tweets
[   ]  Filter tweets by language [English | Other | All]
[   ]  Filter for unique image links posted in tweets [Small | Medium | Large | All]
[   ]  Filter for unique video links posted in tweets [Short | Medium | Long | All]
[   ]  Filter for unique image links in news articles posted in tweets  [S | M | L | All]
[   ]  Filter for unique video links in news articles posted in tweets [S | M | L | All]

Note that “unique image and video links” refer to the long URLs not shortened URLs like bit.ly. After selecting the desired filtering option(s), the user simply clicks on the “Filter” button. Once the filtering is completed (a countdown clock is displayed to inform the user of the expected processing time), MicroFilters provides the user with a download link for the filtered results. The link remains live for 10 minutes after which the data is automatically deleted. If a CSV file was uploaded for filtering, the file format for download is also in CSV format; likewise for text and JSON files. Note that filtered tweets will appear in reverse chronological order (assuming time-stamp data was included in the uploaded file) when downloaded. The resulting file of filtered tweets can then be uploaded to MicroMappers within seconds.

In sum, MicroFilters will be invaluable for future deployments of MicroMappers. Solving the “filter failure” problem will enable digital humanitarians to process far more relevant data and in a more timely manner. Since MicroFilters will be a standalone platform, anyone else will also have access to these free and automatic filtering services. In the meantime, however, we very much welcome feedback, suggestions and offers of help, thank you!

bio

Results of MicroMappers Response to Pakistan Earthquake (Updated)

Update: We’re developing & launching MicroFilters to improve MicroMappers.

About 47 hours ago, the UN Office for the Coordination of Humanitarian Affairs (OCHA) activated the Digital Humanitarian Network (DHN) in response to the Pakistan Earthquake. The activation request was for 48 hours, so the deployment will soon phase out. As already described here, the Standby Volunteer Task Force (SBTF) teamed up with QCRI to carry out an early test of MicroMappers, which was not set to launch until next month. This post shares some initial thoughts on how the test went along with preliminary results.

Pakistan Quake

During ~40 hours, 109 volunteers from the SBTF and the public tagged just over 30,000 tweets that were posted during the first 36 hours or so after the quake. We were able to automatically collect these tweets thanks to our partnership with GNIP and specifically filtered for said tweets using half-a-dozen hashtags. Given the large volume of tweets collected, we did not require that each tweet be tagged at least 3 times by individual volunteers to ensure data quality control. Out of these 30,000+ tweets, volunteers tagged a total of 177 tweets as noting needs or infrastructure damage. A review of these tweets by the SBTF concluded that none were actually informative or actionable.

Just over 350 pictures were tweeted in the aftermath of the earthquake. These were uploaded to the ImageClicker for tagging purposes. However, none of the pictures captured evidence of infrastructure damage. In fact, the vast majority were unrelated to the earthquake. This was also true of pictures published in news articles. Indeed, we used an automated algorithm to identify all tweets with links to news articles; this algorithm would then crawl these articles for evidence of images. We found that the vast majority of these automatically extracted pictures were related to politics rather than infrastructure damage.

Pakistan Quake2

A few preliminary thoughts and reflections from this first test of MicroMappers. First, however, a big, huge, gigantic thanks to my awesome QCRI team: Ji Lucas, Imran Muhammad and Kiran Garimella; to my outstanding colleagues on the SBTF Core Team including but certainly not limited to Jus Mackinnon, Melissa Elliott, Anahi A. Iaccuci, Per Aarvik & Brendan O’Hanrahan (bios here); to the amazing SBTF volunteers and members of the general public who rallied to tag tweets and images—in particular our top 5 taggers: Christina KR, Leah H, Lubna A, Deborah B and Joyce M! Also bravo to volunteers in the Netherlands, UK, US and Germany for being the most active MicroMappers; and last but certainly not least, big, huge and gigantic thanks to Andrew Ilyas for developing the algorithms to automatically identify pictures and videos posted to Twitter.

So what did we learn over the past 48 hours? First, the disaster-affected region is a remote area of south-western Pakistan with a very light social media footprint, so there was practically no user-generated content directly relevant to needs and damage posted on Twitter during the first 36 hours. In other words, there were no needles to be found in the haystack of information. This is in stark contrast to our experience when we carried out a very similar operation following Typhoon Pablo in the Philippines. Obviously, if there’s little to no social media footprint in a disaster-affected area, then monitoring social media is of no use at all to anyone. Note, however, that MicroMappers could also be used to tag 30,000+ text messages (SMS). (Incidentally, since the earthquake struck around 12noon local time, there was only about 18 hours of daylight during the 36-hour period for which we collected the tweets).

Second, while the point of this exercise was not to test our pre-processing filters, it was clear that the single biggest problem was ultimately with the filtering. Our goal was to upload as many tweets as possible to the Clickers and stress-test the apps. So we only filtered tweets using a number of general hashtags such as #Pakistan. Furthermore, we did not filter out any retweets, which probably accounted for 2/3 of the data, nor did we filter by geography to ensure that we were only collecting and thus tagging tweets from users based in Pakistan. This was a major mistake on our end. We were so pre-occupied with testing the actual Clickers that we simply did not pay attention to the pre-processing of tweets. This was equally true of the images uploaded to the ImageClicker.

Pakistan Quake 3

So where do we go from here? Well we have pages and pages worth of feedback to go through and integrate in the next version of the Clickers. For me, one of the top priorities is to optimize our pre-processing algorithms and ensure that the resulting output can be automatically uploaded to the Clickers. We have to refine our algorithms and make damned sure that we only upload unique tweets and images to our Clickers. At most, volunteers should not see the same tweet or image more than 3 times for verification purposes. We should also be more careful with our hashtag filtering and also consider filtering by geography. Incidentally, when our free & open source AIDR platform becomes operational in November, we’ll also have the ability to automatically identify tweets referring to needs, reports of damage, and much, much more.

In fact, AIDR was also tested for the very first time. SBTF volunteers tagged about 1,000 tweets, and just over 130 of the tags enabled us to create an accurate classifier that can automatically identify whether a tweet is relevant for disaster response efforts specifically in Pakistan (80% accuracy). Now, we didn’t apply this classifier on incoming tweets because AIDR uses streaming Twitter data, not static, archived data which is what we had (in the form of CSV files). In any event, we also made an effort to create classifiers for needs and infrastructure damage but did not get enough tags to make these accurate enough. Typically, we need a minimum of 20 or so tags (i.e., examples of actual tweets referring to needs or damage). The more tags, the more accurate the classifier.

The reason there were so few tags, however, is because there were very few to no informative tweets referring to needs or infrastructure damage during the first 36 hours. In any event, I believe this was the very first time that a machine learning classifier was crowdsourced for disaster response purposes. In the future, we may want to first crowdsource a machine learning classifier for disaster relevant tweets and then upload the results to MicroMappers; this would reduce the number of unrelated tweets  displayed on a TweetClicker.

As expected, we have also received a lot of feedback vis-a-vis user experience and the user interface of the Clickers. Speed is at the top of the list. That is, making sure that once I’ve clicked on a tweet/image, the next tweet/image automatically appears. At times, I had to wait more than 20 seconds for the next item to load. We also need to add more progress bars such as the number of tweets or images that remain to be tagged—a countdown display, basically. I could go on and on, frankly, but hopefully these early reflections are informative and useful to others developing next-generation humanitarian technologies. In sum, there is a lot of work to be done still. Onwards!

bio