Category Archives: Social Media

Data Protection: This Tweet Will Self-Destruct In…

The permanence of social media such as tweets presents an important challenge for data protection and privacy. This is particularly true when social media is used to communicate during crises. Indeed, social media users tend to volunteer personal identifying information during disasters that they otherwise would not share, such as phone numbers and home addresses. They typically share this sensitive information to offer help or seek assistance. What if we could limit the visibility of these messages after their initial use?

Twitter self destruct

Enter TwitterSpirit and Efemr, which enable users to schedule their tweets for automatic deletion after a specified period of time using hashtags like #1m, #2h or #3d. According to Wired, using these services will (in some cases) also delete retweets. That said, tweets with #time hashtags can always be copied manually in any number of ways, so the self-destruction is not total. Nevertheless, their visibility can still be reduced by using TwitterSpirit and Efemr. Lastly, the use of these hashtags also sends a social signal that these tweets are intended to have limited temporal use.

bio

Note: My fellow PopTech and Rockefeller Foundation Fellows and I have been thinking of related solutions, which we plan to blog about shortly. Hence my interest in Spirit & Efemr, which I stumbled upon by chance just now.

New! Humanitarian Computing Library

The field of “Humanitarian Computing” applies Human Computing and Machine Computing to address major information-based challengers in the humanitarian space. Human Computing refers to crowdsourcing and microtasking, which is also referred to as crowd computing. In contrast, Machine Computing draws on natural language processing and machine learning, amongst other disciplines. The Next Generation Humanitarian Technologies we are prototyping at QCRI are powered by Humanitarian Computing research and development (R&D).

Screen Shot 2013-09-04 at 3.00.05 AM

My QCRI colleagues and I  just launched the first ever Humanitarian Computing Library which is publicly available here. The purpose of this library, or wiki, is to consolidate existing and future research that relate to Humanitarian Computing in order to support the development of next generation humanitarian tech. The repository currently holds over 500 publications that span topics such as Crisis Management, Trust and Security, Software and Tools, Geographical Analysis and Crowdsourcing. These publications are largely drawn from (but not limited to) peer-reviewed papers submitted at leading conferences around the world. We invite you to add your own research on humanitarian computing to this growing collection of resources.

Many thanks to my colleague ChaTo (project lead) and QCRI interns Rahma and Nada from Qatar University for spearheading this important project. And a special mention to student Rachid who also helped.

bio

Can Official Disaster Response Apps Compete with Twitter?

There are over half-a-billion Twitter users, with an average of 135,000 new users signing up on a daily basis (1). Can emergency management and disaster response organizations win over some Twitter users by convincing them to use their apps in addition to Twitter? For example, will FEMA’s smartphone app gain as much “market share”? The app’s new crowdsourcing feature, “Disaster Reporter,” allows users to submit geo-tagged disaster-related images, which are then added to a public crisis map. So the question is, will more images be captured via FEMA’s app or from Twitter users posting Instagram pictures?

fema_app

This question is perhaps poorly stated. While FEMA may not get millions of users to share disaster-related pictures via their app, it is absolutely critical for disaster response organizations to explicitly solicit crisis information from the crowd. See my blog post “Social Media for Emergency Management: Question of Supply and Demand” for more information on the importance demand-driven crowdsourcing. The advantage of soliciting crisis information from a smartphone app is that the sourced information is structured and thus easily machine readable. For example, the pictures taken with FEMA’s app are automatically geo-tagged, which means they can be automatically mapped if need be.

While many, many more picture may be posted on Twitter, these may be more difficult to map. The vast majority of tweets are not geo-tagged, which means more sophisticated computational solutions are necessary. Instagram pictures are geo-tagged, but this information is not publicly available. So smartphone apps are a good way to overcome these challenges. But we shouldn’t overlook the value of pictures shared on Twitter. Many can be geo-tagged, as demonstrated by the Digital Humanitarian Network’s efforts in response to Typhoon Pablo. More-over, about 40% of pictures shared on Twitter in the immediate aftermath of the Oklahoma Tornado had geographic data. In other words, while the FEMA app may have 10,000 users who submit a picture during a disaster, Twitter may have 100,000 users posting pictures. And while only 40% of the latter pictures may be geo-tagged, this would still mean 40,000 pictures compared to FEMA’s 10,000. Recall that over half-a-million Instagram pictures were posted during Hurricane Sandy alone.

The main point, however, is that FEMA could also solicit pictures via Twitter and ask eyewitnesses to simply geo-tag their tweets during disasters. They could also speak with Instagram and perhaps ask them to share geo-tag data for solicited images. These strategies would render tweets and pictures machine-readable and thus automatically mappable, just like the pictures coming from FEMA’s app. In sum, the key issue here is one of policy and the best solution is to leverage multiple platforms to crowdsource crisis information. The technical challenge is how to deal with the high volume of pictures shared in real-time across multiple platforms. This is where microtasking comes in and why MicroMappers is being developed. For tweets and images that do not contain automatically geo-tagged data, MicroMappers has a microtasking app specifically developed to crowd-source the manual tagging of images.

In sum, there are trade-offs. The good news is that we don’t have to choose one solution over the other; they are complementary. We can leverage both a dedicated smartphone app and very popular social media platforms like Twitter and Facebook to crowdsource the collection of crisis information. Either way, a demand-driven approach to soliciting relevant information will work best, both for smartphone apps and social media platforms.

Bio


Taking the Pulse of the Boston Marathon Bombings on Twitter

Social media networks are evolving a new nervous system for our planet. These real-time networks provide immediate feedback loops when media-rich societies experience a shock. My colleague Todd Mostak recently shared the tweet map below with me which depicts tweets referring to “marathon” (in red) shortly after the bombs went off during Boston’s marathon. The green dots represent all the other tweets posted at the time. Click on the map to enlarge. (It is always difficult to write about data visualizations of violent events because they don’t capture the human suffering, thus seemingly minimizing the tragic events).

Credit: Todd Mostak

Visualizing a social system at this scale gives a sense that we’re looking at a living, breathing organism, one that has just been wounded. This impression is even more stark in the dynamic visualization captured in the video below.

This an excerpt of Todd’s longer video, available here. Note that this data visualization uses less than 3% of all posted tweets because 97%+ of tweets are not geo-tagged. So we’re not even seeing the full nervous system in action. For more analysis of tweets during the marathon, see this blog post entitled “Boston Marathon Explosions: Analyzing First 1,000 Seconds on Twitter.”

bio

Map: 24 hours of Tweets in New York

The map below depicts geo-tagged tweets posted between May 4-5, 2013 in the New York City area. Over 36,000 tweets are posted on the map (click to enlarge). Since less than 3% of all tweets are geo-tagged, the map is missing the vast majority of tweets posted in this area during those 24 hours.

New York Tweets 24 hours

Contrast the above with the 1-month worth of tweets (April-May 2013) depicted in the map below. Again, the visualization misses the vast majority of tweets since these are not geo-tagged and thus not mappable.

New York 1 Month Tweets

These visuals are screenshots of Harvard’s Tweetmap platform, which is publicly available here. My colleague Todd Mostak is one of the main drivers behind Tweetmap, so worth sending him a quick thank you tweet! Todd is working on some exciting extensions and refinements, so stay tuned as I’ll be sure to blog about them when they go live.

Bio

Why Digital Social Capital Matters for Disaster Resilience and Response

Recent empirical studies have clearly demonstrated the importance of offline social capital for disaster resilience and response. I’ve blogged about some of this analysis here and here. Social capital is typically described as those “features of social organizations, such as networks, norms, and trust, that facilitate action and cooperation for mutual benefit.” In other words, social capital increases a group’s capacity for collective action and thus self-organization, which is a key driver of disaster resilience. What if those social organizations were virtual and the networks digital? Would these online communities “generate digital social capital”? And would this digital social capital have any impact on offline social capital, collective action and resilience?

Social Capital

A data-driven study published recently, “Social Capital and Pro-Social Behavior Online and Offline” (PDF), presents some fascinating insights. The study, carried out by Constantin M. Bosancianu, Steve Powell and Esad Bratovi, draws on their survey of 1,912 Internet users in Bosnia & Herzegovina, Croatia and Serbia. The authors specifically consider two types of social capital: bonding social capital and bridging social capital. “

“Bridging social capital is described as inclusive, fostered in networks where membership is not restricted to a particular group defined by strict racial, class, linguistic or ethnic criteria.  Regular interactions inside these networks would gradually build norms of generalized trust and reciprocity at the individual level. These relationships […] are able to offer the individual access to new information but are not very adept in providing emotional support in times of need.”

“Bonding social capital, on the other hand, is exclusive, fostered in tight-knit networks of family members and close friends. Although the degree of information redundancy in these networks is likely high (as most members occupy the same social space), they provide […] the “sociological superglue” which gets members through tough emotional stages in their lives.”

The study’s findings reveal that online and offline social capital were correlated with each other. More specifically, online bridging social capital was closely correlated with offline bridging social capital, while online binding social capital was closely correlated with offline binding social capital. Perhaps of most interest with respect to disaster resilience, the authors discovered that “offline bridging social capital can benefit from online interactions.”

bio

TEDx: Using Crowdsourcing to Verify Social Media for Disaster Response


My TEDx talk on Digital Humanitarians presented at TEDxTraverseCity. I’ve automatically forwarded the above video to the section on Big (false) Data and the use of time-critical crowdsourcing to verify social media reports shared during disasters. The talk describes the rationale behind the Verily platform that my team and I at QCRI are developing with our partners at the Masdar Institute of Technology (MIT) in Dubai. The purpose of Verily is to accelerate the process of verification by crowdsourcing evidence collection and critical thinking. See my colleague ChaTo’s excellent slide deck on Verily for more information.


bio

TEDx: Microtasking for Disaster Response

My TEDx talk on Digital Humanitarians presented at TEDxTraverseCity. I’ve automatically forwarded the above video to a short 4 minute section of the talk in which I highlight how the Digital Humanitarian Network (DHN) used micro-tasking to support the UN Office for the Coordination of Humanitarian Affairs (OCHA) in response to Typhoon Pablo in the Philippines. See this blog post to learn more about the operation. As a result of this innovative use of micro-tasking, my team and I at QCRI are collaborating with UN OCHA colleagues to launch MicroMappers—a dedicated set of microtasking apps specifically designed for disaster response. These will go live in September 2013.


bio


Disaster Response Plugin for Online Games

The Internet Response League (IRL) was recently launched for online gamers to participate in supporting disaster response operations. A quick introduction to IRL is available here. Humanitarian organizations are increasingly turning to online volunteers to filter through social media reports (e.g. tweets, Instagram photos) posted during disasters. Online gamers already spend millions of hours online every day and could easily volunteer some of their time to process crisis information without ever having to leave the games they’re playing.

A message like this would greet you upon logging in. (Screenshot is from World of Warcraft and has been altered)

Lets take World of Warcraft, for example. If a gamer has opted in to receive disaster alerts, they’d see screens like the one above when logging in or like the one below whilst playing a game.

In game notification should have settings so as to not annoy players. (Screenshot is from World of Warcraft and has been altered)

If a gamer accepts the invitation to join the Internet Response League, they’d see the “Disaster Tagging” screen below. There they’d tag as many pictures as wish by clicking on the level of disaster damage they see in each photo. Naturally, gamers can exit the disaster tagging area at any time to return directly to their game.

A rough concept of what the tagging screen may look like. (Screenshot is from World of Warcraft and has been altered)

Each picture would be tagged by at least 3 gamers in order to ensure the accuracy of the tagging. That is, if 3 volunteers tag the same image as “Severe”, then we can be reasonably assured that the picture does indeed show infrastructure damage. These pictures would then be sent back to IRL and shared with humanitarian organizations for rapid damage assessment analysis. There are already precedents for this type of disaster response tagging. Last year, the UN asked volunteers to tag images shared on Twitter after a devastating Typhoon hit the Philippines. More specifically, they asked them to tag images that captured the damage caused by the Typhoon. You can learn more about this humanitarian response operation here.

IRL is now looking to develop a disaster response plugin like the one described above. This way, gaming companies will have an easily embeddable plugin that they can insert into their gaming environments. For more on this plugin and the latest updates on IRL, please visit the IRL website here. We’re actively looking for feedback and welcome collaborators and partnerships.

Bio

Acknowledgements: Screenshots created by my colleague Peter Mosur who is the co-founder of the IRL.

Using Social Media to Predict Disaster Resilience (Updated)

Social media is used to monitor and predict all kinds of social, economic, political and health-related behaviors these days. Could social media also help identify more disaster resilient communities? Recent empirical research reveals that social capital is the most important driver of disaster resilience; more so than economic and material resources. To this end, might a community’s social media footprint indicate how resilience it is to disasters? After all, “when extreme events at the scale of Hurricane Sandy happen, they leave an unquestionable mark on social media activity” (1). Could that mark be one of resilience?

Twitter Heatmap Hurricane

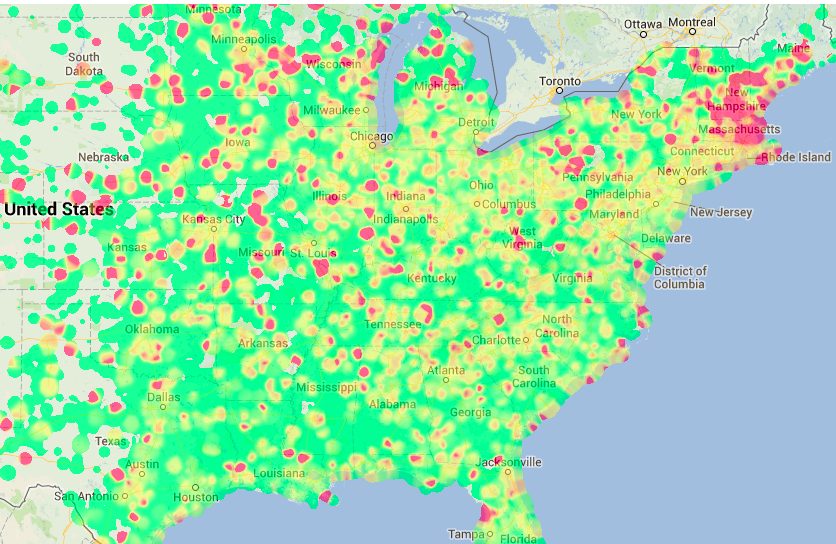
Sentiment analysis map of tweets posted during Hurricane Sandy.
Click on image to learn more.

In the immediate aftermath of a disaster, “social ties can serve as informal insurance, providing victims with information, financial help and physical assistance” (2). This informal insurance, “or mutual assistance involves friends and neighbors providing each other with information, tools, living space, and other help” (3). At the same time, social media platforms like Twitter are increasingly used to communicate during crises. In fact, data driven research on tweets posted during disasters reveal that many tweets provide victims with information, help, tools, living space, assistance and other more. Recent studies argue that “such interactions are not necessarily of inferior quality compared to simultaneous, face-to-face interactions” (4). What’s more, “In addition to the preservation and possible improvement of existing ties, interaction through social media can foster the creation of new relations” (5). Meanwhile, and “contrary to prevailing assumptions, there is evidence that the boom in social media that connects users globally may have simultaneously increased local connections” (6).

A recent study of 5 billion tweets found that Japan, Canada, Indonesia and South Korea have highest percentage of reciprocity on Twitter (6). This is important because “Network reciprocity tells us about the degree of cohesion, trust and social capital in sociology” (7). In terms of network density, “the highest values correspond to South Korea, Netherlands and Australia.” The findings further reveal that “communities which tend to be less hierarchical and more reciprocal, also displays happier language in their content updates. In this sense countries with high conversation levels … display higher levels of happiness too” (8).

A related study found that the language used in tweets can be used to predict the subjective well-being of those users (9). The same analysis revealed that the level of happiness expressed by Twitter users in a community are correlated with members of that same community who are not on social media. Data-driven studies on happiness also show that social bonds and social activities are more conducive to happiness than financial capital (10). Social media also includes blogs. A new study analyzed more than 18.5 million blog posts found that “bloggers with lower social capital have fewer positive moods and more negative moods [as revealed by their posts] than those with higher social capital” (11).

Collectivism vs Individualism countries

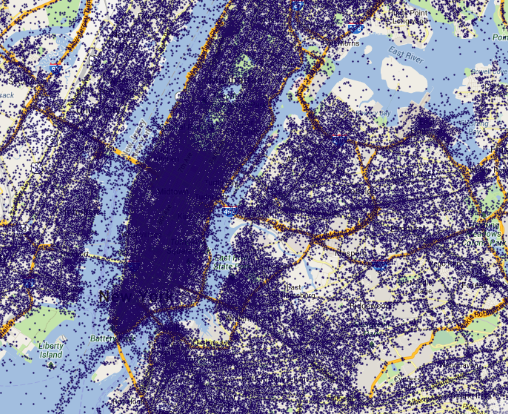
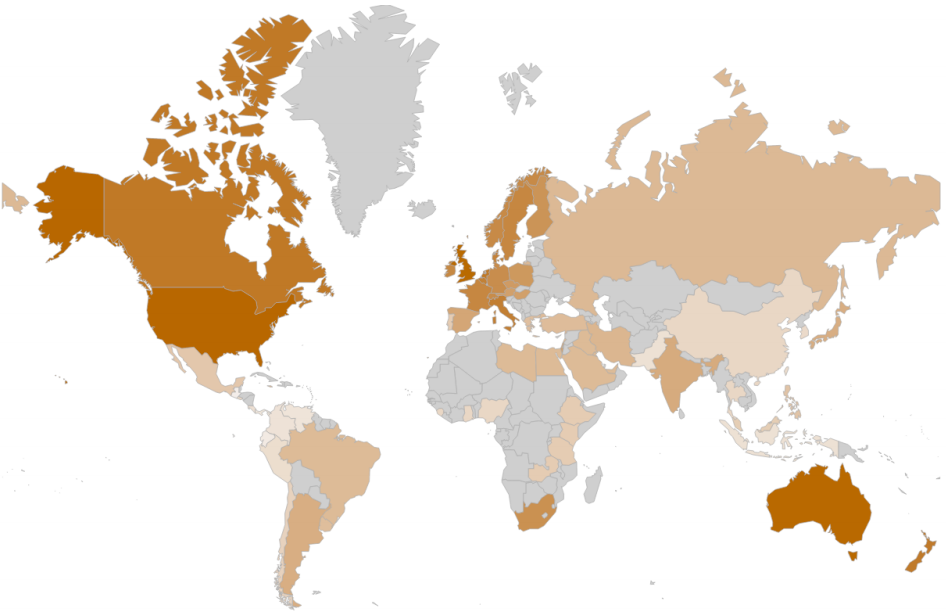
Finally, another recent study analyzed more than 2.3 million twitter users and found that users in collectivist countries engage with others more than those in individualistic countries (12). “In high collectivist cultures, users tend to focus more on the community to which they belong,” while  people in individualistic countries are “in a more loosely knit social network,” and so typically “look after themselves or only after immediate family members” (13). The map above displays collectivist and individualistic countries; with the former represented by lighter shades and the latter darker colors.

In sum, one should be able to measure “digital social capital” and thus disaster resilience by analyzing social media networks before, during and after disasters. “These disaster responses may determine survival, and we can measure the likelihood of them happening” via digital social capital dynamics reflected on social media (14). One could also combine social network analysis with sentiment analysis to formulate various indexes. Anyone interested in pursuing this line of research?

bio